

Abstract
Passive cavitation imaging provides spatially resolved monitoring of cavitation emissions. However the diffraction limit of a linear imaging array results in relatively poor range resolution. Poor range resolution has limited prior analyses of the spatial specificity and sensitivity of passive cavitation imaging for predicting thermal lesion formation. In this study, this limitation is overcome by orienting a linear array orthogonal to the HIFU propagation direction and performing passive imaging. Fourteen lesions were formed in ex vivo bovine liver samples as a result of 1.1 MHz continuous-wave ultrasound exposure. The lesions were classified as focal, “tadpole”, or pre-focal based on their shape and location. Passive cavitation images were beam-formed from emissions at the fundamental, harmonic, ultraharmonic, and inharmonic frequencies with an established algorithm. Using the area under a receiver operator characteristic curve (AUROC), fundamental, harmonic, and ultraharmonic emissions were shown to be significant predictors of lesion formation for all lesion types. For both harmonic and ultraharmonic emissions, pre-focal lesions were classified most successfully (AUROC values of 0.87 and 0.88, respectively), followed by tadpole lesions (AUROC values of 0.77 and 0.64, respectively), and focal lesions (AUROC values of 0.65 and 0.60, respectively).
Keywords: thermal ablation monitoring, passive acoustic mapping, cavitation, receiver operating characteristic curve, ultrasound-guided ablation
Introduction
The pace of development of clinical applications of high-intensity focused ultrasound (HIFU) thermal ablation has increased over the last 10 years. Clinical trials with successful outcomes have been reported in the treatment of cancer (Wu et al., 2004; Liberman et al., 2009; Xu et al., 2011; Ng et al., 2011), neurological disorders (Jeanmonod et al., 2012; Elias et al., 2013), and uterine fibroids (Voogt et al., 2012; Kim et al., 2012). Concurrent with these successes have been the development and implementation of methods for predicting when and where a lesion has formed. The inability to monitor lesion formation remains a limitation (Zhou, 2011). Currently, MRI thermometry and B-mode ultrasound are used clinically to predict lesion formation (Aubry et al., 2013). MRI thermometry can accurately and quantitatively determine the temperature rise from HIFU but necessitates the use of both an expensive MRI system and MRI-compatible HIFU arrays (Tempany et al., 2003; Chapman and ter Haar, 2007; Köhler et al., 2009). Additionally MRI thermometry in fatty tissues is difficult due to the differing response of adipose and aqueous media to temperature (Rieke and Butts Pauly, 2008; Merckel et al., 2013). With the growing obesity epidemic in developed countries (Alwan, 2011), this current limitation may become more problematic. B-mode ultrasound relies on feedback from boiling bubbles in tissue, which is an indicator of overtreatment (Yu and Xu, 2008). Therefore alternate methods for image-guidance of HIFU thermal ablation are desirable.
HIFU-induced acoustic cavitation accelerates tissue heating (Coussios et al., 2007). This observation has motivated the use of cavitation detection as a means of monitoring HIFU thermal ablation. One commonly used approach is single-element passive cavitation detection. Passive cavitation detectors (PCDs) monitor cavitation emissions induced by a separate therapy transducer. PCDs can be used to monitor the different types of cavitation, which can result in mechanistically different forms of heating (Holt and Roy, 2005). Stable cavitation, often characterized by harmonic emissions (i.e. multiples of the fundamental insonation frequency) or ultraharmonic emissions (e.g. odd multiples of one-half the fundamental insonation frequency), can cause viscous heating. Inertial cavitation can cause heating via absorption of broadband emissions, which are observed by the PCD as energy in the inharmonic frequency bands (i.e. bands that exclude the fundamental, harmonic, and ultraharmonic frequencies).
Single-element PCDs are limited by the trade-off between spatial sensitivity and specificity. A focused single-element transducer has a relatively small detection region over which it is sensitive. Cavitation emissions that occur outside of the sensitive region will not be detected. Thus, focused single-element PCDs exhibit good spatial specificity but poor spatial sensitivity. Unfocused single-element PCDs suffer from the opposite limitation. The detection region is relatively large, making them sensitive to a large spatial volume. However, the precise origin of the detected cavitation emissions is unknown and thus unfocused single-element PCDs exhibit poor spatial specificity. This limitation is problematic because the HIFU pressure varies substantially as a function of location. Similarly, large temperature gradients are observed in the ablated medium. Hence, the concomitant bubble activity shows significant spatial variations.
Passive cavitation detection using ultrasound imaging arrays has been described as a means of overcoming the limitations of single-element PCDs. Array-based PCDs allow cavitation emissions recorded by individual elements of the array to be beamformed. This beamforming enables spatial specificity and sensitivity. In many ways the advantages of array-based PCDs over single-element PCDs is analogous to array-based B-mode ultrasound imaging over single-element A-mode detection. Gyöngy et al. (2008), Salgaonkar et al. (2009), and Farny et al. (2009) all described similar timedomain approaches to forming passive cavitation images (alternatively referred to as passive acoustic maps). The differences in their techniques derived in large part from the capabilities of the ultrasound imaging array systems they employed. More recently Haworth et al. (2012) used a Fourierdomain approach to demonstrate that the imaging resolution is determined by diffraction and not the ultrasound pulse shape and duration.
Jensen et al. (2012) have reported on the use of passive cavitation images and B-mode images to predict the formation of thermal lesions in ex vivo bovine liver. Passive cavitation images were used to monitor cavitation energy (either broadband or harmonic) in a 10 mm × 10 mm window centered about the HIFU focus. The total energy was used to predict whether a lesion formed. However, the location of the lesion within the window was not determined. Jensen et al. (2012) found that at peak negative insonation pressures above 5.4 MPa passive cavitation imaging was superior to B-mode imaging for the rate of correctly predicting whether a lesion was formed (an accuracy of 84% versus 53%), the proportion of lesions that were correctly predicted (a sensitivity of 85% versus 48%), and the proportion of negative predictions that were correct (a negative predictive value of 53% versus 24%). These results support the feasibility of passive cavitation imaging for monitoring if a lesion forms, but they do not address whether passive cavitation imaging can be used to resolve where a lesion forms.
The objective of this study was to assess the ability of passive cavitation imaging to predict HIFU thermal ablation lesion formation quantitatively. This objective was pursued using an established passive cavitation imaging algorithm (Salgaonkar et al., 2009) and modifying the transducer arrangement of Jensen et al. (2012). Passive cavitation images were compared to optical images after exposure to HIFU. The ability to use passive cavitation imaging to predict where a lesion formed was assessed using receiver operator characteristic (ROC) curves. The sensitivity and specificity of predicting both the presence and spatial extent of HIFU lesions were determined. This analysis is a crucial step toward the development of cavitation-based non-invasive image-guided feedback for HIFU therapies.
Materials and Methods
Ablation procedure
The overall experimental setup can be seen in Fig. 1 and has been described in detail by Salgaonkar (2009). As highlighted in previous studies, passive cavitation images obtained with diagnostic linear arrays provide millimeter to sub-millimeter resolution in the azimuthal direction, but significantly poorer resolution along the range direction (Salgaonkar et al., 2009; Gyöngy and Coussios, 2010; Haworth et al., 2012). Therefore an orthogonal orientation between the HIFU therapy transducer and passive imaging array was implemented. Although this geometry is not practical for some clinical applications due to the available acoustic windows, the geometry allowed for good passive cavitation imaging resolution along the axial length of the thermal ablation lesion. For the L7 linear array (Ardent Sound, Mesa, AZ, USA) used in this study, the azimuthal and range resolutions based on the diffraction pattern of the linear array at the center of the passive cavitation images at 1.1 MHz were 1.5 mm and 9.7 mm, respectively (McGough, 2004; Chen and McGough, 2008; Haworth et al., 2012). The azimuthal resolution enabled a quantitative spatial analysis of the ability of passive cavitation images to be used to predict where a thermal ablation lesion was formed along the HIFU axis of propagation.
Figure 1.

Diagram of experimental HIFU ablation setup (top view).
Fourteen ex vivo bovine liver samples obtained from a slaughterhouse were exposed to 1.1 MHz, focused, continuous-wave (CW) ultrasound at an acoustic power of 40 W for 30 s. The exposure duration was longer than those typically used in HIFU ablation studies to ensure ablative lesions were large enough for consistent optical detection as described below. Similar prolonged exposures have been reported by McLaughlan et al. (2010). The acoustic power output was calibrated with a radiation force balance. The HIFU transducer (H-101, Sonic Concepts, Inc., Woodenville, WA, USA) was driven with a signal generator (33220A, Agilent, Santa Clara, CA, USA) and a power amplifier (3100L, ENI, Bell Electronics, Kent, WA, USA), through a custom impedance matching network (Sonic Concepts, Inc., Woodenville, WA, USA). The HIFU source had a radius of 32 mm and was spherically focused at 63 mm. The full-widths at half-maximum in the lateral and axial directions for the HIFU transducer were calculated to be 1.9 mm and 11.8 mm, respectively (Kelly and McGough, 2006; Chen and McGough, 2008; Kelly and McGough, 2009). The HIFU focus was aligned approximately 15 mm inside the tissue sample. The liver sample was held in an acrylic container with acoustically transparent Tegaderm (3M, St. Paul, MN, USA) windows. The sample holder was placed in a tank of deionized, degassed water that had a dissolved oxygen content below 25% of saturation relative to air at 1 atm of pressure at 22 °C in air.
The nominal peak intensity, peak positive pressure, and peak negative pressure were estimated using the Khokhlov-Zabolotskaya-Kuznetsov (KZK) equation (Soneson, 2011). The estimated values were 2415 W/cm2, 11.8 MPa, and 7.3 MPa, respectively. The water path was modeled with a speed of sound of 1482 m/s, mass density of 1000 kg/m3, attenuation at 1 MHz of 0.217 dB/m, frequency power law attenuation exponent of 2, and nonlinear B/A parameter of 5. The liver was modeled with a speed of sound of 1595 m/s, mass density of 1060 kg/m3, attenuation at 1 MHz of 50 dB/m, frequency power law attenuation exponent of 1.2, and nonlinear B/A parameter of 6.6 (White et al., 1998).
Tissue handling
Fresh ex vivo bovine livers were used within 4 hours post mortem. During this time period, tissue samples were immersed in ice-cold phosphate-buffered saline (PBS). Tissue samples were not degased due to concerns that the negative pressure from vacuum may pull bubbles out of solution, which could become entrapped in the relatively large liver sample, and that degassing would increase the time between excision and ultrasound insonation, potentially resulting in exacerbated tissue degradation. Before an experiment, a 6 × 6 × 10 cm3 piece, which included an intact capsule on one 6 × 10 cm2 surface, was cut from the liver and placed in the acrylic container with Tegaderm windows. A small amount of either degassed water from the tank (≈30 ml) or degassed phosphate-buffered saline was added to the sample and the Tegaderm walls manipulated to remove any visible air pockets. No differences in the tissue integrity were observed between using water or saline based on a review of the scanned optical images described below. Furthermore, the surface of the liver sample, which came into contact with the water or saline, was not included in the analysis described below.
The tissue sample was aligned using B-mode images such that the intact liver capsule surface was aligned with the edge of the passive imaging array closest to the HIFU transducer (Fig. 1). Following HIFU exposure, the tissue samples were placed in a rigid box of the same dimensions to maintain the tissue shape and frozen overnight at −80 °C. The frozen tissue samples were 2 mm thick and sliced parallel to the image plane and the HIFU propagation direction. The sections were digitally photographed at 1500 pixels per inch with a conventional flat-bed scanner (CanonScan 8800F, Canon, Lake Success, NY). Images were analyzed using MATLAB (R2012b, The Mathworks Inc., Natick, USA).
The thermal lesions could be identified through gross tissue discoloration. The optical images were converted to grayscale images. A binary image identifying normal or ablated tissue was obtained using automatic segmentation based on a threshold grayscale value. The threshold grayscale value was selected to minimize the difference in lesion areas computed via automatic segmentation and manual segmentation (Mast et al., 2008) for a subset of lesions. The ablated region was manually confirmed to avoid artifacts from tissue inhomogeneities, such as blood vessels. The process employed was similar to the description provided by Mast et al. (2008). The binary optical images of the lesions were dimensionally reduced by projecting along the range dimension of a passive imaging array to create a one-dimensional line plot of the azimuthal extent of the lesion (Figs. 2C and 2D).
Figure 2.

Outline of the processing steps performed on the cavitation data and optical scan of the lesion. (A) Beamformed cavitation data as a function of time and the linear array azimuth. (B) The beamformed cavitation data is processed according to Eqn. 2 or Eqn. 3 to produce a one-dimensional data set. (C) The lesion that was created during the same experiment as the cavitation measurements in Fig. 2A. (D) The optical data was processed to produce a one-dimensional binary data set, where a value of 1 indicates the location of ablated tissue and 0 is non-ablated tissue. (E) The one-dimensional PCI and optical data are plotted together. The horizontal orange dotted line represents one example threshold value used during an ROC analysis. (F) The PCI data is converted to binary data based on whether it is greater than or less than the threshold value at each azimuthal location. The orange shading represents the locations where this threshold would predict a lesion to have formed. To build the ROC curve, the threshold value used for predicting lesion formation is varied between 0 and 1. For each threshold value the sensitivity and specificity are calculated.
Prior to dimensional reduction, lesions were categorized as focal, tadpole, or pre-focal based on their shape and location. The tissue was divided into three regions relative to the HIFU therapy range direction. The focal zone was defined as the axial extent within −3 dB of the maximum focal pressure of the therapy transducer. Regions distal to the focus (relative to the therapy transducer) were defined as post-focal and regions proximal were defined as pre-focal. Focal and tadpole lesions were categorized using common HIFU ablation nomenclature (Watkin et al., 1996; Khokhlova et al., 2006; Farny et al., 2009). Focal lesions had a traditional “cigar” shape and were located near the focus of the HIFU therapy transducer, sometimes extending into the post-focal zone but not into the pre-focal zone. Tadpole lesions were defined by their shape, which was narrowest distal to the HIFU transducer and widest proximal to the HIFU transducer. The tadpole lesions always occurred in the focal zone, but sometimes extended into either the pre-focal or post-focal zones. Pre-focal lesions were located entirely in the pre-focal region.
Cavitation measurements and processing
A 192 element linear array, with a 7.5 MHz nominal center frequency, controlled by the manufacturer’s software installed on an Iris 2 ultrasound imaging system (Ardent Sound, Mesa, AZ, USA) was used to capture B-mode and passive cavitation images. The azimuthal and range directions are described in Fig. 1. The surface of the array was defined as a range of 0 mm. The center of the imaging array was define as an azimuth of 0 mm, with the positive direction being the edge of the passive imaging array closest to the HIFU transducer. The HIFU focus was 25–35 mm from the face of the imaging array and at +6 mm azimuthally. B-mode images were captured before and after HIFU insonation for most lesions.
Passive cavitation images were created using beamformed data captured during an ablation exposure utilizing methods similar to those described by Salgaonkar et al. (2009). These methods and modifications from Salgaonkar et al. (2009) are briefly described as follows. Radiofrequency (RF) data was recorded by each element of the passive imaging array and beamformed to the desired location using a delay and sum algorithm. The location used for beamforming was the depth of the HIFU focus from the passive imaging array and the desired azimuthal location. The delay and sum beamforming produced a single beamformed RF line for each location, which was digitized at a sampling rate of 33.3 MHz. The digitized RF line was processed offline, as described below, to obtain a grayscale amplitude at each pixel corresponding to the particular azimuthal and range location.
After digitization, the process was repeated (including data acquisition) for the next azimuthal location until beamformed RF lines for 192 azimuthal locations, spaced by 0.22 mm, were gathered. This data acquisition and beamforming procedure was repeated until sufficient data was recorded to form 9 passive cavitation images. Data acquisition for the 9 frames took approximately 43 ms. Collection of data for 9 passive cavitation images constituted a single acquisition cycle. The time interval between two acquisition cycles was approximately 2.5 to 3.0 s with the bulk of the time required for saving the digitized RF lines. During each HIFU exposure, 12 acquisition cycles were performed. To obtain the reference noise level, a single acquisition cycle was captured before starting the HIFU exposure.
To convert the beamformed RF lines to pixel amplitudes, the beamformed RF lines were windowed in the time domain using a generalized Blackman window and Fourier transformed. The window was defined as:
| (1) |
where α was set to 0.0359, t is time, and T is the duration of the RF data recorded by each element of the imaging array. The window was optimized such that a frequency band centered halfway between neighboring harmonics and ultraharmonics was −85 dB below the peaks at the harmonic and ultraharmonic, assuming no inharmonic signals were present. The data exhibited about 50 dB of dynamic range. Thus the windowing ensured that any signal detected in an inharmonic band was due only to broadband emissions and not spectral leakage from harmonics and ultraharmonics.
The frequency bands used to form images were the fundamental frequency band (a band 330 kHz wide and centered about 1.1 MHz), the harmonic frequency bands (bands 330 kHz wide and centered about the first thirteen multiples of the fundamental), ultraharmonic frequency bands (bands 330 kHz wide and centered about the first thirteen odd multiples of one-half the fundamental frequency), and the inharmonic frequency bands (bands 16.5 kHz wide and centered halfway between the first thirteen harmonics and ultraharmonics). The inharmonic bandwidth was narrower to ensure that it did not contain fundamental, harmonic, or ultraharmonic spectral leakage. The energy in each band was normalized by the bandwidth to obtain a power spectral density. The power spectral density in each band was averaged across the nine frames in each acquisition cycle to form an averaged pixel amplitude. The averaged pixel amplitudes obtained during HIFU insonation were normalized by the averaged pixel amplitudes obtained with no HIFU insonation to compute the signal to noise ratio (SNR) (Mast et al., 2008).
The optical assessment of the lesion could only be performed at one time point (after the HIFU insonation). Therefore for each liver sample, the optical data was a one-dimensional data set. To compare the optical data with the time-varying passive cavitation data, the passive cavitation data were reduced to a single line plot. Each passive cavitation data set consisted of 12 acquisition cycles. The first method to reduce the dimensionality of the passive cavitation data was to sum the passive cavitation image amplitudes from 12 acquisition cycles as shown in equation 2:
| (2) |
Bn(x, ω) is the averaged passive cavitation image pixel amplitude at location x (recalling that all data was beamformed to the depth of the HIFU focus) and frequency ω during HIFU insonation for the nth acquisition cycle. B0(x, ω) is the passive cavitation image pixel amplitude obtained with no HIFU insonation. I(x, ω) is the SNR pixel amplitude at frequency ω and azimuthal location x (Fig. 2A). I(x, ω) was summed over the appropriate frequencies as described above to obtain a line plot of the SNR (Fig. 2B), which could be compared to location of the ablated tissue as determined by the optically scanned data (Fig. 2E).
The second method of forming the SNR line plot was based on the maximum SNR value at each pixel location over the 12 acquisition cycles as shown in equation 3.
| (3) |
where maxn indicates taking the maximum value across the 12 frames.
If a threshold value for the SNR can be used to classify tissue as ablated or normal, then passive cavitation imaging could be used to monitor HIFU thermal ablation therapies. To explore this possibility, the line plot obtained from the optical data was linearly interpolated to match the pixel spacing of the passive cavitation SNR line plot. Receiver operating characteristic (ROC) curves were computed by comparing the optical line plots with the passive cavitation SNR line plots (Figs. 2E and 2F) for all 14 data sets combined and for the data sets grouped by lesion-type (focal, pre-focal, and tadpole). ROC curves were computed for fundamental emissions, harmonic emissions, ultraharmonic emissions, and inharmonic emissions. The area under the ROC curve (AUROC) was computed.
Statistical Analysis
A Welch’s ANOVA test was used to determine whether differences existed between the mean value of the received signal power (Bn(x, ω)) summed over time and space for the different lesion types. The significance level was set to 0.05. A post-hoc Bonferroni correction was applied to subsequent Welch’s t-tests for unequal variance to determine which lesion types had statistically significant differences in the received signal power. The results were also graphically evaluated using box plots of the median received signal power.
A similar set of data analysis was performed to investigate whether the centroid of beamformed received signal was different between the lesion types. The centroid is defined by:
| (4) |
where the data is analyzed for the frequency band of interest, represented by the sum over ω, and a summation over time is represented by the sum over n.
The null hypothesis that the AUROC is less than or equal to 0.5 (indicating the technique did no better than random guessing) was tested according to Hanley and McNeil (1982). To compute the standard error, which was necessary to determine the p-value, the number of independent data points was computed as the number of non-overlapping point spread functions that could be fit within the lateral width of the passive cavitation image. The lateral width of the point spread function was defined as the frequency-dependent −6 dB width (Salgaonkar et al., 2009). The frequency used to compute the lateral point-spread function was 1.1 MHz, 2.2 MHz, 1.65 MHz, and 1.925 MHz for the fundamental, harmonic, ultraharmonic, and inharmonic emissions, respectively. These frequencies correspond to the center frequency of the lowest band used to compute the corresponding passive cavitation image. Selecting the lowest band yielded the largest estimate of the size of the point-spread function and therefore the least number of independent measurements per data set. This approach is a conservative assumption that makes it harder to reject the null hypothesis.
Results
Examples of the three lesion types can be seen in Fig. 3. Lesions are observed as white or light yellow discolorations of the tissue. Three pre-focal lesions, five tadpole lesions, and six focal lesions were observed. Pre-focal lesions and tadpole lesions had larger areas than focal lesions. Several other features were observed in the images. Vessels appeared as holes in the tissue that typically had an off-white colored border (i.e. the vessel wall). Occasionally, only the vessel wall was observed as an irregularly shaped off-white object. Air pockets formed between the tissue and the surface of the optical scanning bed as the tissue thawed. These air pockets had a sharply delineated border. The air pockets were not present in the tissue during ultrasound insonation.
Figure 3.

Representative images of liver samples after HIFU exposure. Thermally ablated lesions are lighter in color with a white or white-yellow appearance as compared to the untreated hepatic tissue. A focal lesion in the post-focal and focal zone is observed in the top image. A tadpole lesion in the focal zone is observed in the middle image. A pre-focal lesion in the pre-focal zone is observed in the bottom image. The −3 dB beam width of the HIFU source (i.e. focal zone) is delineated by thick vertical lines. Examples of vascular tissue and air pockets between the liver sample and scanner are indicated.
Representative beamformed received signals as a function of HIFU range position over time are shown in Fig. 4 for a pre-focal lesion. Fundamental and harmonic emissions were observed for all experiments, though the amplitude and location varied. Ultraharmonic and inharmonic emissions tended to be transiently present or not present at all, especially for focal lesions. In some cases the spatial location of the increased echogenicity in B-mode images after HIFU insonation corresponded with peaks in the passive cavitation images for one or more of the emission types. However this correspondence was not consistent across trials within each lesion type.
Figure 4.

Representative plots of the beamformed receive signals as a function of time and HIFU range location for (A) fundamental, (B) harmonic, (C) ultraharmonic, and (D) inharmonic emissions using a decibel scale. The lesion formed during the trial that produced these emissions was a pre-focal lesion. The color bar extends from the maximum activity to 30 dB below the maximum, except for the inharmonic emissions, where the dynamic range is only 15 dB due to the noise floor.
ROC curve analysis
ROC curves were computed to test the use of passive cavitation images for classifying ablated and normal tissue quantitatively. Assessing all 14 lesions together, the two different methods of processing the beamformed received signal (equations 2 and 3) did not significantly change the shape of the ROC curves or the AUROC. Fundamental and harmonic emissions had the largest AUROCs (0.724 and 0.721, respectively), followed by ultraharmonic emissions (0.633), and inharmonic emissions (0.605). The null hypothesis that the AUROC was not significantly different from 0.5 was rejected for all emission types at a p-value of 0.05 after applying a post-hoc Bonferroni correction.
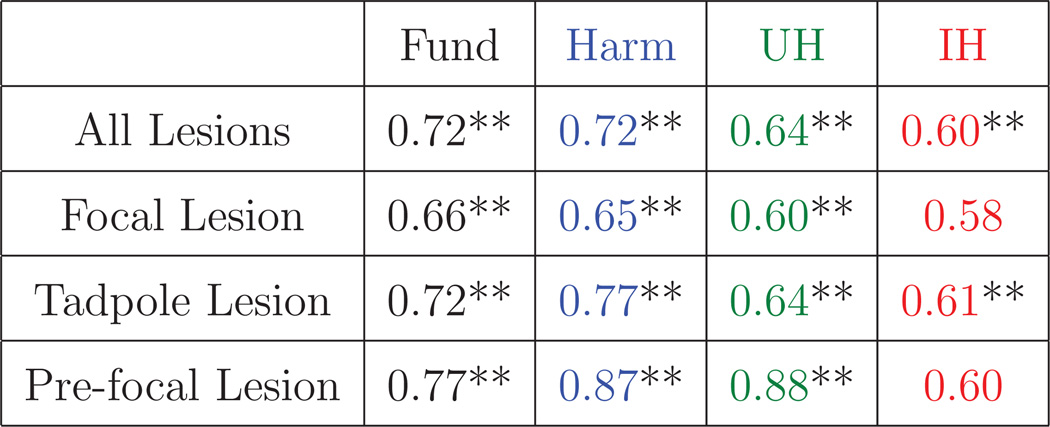
The method of calculation also had a small effect on the ROC shape and AUROC when lesions were grouped as focal, tadpole, or pre-focal for analysis. The coefficient of variation of the AUROC was less than 2.5% for all cases except inharmonic emissions from pre-focal lesions where the coefficient of variation was 11.6%. Therefore all subsequent results of this study are reported using the beamformed received signals summed over time (equation 2). The ROC curves are plotted for each lesion type in Fig. 5 with the corresponding AUROC listed in Table 1. Classification of focal and pre-focal lesions using passive cavitation images formed from inharmonic emissions was not successful (p > 0.05). Classification of lesion formation using passive cavitation images formed from fundamental, harmonic, and ultraharmonic frequency bands were successful (p < 0.05).
Figure 5.

ROC curves for each cavitation emission type grouped by (A) focal lesion, (B) tadpole lesion, and (C) pre-focal lesion, and (D) all lesions. Abbreviations for cavitation type are “Fund” for fundamental emissions, “Harm” for harmonic emissions, “UH” for ultraharmonic emissions, and “IH” for inharmonic emissions.
Table 1.
AUROC for each lesion-type and emission-type.
 |
|---|
The double asterisks indicate a post-hoc Bonferonni corrected p-value less than 0.05. Fund is an abbreviation for fundamental emissions. Harm is an abbreviation for harmonic emissions. UH is an abbreviation for ultraharmonic emissions. IH is an abbreviation for inharmonic emissions. The color-coding matches the color-coding used in Fig. 5.
Discrimination of Lesion Type Using Acoustic Emissions
The results in Fig. 5 and Table 1 demonstrate that the ability to use passive cavitation images to classify where a lesion has formed depends on the type of lesion. Based on the results of the Welch’s ANOVA tests, the null hypothesis that the temporally-summed beamformed received signal (equation 2) had the same mean value for each lesion type was rejected for fundamental and harmonic emissions but not for ultraharmonic and inharmonic emissions. The follow-up Welch’s t-test of both the fundamental and harmonic emissions showed a significant difference between the beamformed received signal power for tadpole and pre-focal lesions only. Box plots (Fig. 6) supported the Welch’s ANOVA tests and Welch’s t-tests, indicating that a difference existed in the median beamformed fundamental emissions for tadpole lesions versus pre-focal lesions but not for ultraharmonic or inharmonic emissions.
Figure 6.

Box plot of the (A) fundamental emissions, (B) harmonic emissions, (C) ultraharmonic emissions, and (D) inharmonic emissions for each lesion type. The red circle indicates the median centroid location of beamformed received signals. The thick blue line extends from the 25th to the 75th quartile. The black dashed whiskers indicate the extrema data (McGill et al., 1978).
Welch’s ANOVA tests on the centroid locations of the beamformed received signals rejected the null hypothesis that the centroid locations were the same across lesion types for fundamental emissions, harmonic emissions, and inharmonic emissions. No significant difference in the centroid location of ultraharmonic emissions was found across lesion types. Follow-up Welch’s t-tests indicated that the difference for each emission type occurred between focal and tadpole lesion types, but not between focal and pre-focal or tadpole and pre-focal. Box plots (Fig. 7) showed a high degree of variance for the location of the centroid of cavitation activity for pre-focal lesions.
Figure 7.

Box plot of the centroid of emissions for each lesion type grouped by emission type (gray boxes). The position is relative to the HIFU focus with negative values distal relative to the HIFU transducer. The −3 dB beam width of the HIFU source (i.e. focal zone) is represented by thick horizontal lines.
Discussion
The quantitative analysis of passive cavitation images and gross tissue histology reported herein demonstrates that passive cavitation imaging can be used to assess where a thermal lesion has formed after HIFU exposure. Although the precise values for the sensitivity and specificity depend on the lesion type and threshold level selected, both the fundamental and harmonic emissions were a significant predictor for all lesion types based on the AUROC. It should be noted that the AUROC represents the probability that the SNR of the passive cavitation image amplitude at a given location is higher at a lesioned location than at a non-lesioned location.
Experimental (Khokhlova et al., 2006) and numerical (Chavrier et al., 2000) studies have indicated that cigar-shaped focal lesions are formed when the number of microbubbles in the HIFU beam is reduced. Focal lesion formation was predicted with the least success based on the AUROC values. Conversely, lesion types associated with cavitation (tadpole and pre-focal) were predicted more successfully, especially using emissions that are associated with cavitation activity (harmonics and ultraharmonics). These results support the original motivation that cavitation-enhanced heating can be monitored with passive cavitation imaging.
The pre-focal lesions, which had the largest AUROC values, may have resulted from a preexisting bubble population. These microbubbles may have increased pre-focal ultrasound energy absorption, while acting as a shield and reducing the production of lesion distal to the pre-focal region. The pre-focal lesions were large and had areas comparable to the tadpole lesions. Given that the harmonic emissions originated in the pre-focal region, the origin of the harmonic emissions was likely to be preexisting bubbles rather than scattering of harmonics produced from nonlinear propagation, which would be most prominent in the focal region. Many studies have reported on the utility of preexisting gas nuclei to accelerate thermal ablation (Kaneko et al., 2005; Chung et al., 2012; Peng et al., 2012). The results of those studies, combined with the results reported herein, that preexisting gas nuclei can be helpful for monitoring thermal ablation, provide additional support for continued investigation into microbubble-enhanced HIFU thermal ablation.
Because thermal lesions may be formed by a combination of direct absorption of transmitted ultrasound energy and heating due to cavitation effects (Curiel et al., 2004), an effective monitoring mechanism needs to track both mechanisms. Direct energy absorption is proportional to increases in the ultrasonic intensity and frequency. Harmonics from nonlinear propagation are predominantly formed at the HIFU focus where the intensity is highest. Furthermore, microbubbles emit harmonics during nonlinear oscillations, which are also associated with heating (Holt and Roy, 2005). Therefore harmonic emissions can be indicators of both mechanisms of heating.
A KZK simulation (data not shown) was performed to estimate the change in the harmonic amplitude peaks with increasing frequency at the focus. This change was compared to the experimentally measured change in harmonic amplitude peaks. It was noted that the magnitude of the change in harmonic amplitude peaks as a function of increasing frequency was smaller for the experimentally measured peaks, implying that both nonlinear propagation and nonlinear scattering from cavitation occurred. Therefore heating likely occurred via both direct absorption of the incident ultrasound and cavitation-based heating. The analysis was performed in a frequency band where the imaging array sensitivity varied by less than 3 dB to ensure that the transducer frequency sensitivity did not affect the analysis. Additionally it should be noted that harmonic emissions have also been associated with vaporous cavitation (i.e. boiling) (Jensen et al., 2012), which is associated with temperatures well above the protein denaturation thermal threshold. Thus harmonic emissions may occur from overtreatment. All of these reasons may explain why passive cavitation images formed from harmonic emissions predicted where a thermal lesion formed with the highest specificity and sensitivity.
Harmonic signals have been used to form images. Because the harmonics are formed near the focus, harmonic imaging tends to contain fewer artifacts (Hedrick and Metzger, 2005). The reduction in artifacts associated with harmonics may be one reason that passive cavitation imaging of harmonic emissions outperformed fundamental emissions. Additional improvements to the image quality may be achieved by modulating the insonation pulse, such as using pulse inversion techniques to help further isolate frequency bands of interest (Song et al., 2013). Aberration correction can also be applied to improve the image quality in tissues with varying speeds of sound (Jones et al., 2013).
Interestingly, inharmonic emissions were the worst predictors of lesion formation in this study. Inharmonic emissions were also the least detected type of emission, both with respect to duration and amplitude. Inertial cavitation, which is associated with inharmonic emissions, has been a focus of other HIFU thermal ablation studies (Arvanitis and McDannold, 2013; Jensen et al., 2013). We posit four reasons why inertial cavitation may not have been as prominently detected and therefore would be less likely to predict lesion formation. First, the insonation pressure may not have been appropriate for inducing sustained inertial cavitation. Arvanitis and McDannold (2013) adjusted the insonation acoustic power until inertial cavitation was detected. In this study the acoustic power was not adjusted to obtain a particular type or duration of cavitation emissions. Second, the inharmonic emissions were at most 15 dB above the noise floor and often not present. By comparison, the ultraharmonic and harmonic emissions were 30 dB or more above the noise floor when they were present. Therefore it is possible that the system lacked the sensitivity to detect some of the inharmonic emissions sufficiently. Third, inertial cavitation activity is known to be transient and susceptible to cavitation nuclei depletion. This may have affected our results in two manners. The 30 s continuous wave insonation used to induce the HIFU thermal lesion had no quiescent period to allow for cavitation nuclei regeneration (Hitchcock et al., 2011; Goertz et al., 2010). Additionally, both Arvanitis and McDannold (2013) and Jensen et al. (2013) used significantly shorter exposures (10 s and 5 s respectively), which could allow the inertial cavitation activity to occur for a larger fraction of the insonation period. Fourth, the data acquisition periods may not have been appropriate for detecting transient inertial cavitation. During a single acquisition cycle, data was recorded for approximately 43 ms, with the remaining 2500 to 3000 ms of the acquisition cycle corresponding to data transferring and processing. Therefore, the probability of capturing transient inertial cavitation activity during the exposure was low. Coupled with the low fraction of time spent on data recording, the acquisition was asynchronous with the initiation of HIFU exposure, which may have resulted in any initial burst of cavitation activity from preexisting microbubbles to be missed. The limitations of this system in recording inharmonic emissions may have not only decreased the AUROC value associated with inharmonic emissions, but it may have also increased the AUROC values for other emission types. This artificial increase could have occurred if non-inharmonic emissions originated from the same location as the inharmonic emissions and the bubble activity associated with inharmonic emissions caused lesion formation. Under these conditions, the ROC analysis could falsely attribute the lesion formation to non-inharmonic emissions. A modified setup designed to induce and record inharmonic emissions may improve the ability of passive cavitation imaging to monitor lesion formation accurately.
Table 1 indicates that if the lesion type can be determined, a more accurate assessment of lesion formation can be performed. Differentiating the lesion type during a single trial (as would be necessary for providing guidance during a treatment) requires identifying a metric that produces a unique value for each lesion type. Two simple methods were investigated to determine if they could be used to differentiate lesion types. Neither the total amount of beamformed received signal nor the centroid of the beamformed received signal could simultaneously categorize all three lesion types, though statistically significant differences were observed for some pairs. A post-hoc power analysis (Eng, 2003) was performed to determine the number of lesions required in order to differentiate each lesion type using either the location of the centroid of the emissions or the cumulative energy of the emissions. It was found that at a minimum 12 lesions were required. Therefore these simple metrics are not appropriate for determining the lesion type within a single ultrasound insonation. More sophisticated metrics may be suitable for differentiating lesion types.
However, categorizing the data by lesion type may be suboptimal. Lesions are classified based on their geometry after the HIFU insonation is complete. Ideally, passive cavitation imaging would be used as part of a feedback system to monitor lesion formation during HIFU insonation. Assessment of this ability requires a gold-standard method of directly determining lesion formation in real-time, which was not possible in this study. A similar study using translucent phantoms (Takegami et al., 2004; Lafon et al., 2005; Choi et al., 2013) or real-time MR monitoring would enable such an investigation.
This study extends the work by Jensen et al. (2012). Their approach placed the imaging array in a cutout of HIFU transducer along the axis of HIFU propagation. This alignment protocol is suitable for clinical application, but limited the spatial resolution to a 10 mm × 10 mm window centered about the HIFU focus. Our results are able to provide finer spatial resolution due to the orthogonal alignment of the passive imaging array and the HIFU transducer. It should be noted when comparing our results to those of Jensen et al. (2012), they observed evidence of boiling which would have scattered harmonics formed from nonlinear propagation. As described above, at least a portion of the harmonics recorded in our experiments were from cavitating microbubbles. The presence of harmonics due to scattering from large boiling bubbles would likely increase the sensitivity and specificity due to the use of a threshold value in an ROC analysis.
Ultimately, passive cavitation imaging will likely need to be combined with other techniques to provide increased accuracy in assessment of lesion formation. Arvanitis and McDannold (2013) developed a dual-mode system that monitored cavitation through passive cavitation imaging and temperature via magnetic resonance thermometry. They reported that the location of heating and inertial cavitation activity were in agreement on average. Jensen et al. (2013) predicted temperature elevation and lesion formation using passive cavitation imaging as input data for a numerical model. The model accounted for heat deposition from both direct absorption of the incident nonlinear ultrasound and cavitation. Inclusion of the heating from cavitation played an important role in predicting the asymmetries of the lesions that were observed. The methodologies from Arvanitis and McDannold (2013) and Jensen et al. (2013) are examples of how passive cavitation imaging can be used in conjunction with other techniques to predict HIFU lesion formation. Many other ultrasound imaging modalities have the potential to be used with passive cavitation imaging for monitoring lesion formation, speed-of-sound imaging, echo decorrelation imaging or elastography (Righetti et al., 1999; Anand and Kaczkowski, 2008; Liu and Ebbini, 2010; Choi et al., 2011; Bing et al., 2011; Subramanian et al 2014).
Study Limitations
Passive cavitation imaging does not directly monitor thermal changes and thus may not be expected to predict lesion formation accurately due to thermal diffusion (Sheu et al., 2011). The 30 s exposure times used in our methods may have been long enough for thermal diffusion to cause some growth of the lesion size. This effect would likely lower the specificity of the passive cavitation images.
Variability in the type of lesions produced was observed despite using the same ultrasound insonation parameters for all samples. Although this variation was useful in the analysis, uncontrolled variables were revealed. These uncontrolled variables may include variations in tissue structure, variations in tissue composition due to degradation over the 4 h post mortem period, preexisting gas nuclei, and variations in tissue temperature just prior to insonation. Variations in tissue structure and composition are likely to be uncontrolled variables encountered during clinical application of HIFU thermal ablation. Therefore the variations encountered in this study may have serendipitously provided data that is useful when considering translation to clinical application.
The experimental setup also limited the analysis. The available equipment resulted in an acquisition cycle duration of approximately 2.5 s to 3 s and only 1% to 2% of that time corresponding to receiving data. Thus transient emissions may not have been recorded. Improved temporal resolution may result in increased AUROC values. Additionally, the Iris system acquired each scan line in the passive cavitation image in sequence, rather than beamforming all of the scan lines in a given frame from the same data set (e.g. our methods were analogous to multiple ray line transmit B-mode imaging as opposed to plane wave B-mode imaging (Sandrin et al., 1999)). Therefore within a single passive cavitation image frame, the emissions may have changed. A qualitative review of the data revealed a relatively smooth transition in signal amplitude across azimuthal locations, indicating that sequential scan line acquisition had limited impact. Finally, it should be noted that the broadband imaging array had a center frequency of 7.5 MHz. The frequency sensitivity of the array would have reduced the measured emissions at the fundamental. This relative lack of sensitivity at the fundamental is advantageous in that the analogue to digital conversion could span a dynamic range more sensitive to the lower amplitude harmonic, ultraharmonic, and inharmonic emissions. However, temporal duration of the recorded signals was not designed to optimize recording inharmonic emissions. The bandwidth available to record inharmonic emissions was only 5% of the bandwidth available to record harmonic and ultraharmonic emissions. Inharmonic emissions, when detected, were often only 10 dB above the noise level. Furthermore the broadband array was insensitive to very low frequency emissions that have been associated with boiling or hot vapor events (Mast et al., 2008).
Conclusions
Passive cavitation imaging was implemented during HIFU ablation of ex vivo bovine liver. Centroid and ROC curve analyses were used to test the correspondence between acoustic emission signals and thermal lesion formation. Classification of lesion formation based on harmonic emissions was the most successful. The results support continued investigation of passive cavitation imaging as a technique for monitoring HIFU thermal ablation treatments using binary classifiers to distinguish between coagulated and nominally untreated tissue.
Acknowledgements
Research reported in this publication was supported in part by the National Institute of Biomedical Imaging and Bioengineering of the National Institutes of Health (NIH) under award number R21EB008483, the National Heart, Lung, and Blood Institute of the NIH under award numbers R01HL059586, R01HL074002 and F32HL104916, and the National Cancer Institute of the NIH under award number R01CA158439.
References
- Alwan A. Global status report on noncommunicable diseases 2010. World Health Organization. 2011 [Google Scholar]
- Anand A, Kaczkowski PJ. Noninvasive measurement of local thermal diffusivity using backscattered ultrasound and focused ultrasound heating. Ultrasound in medicine & biology. 2008;34:1449–1464. doi: 10.1016/j.ultrasmedbio.2008.02.004. [DOI] [PMC free article] [PubMed] [Google Scholar]
- Arvanitis CD, McDannold N. Integrated ultrasound and magnetic resonance imaging for simultaneous temperature and cavitation monitoring during focused ultrasound therapies. Medical Physics. 2013;40:112901. doi: 10.1118/1.4823793. [DOI] [PMC free article] [PubMed] [Google Scholar]
- Aubry JF, Pauly K, Moonen C, ter Haar G, Ries M, Salomir R, Sokka S, Sekins K, Shapira Y, Ye F, Huff-Simonin H, Eames M, Hananel A, Kassell N, Napoli A, Hwang J, Wu F, Zhang L, Melzer A, Kim Ys, Gedroyc W. The road to clinical use of high-intensity focused ultrasound for liver cancer: technical and clinical consensus. Journal of Therapeutic Ultrasound. 2013;1:13. doi: 10.1186/2050-5736-1-13. [DOI] [PMC free article] [PubMed] [Google Scholar]
- Bing KF, Rouze NC, Palmeri ML, Rotemberg VM, Nightingale KR. Combined ultrasonic thermal ablation with interleaved ARFI image monitoring using a single diagnostic curvilinear array: a feasibility study. Ultrasonic Imaging. 2011;33:217–232. doi: 10.1177/016173461103300402. [DOI] [PMC free article] [PubMed] [Google Scholar]
- Chapman A, ter Haar GR. Thermal ablation of uterine fibroids using MR-guided focused ultrasound - a truly non-invasive treatment modality. European Radiology. 2007;17:2505–2511. doi: 10.1007/s00330-007-0644-8. [DOI] [PubMed] [Google Scholar]
- Chavrier F, Chapelon JY, Gelet A, Cathignol D. Modeling of high-intensity focused ultrasound-induced lesions in the presence of cavitation bubbles. The Journal of the Acoustical Society of America. 2000;108:432–440. doi: 10.1121/1.429476. [DOI] [PubMed] [Google Scholar]
- Chen D, McGough RJ. A 2D fast near-field method for calculating near-field pressures generated by apodized rectangular pistons. The Journal of the Acoustical Society of America. 2008;124:1526–1537. doi: 10.1121/1.2950081. [DOI] [PMC free article] [PubMed] [Google Scholar]
- Choi MJ, Guntur SR, Lee JM, Paeng DG, Lee KIL, Coleman A. Changes in ultrasonic properties of liver tissue in vitro during heating-cooling cycle concomitant with thermal coagulation. Ultrasound in medicine & biology. 2011;37:2000–2012. doi: 10.1016/j.ultrasmedbio.2011.06.015. [DOI] [PubMed] [Google Scholar]
- Choi MJ, Guntur SR, Lee K, Paeng DG. A tissue mimicking polyacrylamide hydrogel phantom for visualizing thermal lesions generated by high intensity focused ultrasound. Ultrasound in medicine & biology. 2013;39:439–448. doi: 10.1016/j.ultrasmedbio.2012.10.002. [DOI] [PubMed] [Google Scholar]
- Chung DJ, Cho SH, Lee JM, Hahn ST. Effect of microbubble contrast agent during high intensity focused ultrasound ablation on rabbit liver in vivo. European Journal of Radiology. 2012;81:e519–e523. doi: 10.1016/j.ejrad.2011.06.002. [DOI] [PubMed] [Google Scholar]
- Coussios CC, Farny CH, ter Haar GR, Roy RA. Role of acoustic cavitation in the delivery and monitoring of cancer treatment by high-intensity focused ultrasound (HIFU) International Journal of Hyperthermia. 2007;23:105–120. doi: 10.1080/02656730701194131. [DOI] [PubMed] [Google Scholar]
- Curiel L, Chavrier F, Gignoux B, Pichardo S, Chesnais S, Chapelon JY. Experimental evaluation of lesion prediction modelling in the presence of cavitation bubbles: intended for high-intensity focused ultrasound prostate treatment. Medical & Biological Engineering & Computing. 2004;42:44–54. doi: 10.1007/BF02351010. [DOI] [PubMed] [Google Scholar]
- Elias WJ, Huss D, Voss T, Loomba J, Khaled M, Zadicario E, Frysinger RC, Sperling SA, Wylie S, Monteith SJ, Druzgal J, Shah BB, Harrison M, Wintermark M. A pilot study of focused ultrasound thalamotomy for essential tremor. New England Journal of Medicine. 2013;369:640–648. doi: 10.1056/NEJMoa1300962. [DOI] [PubMed] [Google Scholar]
- Eng J. Sample Size Estimation: How Many Individuals Should Be Studied? Radiology. 2003;227:309–313. doi: 10.1148/radiol.2272012051. [DOI] [PubMed] [Google Scholar]
- Farny CH, Holt RG, Roy RA. Temporal and Spatial Detection of HIFU-Induced Inertial and Hot-Vapor Cavitation with a Diagnostic Ultrasound System. Ultrasound in medicine & biology. 2009;35:603–615. doi: 10.1016/j.ultrasmedbio.2008.09.025. [DOI] [PubMed] [Google Scholar]
- Goertz DE, Wright C, Hynynen K. Contrast agent kinetics in the rabbit brain during exposure to therapeutic ultrasound. Ultrasound in medicine & biology. 2010;36:916–924. doi: 10.1016/j.ultrasmedbio.2010.03.005. [DOI] [PMC free article] [PubMed] [Google Scholar]
- Gyöngy M, Arora M, Nobel JA, Coussios CC. Use of Passive Arrays for Characterization and Mapping of Cavitation Activity during HIFU Exposure. IEEE Ultrasonics Symposium. 2008:871–874. [Google Scholar]
- Gyöngy M, Coussios CC. Passive Spatial Mapping of Inertial Cavitation During HIFU Exposure. IEEE Transactions on Biomedical Engineering. 2010;57:48–56. doi: 10.1109/TBME.2009.2026907. [DOI] [PubMed] [Google Scholar]
- Hanley JA, McNeil BJ. The meaning and use of the area under a receiver operating characteristic (ROC) curve. Diagnostic Radiology. 1982;143:29–36. doi: 10.1148/radiology.143.1.7063747. [DOI] [PubMed] [Google Scholar]
- Haworth KJ, Mast TD, Radhakrishnan K, Burgess MT, Kopechek JA, Huang SL, McPherson DD, Holland CK. Passive imaging with pulsed ultrasound insonations. The Journal of the Acoustical Society of America. 2012;132:544–553. doi: 10.1121/1.4728230. [DOI] [PMC free article] [PubMed] [Google Scholar]
- Hedrick WR, Metzger L. Tissue Harmonic Imaging A Review. Journal of Diagnostic Medical Sonography. 2005;21:183–189. [Google Scholar]
- Hitchcock KE, Ivancevich NM, Haworth KJ, Caudell Stamper DN, Vela DC, Sutton JT, Pyne-Geithman GJ, Holland CK. Ultrasound-Enhanced rt-PA Thrombolysis in an ex vivo Porcine Carotid Artery Model. Ultrasound in medicine & biology. 2011;37:1240–1251. doi: 10.1016/j.ultrasmedbio.2011.05.011. [DOI] [PMC free article] [PubMed] [Google Scholar]
- Holt RG, Roy RA. Bubble dynamics in therapeutic ultrasound. In: Doinikov AA, editor. Bubble and particle dynamics in acoustic fields modern trends and applications. Kerala, India: Research Signpost; 2005. pp. 183–230. [Google Scholar]
- Jeanmonod D, Werner B, Morel A, Michels L, Zadicario E, Schiff G, Martin E. Transcranial magnetic resonance imaging-guided focused ultrasound: noninvasive central lateral thalamotomy for chronic neuropathic pain. Neurosurgical focus. 2012;32:E1. doi: 10.3171/2011.10.FOCUS11248. [DOI] [PubMed] [Google Scholar]
- Jensen CR, Cleveland RO, Coussios CC. Real-time temperature estimation and monitoring of hifu ablation through a combined modeling and passive acoustic mapping approach. Physics in Medicine and Biology. 2013;58:5833. doi: 10.1088/0031-9155/58/17/5833. [DOI] [PubMed] [Google Scholar]
- Jensen CR, Ritchie RW, Gyöngy M, Collin JRT, Leslie T, Coussios CC. Spatiotemporal Monitoring of High-Intensity Focused Ultrasound Therapy with Passive Acoustic Mapping. Radiology. 2012;262:252–261. doi: 10.1148/radiol.11110670. [DOI] [PubMed] [Google Scholar]
- Jones RM, O’Reilly MA, Hynynen K. Transcranial passive acoustic mapping with hemispherical sparse arrays using CT-based skull-specific aberration corrections: a simulation study. Physics in Medicine and Biology. 2013;58:4981–5005. doi: 10.1088/0031-9155/58/14/4981. [DOI] [PMC free article] [PubMed] [Google Scholar]
- Kaneko Y, Maruyama T, Takegami K, Watanabe T, Mitsui H, Hanajiri K, Nagawa H, Matsumoto Y. Use of a microbubble agent to increase the effects of high intensity focused ultrasound on liver tissue. European radiology. 2005;15:1415–1420. doi: 10.1007/s00330-005-2663-7. [DOI] [PubMed] [Google Scholar]
- Kelly JF, McGough RJ. A time-space decomposition method for calculating the nearfield pressure generated by a pulsed circular piston. Ultrasonics, Ferroelectrics and Frequency Control, IEEE Transactions on. 2006;53:1150–1159. doi: 10.1109/tuffc.2006.1642513. [DOI] [PMC free article] [PubMed] [Google Scholar]
- Kelly JF, McGough RJ. Transient Fields Generated by Spherical Shells in Viscous Media. 8th International symposium on therapeutic ultrasound. 2009;1113:210–214. [Google Scholar]
- Khokhlova VA, Bailey MR, Reed JA, Cunitz BW, Kaczkowski PJ, Crum LA. Effects of nonlinear propagation, cavitation, and boiling in lesion formation by high intensity focused ultrasound in a gel phantom. The Journal of the Acoustical Society of America. 2006;119:1834–1848. doi: 10.1121/1.2161440. [DOI] [PubMed] [Google Scholar]
- Kim YS, Kim JH, Rhim H, Lim HK, Keserci B, Bae DS, Kim BG, Lee JW, Kim TJ, Choi CH. Volumetric MR-guided high-intensity focused ultrasound ablation with a one-layer strategy to treat large uterine fibroids: initial clinical outcomes. Radiology. 2012;263:600–609. doi: 10.1148/radiol.12111707. [DOI] [PubMed] [Google Scholar]
- Köhler MO, Mougenot C, Quesson B, Enholm J, Le Bail B, Laurent C, Moonen CTW, Ehnholm GJ. Volumetric HIFU ablation under 3D guidance of rapid MRI thermometry. Medical Physics. 2009;36:3521–3535. doi: 10.1118/1.3152112. [DOI] [PubMed] [Google Scholar]
- Lafon C, Zderic V, Noble ML, Yuen JC. Gel phantom for use in high-intensity focused ultrasound dosimetry. Ultrasound in medicine & biology. 2005;31:1383–1389. doi: 10.1016/j.ultrasmedbio.2005.06.004. [DOI] [PubMed] [Google Scholar]
- Liberman B, Gianfelice D, Inbar Y, Beck A, Rabin T, Shabshin N, Chander G, Hengst S, Pfeffer R, Chechick A, Hanannel A, Dogadkin O, Catane R. Pain palliation in patients with bone metastases using MR-guided focused ultrasound surgery: a multicenter study. Annals of surgical oncology. 2009;16:140–146. doi: 10.1245/s10434-008-0011-2. [DOI] [PubMed] [Google Scholar]
- Liu D, Ebbini ES. Real-time 2-D temperature imaging using ultrasound. IEEE Transactions on Biomedical Engineering. 2010;57:12–16. doi: 10.1109/TBME.2009.2035103. [DOI] [PMC free article] [PubMed] [Google Scholar]
- Mast TD, Salgaonkar VA, Karunakaran C, Besse JA, Datta S, Holland CK. Acoustic emissions during 3.1 MHz ultrasound bulk ablation in vitro. Ultrasound in medicine & biology. 2008;34:1434–1448. doi: 10.1016/j.ultrasmedbio.2008.02.007. [DOI] [PMC free article] [PubMed] [Google Scholar]
- McGill R, Tukey JW, Larsen WA. Variations of Box Plots. The American Statistician. 1978;32:12–16. [Google Scholar]
- McGough RJ. Rapid calculations of time-harmonic nearfield pressures produced by rectangular pistons. The Journal of the Acoustical Society of America. 2004;115:1934–1941. doi: 10.1121/1.1694991. [DOI] [PMC free article] [PubMed] [Google Scholar]
- McLaughlan J, Rivens I, Leighton T, ter Haar G. A Study of Bubble Activity Generated in Ex Vivo Tissue by High Intensity Focused Ultrasound. Ultrasound in Medicine & Biology. 2010;36:1327–1344. doi: 10.1016/j.ultrasmedbio.2010.05.011. [DOI] [PubMed] [Google Scholar]
- Merckel LG, Bartels LW, Köhler MO, van den Bongard HJGD, Deckers R, Mali WPTM, Binkert CA, Moonen CT, Gilhuijs KGA, van den Bosch MAAJ. MR-guided high-intensity focused ultrasound ablation of breast cancer with a dedicated breast platform. Cardiovascular and interventional radiology. 2013;36:292–301. doi: 10.1007/s00270-012-0526-6. [DOI] [PubMed] [Google Scholar]
- Ng KKC, Poon RTP, Chan C, Chok KSH, Cheung TT, Tung H, Chu F, Tso WK, Yu WC, Lo CM, Fan ST. High-intensity focused ultrasound for hepatocellular carcinoma. Annals of Surgery. 2011;253:981–987. doi: 10.1097/SLA.0b013e3182128a8b. [DOI] [PubMed] [Google Scholar]
- Peng S, Xiong Y, Li K, He M, Deng Y, Chen L, Zou M, Chen W, Wang Z, He J, Zhang L. Clinical utility of a microbubble-enhancing contrast (“SonoVue”) in treatment of uterine fibroids with high intensity focused ultrasound: a retrospective study. European Journal of Radiology. 2012;81:3832–3838. doi: 10.1016/j.ejrad.2012.04.030. [DOI] [PubMed] [Google Scholar]
- Rieke V, Butts Pauly K. MR thermometry. Journal of magnetic resonance imaging : JMRI. 2008;27:376–390. doi: 10.1002/jmri.21265. [DOI] [PMC free article] [PubMed] [Google Scholar]
- Righetti R, Kallel F, Stafford RJ, Price RE, Krouskop TA, Hazle JD, Ophir J. Elastographic characterization of HIFU-induced lesions in canine livers. Ultrasound in medicine & biology. 1999;25:1099–1113. doi: 10.1016/s0301-5629(99)00044-7. [DOI] [PubMed] [Google Scholar]
- Salgaonkar VA. Ph.D. thesis. University of Cincinnati; 2009. Passive imaging & measurements of acoustic cavitation during ultrasound ablation. [Google Scholar]
- Salgaonkar VA, Datta S, Holland CK, Mast TD. Passive cavitation imaging with ultrasound arrays. Journal of the Acoustical Society of America. 2009;126:3071–3083. doi: 10.1121/1.3238260. [DOI] [PMC free article] [PubMed] [Google Scholar]
- Sandrin L, Catheline S, Tanter M, Hennequin X, Fink M. Time-resolved pulsed elastography with ultrafast ultrasonic imaging. Ultrasonic Imaging. 1999;21:259–272. doi: 10.1177/016173469902100402. [DOI] [PubMed] [Google Scholar]
- Sheu TWH, Solovchuk MA, Chen AWJ, Thiriet M. On an acoustics-thermalfluid coupling model for the prediction of temperature elevation in liver tumor. International Journal of Heat and Mass Transfer. 2011;54:4117–4126. [Google Scholar]
- Soneson JE. High intensity focused ultrasound simulator. MATLAB File Exchange. 2011 [Google Scholar]
- Song JH, Yoo Y, Song TK, Chang JH. Real-time monitoring of HIFU treatment using pulse inversion. Physics in Medicine and Biology. 2013;58:5333–5350. doi: 10.1088/0031-9155/58/15/5333. [DOI] [PubMed] [Google Scholar]
- Subramanian S, Rudich SM, Alqadah A, Karunakaran CP, Rao MB, Mast TD. In Vivo Thermal Ablation Monitoring Using Ultrasound Echo Decorrelation Imaging. Ultrasound in Medicine and Biology. 2014;40:102–114. doi: 10.1016/j.ultrasmedbio.2013.09.007. http://doi.org/10.1016/j.ultrasmedbio.2013.09.007. [DOI] [PMC free article] [PubMed] [Google Scholar]
- Takegami K, Kaneko Y, Watanabe T. Polyacrylamide gel containing egg white as new model for irradiation experiments using focused ultrasound. Ultrasound in Medicine & Biology. 2004;30:1419–1422. doi: 10.1016/j.ultrasmedbio.2004.07.016. [DOI] [PubMed] [Google Scholar]
- Tempany CMC, Stewart EA, McDannold N, Quade BJ, Jolesz FA, Hynynen K. MR Imaging–guided Focused Ultrasound Surgery of Uterine Leiomyomas: A Feasibility Study. Radiology. 2003;226:897–905. doi: 10.1148/radiol.2271020395. [DOI] [PubMed] [Google Scholar]
- Voogt MJ, Trillaud H, Kim YS, Mali WPTM, Barkhausen J, Bartels LW, Deckers R, Frulio N, Rhim H, Lim HK, Eckey T, Nieminen HJ, Mougenot C, Keserci B, Soini J, Vaara T, Köhler MO, Sokka S, van den Bosch MAAJ. Volumetric feedback ablation of uterine fibroids using magnetic resonance-guided high intensity focused ultrasound therapy. European radiology. 2012;22:411–417. doi: 10.1007/s00330-011-2262-8. [DOI] [PMC free article] [PubMed] [Google Scholar]
- Watkin NA, ter Haar GR, Rivens I. The intensity dependence of the site of maximal energy deposition in focused ultrasound surgery. Ultrasound in Medicine and Biology. 1996;22:483–491. doi: 10.1016/0301-5629(95)02062-4. [DOI] [PubMed] [Google Scholar]
- White DR, Duck FA, Fairhead AC, Rothenberg LN, Shaw A, Zagzebski JA, Zankl M. Tech. Rep. 61. Bethesda, Maryland: International Commission on Radiation Units and Measurements; 1998. Tissue Substitutes, Phantoms and Computational Modelling in Medical Ultrasound. [Google Scholar]
- Wu F, Wang ZB, Chen WZ, Zhu H, Bai J, Zou JZ, Li KQ, Jin CB, Xie FL, Su HB. Extracorporeal High Intensity Focused Ultrasound Ablation in the Treatment of Patients with Large Hepatocellular Carcinoma. Annals of Surgical Oncology. 2004;11:1061–1069. doi: 10.1245/ASO.2004.02.026. [DOI] [PubMed] [Google Scholar]
- Xu G, Luo G, He L, Li J, Shan H, Zhang R, Li Y, Gao X, Lin S, Wang G. Follow-Up of High-Intensity Focused Ultrasound Treatment for Patients with Hepatocellular Carcinoma. Ultrasound in Medicine & Biology. 2011;37:1993–1999. doi: 10.1016/j.ultrasmedbio.2011.08.011. [DOI] [PubMed] [Google Scholar]
- Yu T, Xu C. Hyperecho as the Indicator of Tissue Necrosis During Microbubble-Assisted High Intensity Focused Ultrasound: Sensitivity, Specificity and Predictive Value. Ultrasound in medicine & biology. 2008;34:1343–1347. doi: 10.1016/j.ultrasmedbio.2008.01.012. [DOI] [PubMed] [Google Scholar]
- Zhou YF. High intensity focused ultrasound in clinical tumour ablation. World journal of clinical oncology. 2011;2:8–27. doi: 10.5306/wjco.v2.i1.8. [DOI] [PMC free article] [PubMed] [Google Scholar]