Abstract
The majority of reports in which microvascular network properties are quantified rely on manual measurements, which are time consuming to collect and somewhat subjective. Despite some progress in creating automated image analysis techniques, the parameters measured by these methods are limited. For example, no automated system has yet been able to measure support cell recruitment, which is an important indicator of microvascular maturity. Microvessel alignment is another parameter that existing programs have not measured, despite a strong dependence of performance on alignment in some tissues. Here we present two image analysis programs, a semi-automated program that analyzes cross sections of microvascular networks and a fully automated program that analyzes images of whole mount preparations. Both programs quantify standard characteristics as well as support cell recruitment and microvascular network alignment, and were highly accurate in comparison to manual measurements for engineered tissues containing self-assembled microvessels.
Introduction
The quantification of microvascular network characteristics is of interest to a wide variety of researchers. Changes in the microvasculature have been implicated in a variety of disease processes, from neurological disorders to cancer.[1], [2] In addition, the development of microvascular networks in vitro has been pursued by many for either tissue engineering purposes or as a model for the study of endothelial cell (EC) biology. In all of these areas the quantification of microvessel characteristics is of critical importance in order to statistically differentiate between different treatments or experimental conditions.
A commonly used metric is capillary density, which actually comprises several different metrics. One is quantified from tissue cross sections and reported as capillaries/mm2.[3]–[5] A second, also reported as capillaries/mm2, is quantified via nailfold capillaroscopy, in which a finger is viewed under light microscopy and the skin capillaries counted.[6], [7] Although these quantification methods are reported with the same units, they are quite different and should not be compared directly. Both methods typically rely on manual counting, which is tedious and can introduce bias.
Another parameter commonly quantified is the network length per image area.[8], [9] This parameter is typically used when the entire microvascular network can be viewed, for example in a whole mount tissue preparation or a dorsal window chamber. However, this method also relies on manual measurement of the lengths of the capillaries, which is time consuming. A high degree of subjectivity is also introduced, as the image often contains capillaries that are varying distances from the focal plane, and the observer must decide which capillaries should be included in the measurement.
The introduction of subjectivity into measurements is extremely problematic in the analysis of engineered microvascular networks, as the observer must first define what qualifies as a capillary. In cross section, not all EC structures contain lumens, and some structures contain multiple lumens either because it was sectioned near a bifurcation point or because the several small lumens have not yet matured into a single lumen. In whole mount preparations, microvessels often have abnormal morphology that must be measured accurately or endothelial cell debris that must be eliminated from measurements. These conditions increase the variability in both inter- and intra-observer measurements.
Some work has been done to automate the detection and counting of capillaries. Both Ranefall et al. and Kim et al. reported methods for automated capillary counting in immunostained sections imaged under light microscopy.[10], [11] Although these methods were shown to be relatively accurate, they counted capillaries by counting positive EC staining rather than the lumens themselves. This poses a problem for use with engineered microvessels, in which a positively stained object may correspond to zero or several lumens. Additionally, characteristics such as lumen size or shape, which are also of importance in microvascular networks both in vitro and in vivo, were not quantified. The alignment of capillaries was also not quantified, which would be present in longitudinal sections of anisotropic native or engineered tissues such as muscle. Finally, the use of immunohistochemistry rather than immunofluorescence limits the possibility of identifying additional cell types, such as support cells, in the same section, because it would be difficult to distinguish the different cell types in the light microscopy image. Without identifying both cell types in the same section, it would be impossible to accurately quantify parameters such as the recruitment level of the support cells, which is an important indicator of microvessel maturity.
Much more work has examined automated methods for quantifying microvessel length. Methods have been developed for analyzing both brightfield and fluorescent images, both in vitro and in vivo networks, and both single images and z-stacks for 3D reconstruction.[12]–[19] Each method has its advantages and disadvantages; some require the input of a binary image, which is at times non-trivial to obtain,[17] some require perfusion of the network for imaging,[13], [16] which cannot always be done for engineered microvessels, and some require extensive serial sections to create a 3D image of the network.[14] None of these methods, however, address the quantification of mural cell recruitment or network anisotropy, which are important parameters to assess both in vitro and in vivo, as they provide information about the maturity and alignment of the network, respectively.
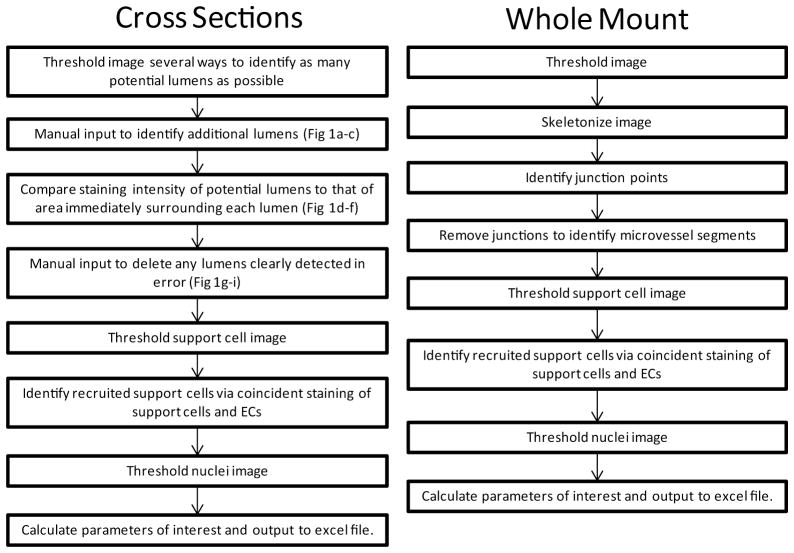
The methods outlined here for analysis of cross sections and whole mount preparations of engineered microvessels (Figure 1) address the limitations noted above. The cross section algorithm detected lumens within fluorescent images based on dark areas surrounded by EC staining which, once identified, can be counted and measured as desired. The whole mount program quantifies microvessel length as well as bifurcation points. Both programs also share two major improvements over others: the inclusion of methods to measure support cell recruitment to the network and network anisotropy. These inclusions provide additional quantitative information regarding microvascular maturity and alignment, which are useful in many types of microvascular studies. The particular images used here to demonstrate the programs are of engineered microvessels made from human blood outgrowth endothelial cells and GFP-expressing human brain pericytes,[20] but apply to any source of ECs and support cells.
Figure 1.
Flow chart of processing steps for the cross-section (A) and whole mount (B) algorithms.
Methods
Cross Section Algorithm Description
An image analysis program for use with cross sections of engineered tissues containing microvascular networks was developed in Matlab v. 2012b (The Mathworks) using the Image Analysis Toolbox. The images used for this analysis were obtained from 10 μm cryo sections of engineered microvessels formed as previously described.[20] The sections were immunostained using an antibody against human CD31 (Dako) and imaged using a scanning laser confocal microscope. The support cells were GFP-labeled, and DAPI was used as a nuclear stain. The images were 512×512, with each pixel representing 0.877 μm. The algorithm first thresholded the CD31+ image using several threshold values, which were automatically generated using the graythresh function. The resulting binary images were then dilated and eroded (using disks of size 1 and 2 pixels) to improve connectivity of CD31+ regions. Holes in the image smaller than 20 pixels in area were filled in using imfill and bwareaopen, effectively setting the lower limit on the size of lumens to 20 pixels. Several threshold values and several dilations/erosions were used to capture the most possible lumens, as each of the binary images generated were assessed for lumens later in the algorithm. It was important to identify as many lumens as possible to reduce the manual portion of the algorithm.
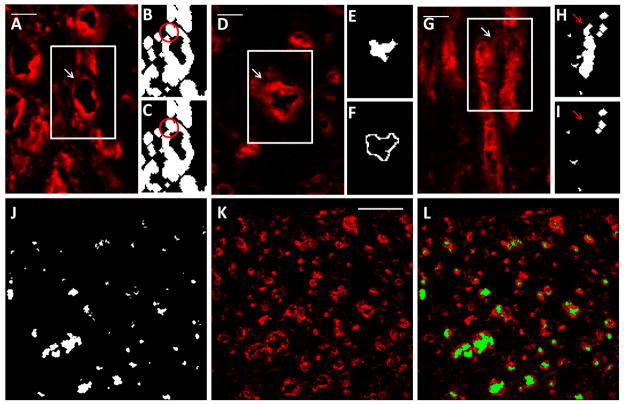
The most dilated image was then presented to the user for input. A custom function was developed that enabled the user to click two points on the image, after which the values of the pixels in a straight line between the points were changed to 1. The user was able to connect CD31+ regions using this function and thereby enclose lumens that would have otherwise gone undetected (Figure 2a–c). This method of user input maximized accuracy in lumen detection while minimizing the user impact on the size and shape of the detected lumens. A while loop enabled the user to make as many edits to the thresholded image as necessary. The user’s judgment was used to determine which CD31+ regions to connect.
Figure 2.
Semi-automated lumen detection in cross sections. (A–C) User input was required in this program for accuracy due to occasional areas of dim CD31 staining. The region outlined in white in (A) is enlarged in (B) and (C). Although the lumen indicated by the arrow is obvious to the eye based on CD31 staining (red; A), the program did not initially recognize the lumen due to a small area of dim staining, which left a gap in the binary image (B; circled). The program enabled the user to correct this error by connecting the ring of CD31 staining with a 1 pixel wide line (C; circled). Scalebar = 20 μm. (D–F) To eliminate some non-lumens that would have otherwise been detected as lumens, the program compared intensity levels (obtained from the original image; D) between the lumen region (E) and the region immediately surrounding the lumen (F). The region outlined in white in (D) is enlarged in (E) and (F). Lumen regions that had similar intensity values to their surrounding regions were determined to be non-lumens and eliminated. This lumen had high intensity values in the surrounding region compared to the lumen region, so the lumen was retained. Scalebar = 20 μm. (G–I) User input was again required after lumens were detected to remove any non-lumens. The region outlined in white in (G) is enlarged in (H) and (I). The area between lumens in the original image (G; arrow) was detected by the program as a lumen (H; arrow) due to the close proximity of the surrounding CD31+ structures. The user was able to delete this non-lumen prior to quantification (I; arrow), improving program accuracy. Scalebar = 20 μm. (J–L) The lumen image (J) resulting from these manipulations corresponded well to the original image (K). The lumen image are overlayed the original image for clarity (L). Scalebar = 100 μm.
After the user input was complete, all of the binary images generated thus far (including images that were dilated, not dilated and incorporating user input) were assessed for lumens, which were defined as a region of zeros completely surrounded by ones. To be clear, this meant that the same field was assessed for lumens using multiple binary representations. The imfill function was used to fill in such regions, and subtracting the original binary image resulted in a lumen image, one of which was created for each binary image. The union of all of the lumen images was taken as the first lumen image. Due to the thresholding and dilation, the first lumen image contained artifacts, creating the need for further processing to remove non-lumens.
The hallmark of a lumen is a bright ring of CD31+ staining surrounding a dark region. Therefore, the ratio of staining intensity between each region in the first lumen image and its immediate surroundings was used to detect true lumens. Individually, each potential lumen was dilated by two pixels, and the lumen was subtracted to yield a ring of pixels just outside the lumen, where CD31 staining would typically be present (“the adjacent region;” Figure 2d–f). The average pixel intensity of the adjacent region in the original image was then compared to the intensity of the lumen in the original image, and the ratio of the two values was defined as the intensity ratio. Lumens with intensity ratios below a given threshold were deleted from the lumen image, forming the second lumen image. The threshold value can be modified for each image set to minimize user input, although the variation in optimal thresholds is small in general. This step is the most computationally expensive, but is critical to minimize user input.
Once the second lumen image was finalized, it was presented to the user for input. A custom function enabled the user to draw a polygon and delete all lumens within that polygon. Non-lumens present in the second lumen image often result from CD31+ structures located near each other; these regions may become completely surrounded by CD31+ staining when the binary image is dilated (Figure 2g–i). A while loop enabled the user to remove as many lumens as necessary; after this step was complete, the lumen image was final (Figure 2j–kl). The lumen density was expressed as the number of lumens per area.
At this point the function regionprops was used to calculated properties of the lumens such as their size (area) and length (major axis length). The original thresholded image (using the automatically generated threshold level from the graythresh function) was also used to calculate the total level of CD31 staining. Additional processing using the imfill function filled in the original binary images to produce information about the number of endothelial structures present in the image. This filled image was also used to calculate an anisotropy index for the image, which describes the alignment of the structures. The length of each structure was divided into components parallel and perpendicular to the alignment direction, which was defined as the average angle of all structures. The anisotropy index was then defined as the ratio of the sum of structure lengths in the direction parallel to alignment to the sum of structure lengths in the direction perpendicular to alignment. The length and angle of each structure was calculated using regionprops (major axis length and orientation).
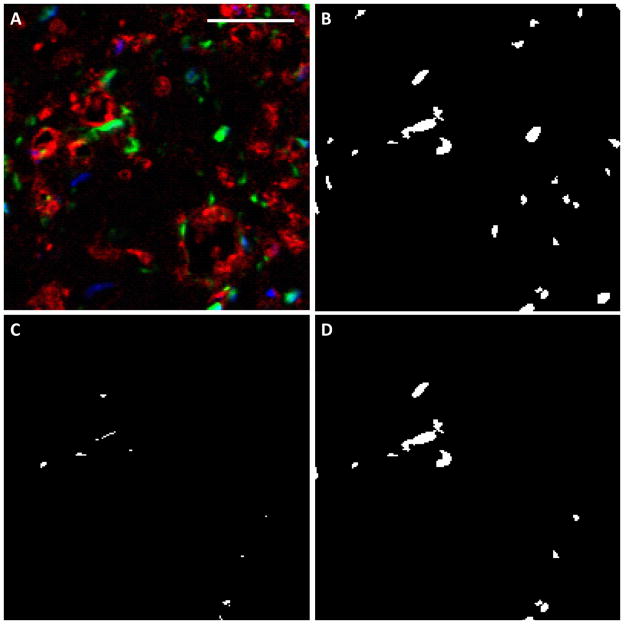
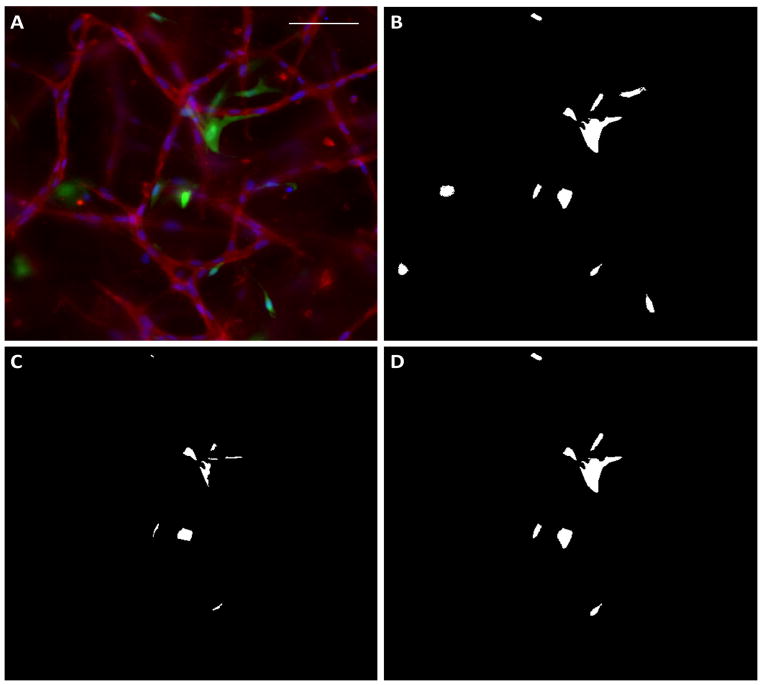
The program was also able to detect the recruitment of support cells (labeled with a different fluorophore) to CD31-positive structures. The support cell image was thresholded and objects 10 pixels in area or smaller (noise) removed using bwareaopen. The intersection of the support cell image and the CD31 image was taken, and support cells that contained an area of overlap (of any size) with the CD31 image were considered recruited (Figure 3). The support cell recruitment level was expressed as the fraction of total support cells that were recruited. The total number of support cells per area was also recorded.
Figure 3.
Evaluation of support cell recruitment in cross sections. (A) The original image, in which CD31 staining is red, support cells are green and nuclei are blue. Scalebar = 50 μm. (B) The support cell image (green) was thresholded and noise removed. (C) The intersection between the support cell image and the CD31 image, which defined recruitment. (D) Those support cells that coincided with ECs were considered recruited.
Finally, the total cell number per area was also recorded from nuclear staining. The image was thresholded and noise removed as above, and the total number of nuclei was counted.
Whole Mount Algorithm Description
A second program was developed in Matlab to analyze images of whole mount CD31-stained engineered microvessels. Although lumens are difficult to detect in whole mount staining, other important network characteristics such as total vessel length and interconnectivity are much more easily evaluated from these images than images of cross sections. Engineered microvessels within fibrin gel were formed in the wells of 96 well plates as previously described.[21] After culture, the gels were removed from the plate and stained whole using an antibody against human CD31 (Dako). The support cells expressed GFP, and nuclei were stained with DAPI. Images were collected using an epi-fluorescence microscope at 692×520, with each pixel representing 1.02 μm.
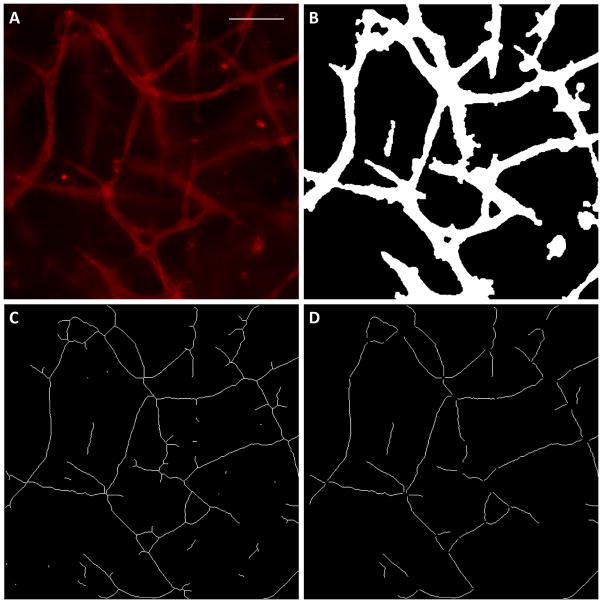
Prior to thresholding the CD31 image, the grayscale image was dilated (using a disk of size 5 pixels) and eroded (using a disk of size 2 pixels). This manipulation had the effect of “blurring” the staining within the EC structures but maintained a relatively strong difference between the structures and the background. The blurring made the level of staining within the structure more even, enabling easier identification via thresholding. The function graythresh was used to automatically detect a threshold level. A binary image was created using a threshold level obtained by multiplying the output of graythresh by 0.9. Using a threshold level slightly lower than that determined by graythresh produced a binary image in which the identified endothelial structures had a similar interconnectivity to the original image (Figure 4a–b). Any rounded cells were removed using bwareaopen, which removed objects smaller than 500 pixels in area. The total number of objects (structures) was then counted.
Figure 4.
Quantification of network morphology in whole mount images. (A) The original CD31 image. Scalebar = 100 μm. (B) The binary image produced by thresholding and removal of rounded cells. (C) The binary image after skeletonization. Many small segments are present as artifacts of the skeletonization process. (D) The binary image after bifurcation points and the small artifacts were removed. These segments correspond well to the original image.
Next the function bwmorph (“thin, Inf” command) was used to skeletonize the image (Figure 4c). Although quite accurate, the skeletonization process created small segments that were not part of the original EC geometry, often due to variations in microvessel diameter. To obtain accurate information about the network characteristics, it was necessary to remove these artifacts. This was done with the following process. A custom function was used to find network bifurcation points using a look up table (LUT), which specified that a pixel was a bifurcation point if 3 or more of the 8 pixels immediately surrounding it also had a value of 1. These bifurcation points were then removed from the skeletonized image, and bwareaopen was used to delete small segments (20 pixels or less), which were typically artifacts of the skeletonization process. The remaining segments were considered true segments of the EC network, and their properties were quantified (Figure 4d). The number of segments was counted, and their areas (equaling their lengths; from regionprops) were both averaged and summed to obtain the average segment length and the total vessel length, respectively. All of these parameters were normalized to the area of the image. The orientation of each segment was also quantified using regionprops and used in conjunction with each segment’s length to calculate an anisotropy index, indicating the strength of alignment of the segments. Each segment length was divided into components parallel and perpendicular to the direction of alignment (determined to be the average angle of all segments). The anisotropy index was then defined as the ratio of the sum of segment lengths in the direction parallel to alignment to the sum of segment lengths in the direction perpendicular to alignment.
The bifurcation points were then added back into the skeletonized image creating the final skeletonized image. The number of bifurcation points was then quantified (using the custom LUT function described above) and normalized to the image area. Additional parameters of interest were then calculated including the average length per continuous structure (defined as total length/number of structures), the average length per segment (defined as total length/number of segments) and the average diameter (defined as total structure area/total length).
Finally the number of total cells, the number of support cells, and the level of support cell recruitment were quantified using the same algorithm as described above for the cross section program (Figure 5).
Figure 5.
Support cell recruitment quantification in whole mount images. (A) The original image, in which the red indicates CD31 staining, the green indicates support cells, and the blue indicates nuclei. (B) The binary image of support cells. (C) The intersection of the red and green staining, which indicates regions of adjacent ECs and support cells. (D) Those support cells identified in the intersection image were considered recruited.
Program Validation
Both of the programs were validated via comparison to manual measurements. For the cross section program, lumens were manually counted using ImageJ in 6 cross sections of engineered microvessels and compared to the lumen counts subsequently generated by the program. For the whole mount program, the total microvessel length, network anisotropy index, and support cell recruitment were measured for 9 images in ImageJ and compared to values subsequently generated by the program. Support cell recruitment and anisotropy index were not quantified for the cross section program because the analysis methods were very similar. Paired t-tests were used to examine differences between manual and automatic counts; p values less than 0.05 were considered significant.
Results
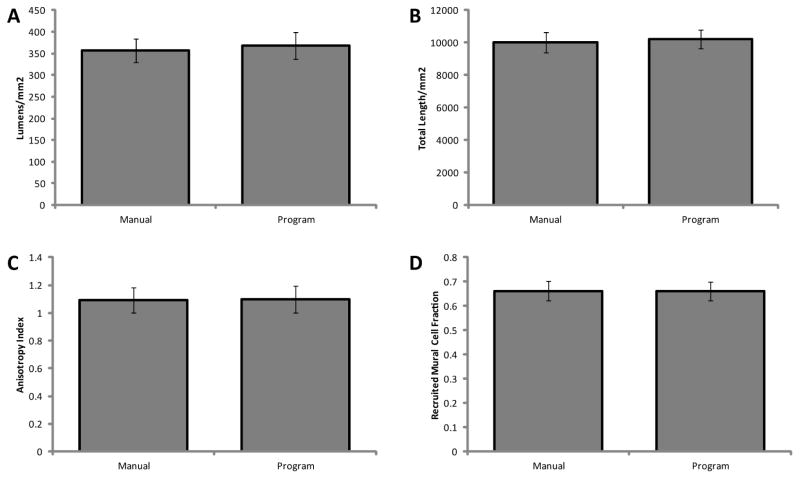
For the cross section program, no difference was observed between manual and semiautomated lumen density measurements (Figure 6a). The percent errors between the counts for individual images were at or under 10%, and the variability in lumen counts appeared to be similar between manual and automated measurements.
Figure 6.
Comparison of manual and automated quantitation methods. Lumen density was measured to evaluate the cross section program (A), and total vessel length was measured to evaluate the whole mount program (B). Network anisotropy (C) and support cell recruitment (D) were quantified from the whole mount program as an indication of the accuracy of both programs, as the algorithm is very similar between the two programs. All automated measurements demonstrated good agreement (p < 0.05) with their respective manual measurements, both measurements being made on the same 6 images.
For the whole mount program, there were no differences in the measured total network length, support cell recruitment fraction, and network anisotropy index between manual measurement and automated quantification (Figure 6b–d). The relative percent errors (based on the means) between measurements of individual images were slightly larger that of the cross section comparison, but still relatively small. All errors were under 25%, and most were under 10%. The variability was similar across both quantification methods for all measurements.
Discussion
Despite the previous development of automated image analysis programs for both cross section and whole mount preparations, the majority of recent publications quantifying microvascular networks relied upon manual measurements.[3]–[9], [22]–[24] This may be due to the complex nature of image processing algorithms, although some have created graphical user interfaces that obviate the need for understanding the algorithms. Another reason may be that existing programs may not be robust enough to quantify another user’s images or a parameter of interest to a particular user may not be quantified by the existing program. The Image Processing Toolbox of Matlab, used to create the programs described here, provides a balance in terms of complexity: the built-in functions reduce the level of knowledge of image processing techniques required to use the programs, yet enables users to modify the programs to fit their needs. Once the program was optimized for a user’s images and quantification needs (by setting the Matlab function parameters), the time required to analyze images would be reduced dramatically, and the objectivity of the analysis would improve dramatically. The algorithm provided here for cross sections still includes a manual component, which is suboptiomal, but it was not possible to identify lumens completely and accurately without a manual component. Future work is needed to refine algorithms in order to minimize the manual component further or eliminate it entirely.
Both programs developed here were designed to measure multiple microvascular network characteristics. Previous automated image analysis programs have measured some of these characteristics, but two are completely novel. The first is the measurement of the level of support cell recruitment. Higher levels of recruitment are indicative of microvascular maturity,[25] and the measured value from engineered microvascular networks could be compared to native levels of recruitment in the tissue of interest. The second is the measurement of microvascular anisotropy. Native capillaries of cardiac and skeletal muscle are highly aligned with the muscle fibers, and the degree of alignment of the engineered microvessels could be compared to that of native muscle capillaries. Additionally, alignment of engineered microvascular networks may be necessary to facilitate perfusion in vitro.[20]
A high level of agreement was observed between manual and automated measurements of lumen density (cross section program) and total vessel length, support cell recruitment and network anisotropy (whole mount program). These data suggest that the programs produce highly accurate results. Some subjectivity is introduced into the cross section program via user input; however, this input is minimized in terms of both impact on the resulting measurements and the time required for input. For example, in the first user input step, the user connects areas of positive CD31 staining by clicking on the two endpoints of a line between the two areas to be connected. This not only creates a more accurate shape of the lumen as compared to tracing the entire lumen manually, but also drastically reduces the time required to define the lumen. Future work should certainly attempt to fully automate the cross section program to remove all observer subjectivity and further reduce the time of analysis.
These programs were optimized for use with engineered microvascular networks, and no modifications were necessary to use the programs to analyze different image sets. However, it is unclear how many adjustments would be required to use the programs to quantify images of other engineered microvascular networks (e.g. those formed from a different cell type or within a different scaffold) or native networks. Modification of these algorithms might be necessary to adapt these programs to accurately measure the characteristics of all engineered or native capillary networks.
Highlights.
Semi-automated image processing tools developed for quantification of engineered microvascular.
Techniques presented to quantify microvessel alignment and support cell recruitment to microvessels.
Quantification of data from cross sections and whole mount preparations included.
Acknowledgments
The authors thank Pat Schaeffer for histological assistance. This work was supported by NIH R01 HL108670 (to RTT), AHA predoctoral fellowship 11PRE7610056 (to KTM) and a grant from the Undergraduate Research Opportunities Program at UMN (to PDC).
Footnotes
Notes
The Matlab scripts described herein will be made available upon request.
Publisher's Disclaimer: This is a PDF file of an unedited manuscript that has been accepted for publication. As a service to our customers we are providing this early version of the manuscript. The manuscript will undergo copyediting, typesetting, and review of the resulting proof before it is published in its final citable form. Please note that during the production process errors may be discovered which could affect the content, and all legal disclaimers that apply to the journal pertain.
References
- 1.Brown WR, Thore CR. Review: cerebral microvascular pathology in ageing and neurodegeneration. Neuropathol Appl Neurobiol. 2011 Feb;37(1):56–74. doi: 10.1111/j.1365-2990.2010.01139.x. [DOI] [PMC free article] [PubMed] [Google Scholar]
- 2.Bostwick DG, Iczkowski KA. Microvessel density in prostate cancer: prognostic and therapeutic utility. Semin Urol Oncol. 1998 Aug;16(3):118–123. [PubMed] [Google Scholar]
- 3.Gealekman O, Guseva N, Gurav K, Gusev A, Hartigan C, Thompson M, Malkani S, Corvera S. Effect of rosiglitazone on capillary density and angiogenesis in adipose tissue of normoglycaemic humans in a randomised controlled trial. Diabetologia. 2012 Oct;55(10):2794–2799. doi: 10.1007/s00125-012-2658-2. [DOI] [PMC free article] [PubMed] [Google Scholar]
- 4.Green HJ, Burnett M, Kollias H, Ouyang J, Smith I, Tupling S. Association of peak aerobic power with capillary density but not oxidative potential in human vastus lateralis muscle. Can J Physiol Pharmacol. 2011 Nov;89(11):819–827. doi: 10.1139/y11-079. [DOI] [PubMed] [Google Scholar]
- 5.Rufaihah AJ, Huang NF, Jamé S, Lee JC, Nguyen HN, Byers B, De A, Okogbaa J, Rollins M, Reijo-Pera R, Gambhir SS, Cooke JP. Endothelial cells derived from human iPSCS increase capillary density and improve perfusion in a mouse model of peripheral arterial disease. Arterioscler Thromb Vasc Biol. 2011 Nov;31(11):e72–79. doi: 10.1161/ATVBAHA.111.230938. [DOI] [PMC free article] [PubMed] [Google Scholar]
- 6.Gonçalves MC, Bezerra FF, de EC, Eleutherio A, Bouskela E, Koury J. Organic grape juice intake improves functional capillary density and postocclusive reactive hyperemia in triathletes. Clinics (Sao Paulo) 2011;66(9):1537–1541. doi: 10.1590/S1807-59322011000900005. [DOI] [PMC free article] [PubMed] [Google Scholar]
- 7.Schmeling H, Stephens S, Goia C, Manlhiot C, Schneider R, Luthra S, Stringer E, Feldman BM. Nailfold capillary density is importantly associated over time with muscle and skin disease activity in juvenile dermatomyositis. Rheumatology (Oxford) 2011 May;50(5):885–893. doi: 10.1093/rheumatology/keq407. [DOI] [PubMed] [Google Scholar]
- 8.Rao RR, Peterson AW, Ceccarelli J, Putnam AJ, Stegemann JP. Matrix composition regulates three-dimensional network formation by endothelial cells and mesenchymal stem cells in collagen/fibrin materials. Angiogenesis. 2012 Jun;15(2):253–264. doi: 10.1007/s10456-012-9257-1. [DOI] [PMC free article] [PubMed] [Google Scholar]
- 9.Chen X, Aledia AS, Ghajar CM, Griffith CK, Putnam AJ, Hughes CC, George SC. Prevascularization of a fibrin-based tissue construct accelerates the formation of functional anastomosis with host vasculature. Tissue EngPart A. 2009 Jun;15(6):1363–1371. doi: 10.1089/ten.tea.2008.0314. [DOI] [PMC free article] [PubMed] [Google Scholar]
- 10.Ranefall P, Wester K, Busch C, Malmström PU, Bengtsson E. Automatic quantification of microvessels using unsupervised image analysis. Anal Cell Pathol. 1998;17(2):83–92. doi: 10.1155/1998/490585. [DOI] [PMC free article] [PubMed] [Google Scholar]
- 11.Kim NT, Elie N, Plancoulaine B, Herlin P, Coster M. An original approach for quantification of blood vessels on the whole tumour section. Anal Cell Pathol. 2003;25(2):63–75. doi: 10.1155/2003/473902. [DOI] [PMC free article] [PubMed] [Google Scholar]
- 12.Krishnan L, Underwood CJ, Maas S, Ellis BJ, Kode TC, Hoying JB, Weiss JA. Effect of mechanical boundary conditions on orientation of angiogenic microvessels. Cardiovasc Res. 2008 May;78(2):324–332. doi: 10.1093/cvr/cvn055. [DOI] [PMC free article] [PubMed] [Google Scholar]
- 13.Cassot F, Lauwers F, Fouard C, Prohaska S, Lauwers-Cances V. A novel three-dimensional computer-assisted method for a quantitative study of microvascular networks of the human cerebral cortex. Microcirculation. 2006 Jan;13(1):1–18. doi: 10.1080/10739680500383407. [DOI] [PubMed] [Google Scholar]
- 14.Brey EM, King TW, Johnston C, McIntire LV, Reece GP, Patrick CW., Jr A technique for quantitative three-dimensional analysis of microvascular structure. Microvasc Res. 2002 May;63(3):279–294. doi: 10.1006/mvre.2002.2395. [DOI] [PubMed] [Google Scholar]
- 15.Doukas CN, Maglogiannis I, Chatziioannou AA. Computer-supported angiogenesis quantification using image analysis and statistical averaging. IEEE Trans Inf Technol Biomed. 2008 Sep;12(5):650–657. doi: 10.1109/TITB.2008.926463. [DOI] [PubMed] [Google Scholar]
- 16.Nowak-Sliwinska P, Ballini J-P, Wagnières G, van den Bergh H. Processing of fluorescence angiograms for the quantification of vascular effects induced by anti-angiogenic agents in the CAM model. Microvasc Res. 2010 Jan;79(1):21–28. doi: 10.1016/j.mvr.2009.10.004. [DOI] [PubMed] [Google Scholar]
- 17.Vickerman MB, Keith PA, McKay TL, Gedeon DJ, Watanabe M, Montano M, Karunamuni G, Kaiser PK, Sears JE, Ebrahem Q, Ribita D, Hylton AG, Parsons-Wingerter P. VESGEN 2D: automated, user-interactive software for quantification and mapping of angiogenic and lymphangiogenic trees and networks. Anat Rec (Hoboken) 2009 Mar;292(3):320–332. doi: 10.1002/ar.20862. [DOI] [PMC free article] [PubMed] [Google Scholar]
- 18.Niemistö A, Dunmire V, Yli-Harja O, Zhang W, Shmulevich I. Robust quantification of in vitro angiogenesis through image analysis. IEEE Trans Med Imaging. 2005 Apr;24(4):549–553. doi: 10.1109/tmi.2004.837339. [DOI] [PubMed] [Google Scholar]
- 19.Angulo J, Matou S. Application of mathematical morphology to the quantification of in vitro endothelial cell organization into tubular-like structures. Cell Mol Biol (Noisy-le-grand) 2007;53(2):22–35. [PubMed] [Google Scholar]
- 20.Morin KT, Dries-Devlin JL, Tranquillo RT. Engineered microvessels with strong alignment and high lumen density via cell-induced fibrin gel compaction and interstitial flow. Tissue Eng Part A. 2014 Feb;20(3–4):553–565. doi: 10.1089/ten.tea.2013.0262. [DOI] [PMC free article] [PubMed] [Google Scholar]
- 21.Morin KT, Smith AO, Davis GE, Tranquillo RT. Aligned human microvessels formed in 3D fibrin gel by constraint of gel contraction. Microvasc Res. 2013 Nov;90:12–22. doi: 10.1016/j.mvr.2013.07.010. [DOI] [PMC free article] [PubMed] [Google Scholar]
- 22.Saik JE, Gould DJ, Watkins EM, Dickinson ME, West JL. Covalently immobilized platelet-derived growth factor-BB promotes angiogenesis in biomimetic poly(ethylene glycol) hydrogels. Acta Biomater. 2011 Jan;7(1):133–143. doi: 10.1016/j.actbio.2010.08.018. [DOI] [PMC free article] [PubMed] [Google Scholar]
- 23.Stratman AN, Davis MJ, Davis GE. VEGF and FGF prime vascular tube morphogenesis and sprouting directed by hematopoietic stem cell cytokines. Blood. 2011 Apr;117(14):3709–3719. doi: 10.1182/blood-2010-11-316752. [DOI] [PMC free article] [PubMed] [Google Scholar]
- 24.Ghajar CM, Chen X, Harris JW, Suresh V, Hughes CC, Jeon NL, Putnam AJ, George SC. The effect of matrix density on the regulation of 3-D capillary morphogenesis. BiophysJ. 2008 Mar;94(5):1930–1941. doi: 10.1529/biophysj.107.120774. [DOI] [PMC free article] [PubMed] [Google Scholar]
- 25.Bergers G, Song S. The role of pericytes in blood-vessel formation and maintenance. Neuro Oncol. 2005 Oct;7(4):452–464. doi: 10.1215/S1152851705000232. [DOI] [PMC free article] [PubMed] [Google Scholar]


