Figure 3.
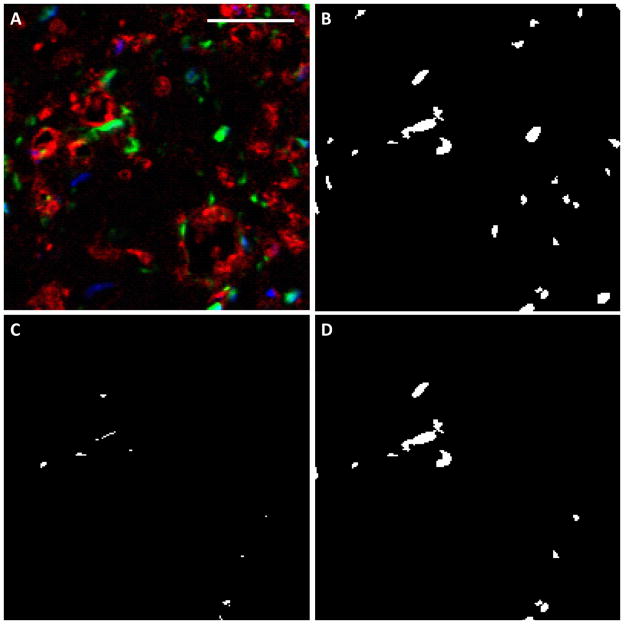
Evaluation of support cell recruitment in cross sections. (A) The original image, in which CD31 staining is red, support cells are green and nuclei are blue. Scalebar = 50 μm. (B) The support cell image (green) was thresholded and noise removed. (C) The intersection between the support cell image and the CD31 image, which defined recruitment. (D) Those support cells that coincided with ECs were considered recruited.

