

Abstract
Purpose
Thyroid transcription factor-1 (TTF1) immunohistochemistry (IHC) is used clinically to differentiate primary lung adenocarcinomas (LUAD) from squamous lung cancers and metastatic adenocarcinomas from other primary sites. However, a subset of LUAD (15-20%) does not express TTF1 and TTF1-negative patients have worse clinical outcomes. As there are no established targeted agents with activity in TTF1-negative LUAD, we performed an integrated molecular analysis to identify potential therapeutic targets.
Experimental Design
Using two clinical LUAD cohorts (274 tumors), one from our institution (PROSPECT) and the TCGA, we interrogated proteomic profiles (by reverse-phase protein array (RPPA)), gene expression, and mutational data. Drug response data from 74 cell lines were used to validate potential therapeutic agents.
Results
Strong correlations were observed between TTF1 IHC and TTF1 measurements by RPPA (Rho=0.57, p<0.001) and gene expression (NKX2-1, Rho=0.61, p<0.001). Established driver mutations (e.g. BRAF and EGFR) were associated with high TTF1 expression. In contrast, TTF1-negative LUAD had a higher frequency of inactivating KEAP1 mutations (p=0.001). Proteomic profiling identified increased expression of DNA repair proteins (e.g., Chk1 and the DNA repair score) and suppressed PI3K/MAPK signaling among TTF1-negative tumors, with differences in total proteins confirmed at the mRNA level. Cell line analysis showed drugs targeting DNA repair to be more active in TTF1-low cell lines.
Conclusions
Combined genomic and proteomic analyses demonstrated infrequent alteration of validated lung cancer targets (including the absence of BRAF mutations in TTF1-negative LUAD), but identified novel potential targets for TTF1-negative LUAD includingKEAP1/Nrf2 and DNA repair pathways.
Keywords: TTF1, lung adenocarcinoma, molecular profiling, non-small cell lung cancer, DNA repair
Introduction
Thyroid transcription factor 1 (TTF1, gene name NKX2-1) is a home domain-containing transcription factor expressed in the thyroid, lungs, and diencephalon during embryogenesis. In normal development, TTF1 is essential for lung morphogenesis and differentiation (1), but the function of TTF1 in cancer biology is complicated with implications for both oncogenic and tumor suppressive signaling (reviewed (2)).
Clinically, TTF1 is used as an immunohistochemical marker for the differential diagnosis of lung adenocarcinoma (LUAD) and thyroid cancer. TTF1plays an important role in: 1) distinguishing primary LUADs from metastatic adenocarcinomas originating from other sites (e.g., breast or colon cancer) and 2) distinguishing LUAD from squamous lung cancer. Nevertheless, a subset of LUAD (∼15-20%) does not express TTF1 (3, 4), and these TTF1-negative LUADs are associated with worse clinical outcomes (4).
Over the past ten years, major advances have been made in the treatment of LUAD, including the identification of druggable driver mutations and fusions in subsets of patients (∼15-20%) that respond to specific targeted therapies (e.g., EGFR mutations and ALK, RET, and ROS fusions). However, the most common of these—EGFR mutations and ALK fusions – occur rarely in TTF1-negative tumors (5-7). In fact, due to the low incidence of established driver genes in TTF1-negative tumors, TTF1 status is used in some parts of the world to determine whether a patient is likely to benefit from EGFR mutation testing(8, 9). Given the low rates of established targetable alterations in TTF1-negative LUAD, chemotherapy remains the current standard of care for the vast majority of these patients.
We have previously shown the potential for proteomic profiling to identify novel therapeutic targets and predictive markers for lung cancer (10, 11). Proteomic profiling is complimentary to other molecular profiling approaches (e.g. DNA sequencing) since it can identify highly expressed protein targets or pathway activation independent of a mutation or gene amplification. Moreover, protein profiling, which includes analysis of post-translational modifications, directly measures the targets of small molecule inhibitors or other targeted therapies providing a read-out of pathway activation, which cannot be ascertained by nucleic acid sequencing. Consequently, proteomic profiling has the potential to identify therapeutic vulnerabilities in otherwise “oncogene-negative” cancers.
Given the poor prognosis of patients with TTF1-negative LUAD and the absence of a validated targeted therapy for this population, there is a critical need to better understand the pathophysiology of TTF1-negative LUADs with the goal of identifying more active treatments for this subset of lung cancers. Despite its negative prognostic associations, the routine use of TTF1 IHC in the diagnosis of LUAD provides a key opportunity to leverage TTF1 as a predictive biomarker to guide treatment selection of drugs that work preferentially in this population. Towards this goal, we performed an integrated molecular and drug analysis to identify pathways or targets enriched in TTF1-negative LUAD.
In this study, we investigated the unique clinical, genomic, and proteomic profiles of TTF1-negative tumors in two large, independent LUAD cohorts (274 tumors total). Using reverse phase protein array profiling (RPPA), >127 total and/or phosphorylated proteins representing key oncogenic pathways were quantified in each tumor to identify potential therapeutic targets over expressed in TTF1-negative tumors. We then identified drugs with preferential in vitro activity in TTF1-negative cell lines using a large panel of targeted drugs and chemotherapies, including drugs inhibiting candidate targets identified by RPPA profiling.
Materials and Methods
PROSPECT and TCGA Cohorts
The MD Anderson cohort was obtained from the Profiling of Resistance patterns and Oncogenic Signaling Pathways in Evaluation of Cancers of the Thorax (PROSPECT) study, developed in 2006 to investigate novel molecular mechanisms of therapeutic resistance and generate rational therapeutic strategies for overcoming resistance. Surgically resected tumors, collected between 2006-2010, from 189 patients were included in PROSPECT, and of these, 152 were LUADs. RPPA profiling was performed on 93 of these samples. Clinical characteristics of these 93 patients are presented in Table 1.
Table 1. Lung adenocarcinoma clinical cohort characteristics.
| Characteristic | N (%) | |
|---|---|---|
|
| ||
| PROSPECT (N=93) | TCGA (N=181) | |
|
| ||
| Female | 38 (41) | 105 (58) |
| Male | 55 (59) | 76 (42) |
| Stage I | 48 (52) | 95 (52) |
| Stage II | 26 (28) | 39 (22) |
| Stage III | 19 (20) | 40 (22) |
| Stage IV | 7 (4) | |
| Adjuvant Chemotherapy | 40 (43) | |
| No Adjuvant Chemotherapy | 53 (57) | |
| Smoking | ||
| Never | 8 (9) | 27 (15) |
| Former | 49 (52) | 111 (62) |
| Current | 36 (39) | 35 (19) |
| Unknown | 8(4) | |
| K-Ras | ||
| Mutant | 26 (28) | 47 (26) |
| Non-mutant | 64 (69) | 134 (74) |
| Unknown | 3 (3) | |
| EGFR | ||
| Mutant | 5 (5) | 27 (15) |
| Non-mutant | 50 (54) | 154 (85) |
| Unknown | 38 (41) | |
| BRAF | ||
| Mutant | 0 (0) | 13 (7) |
| Non-mutant | 77 (82) | 168 (93) |
| Unknown | 9 (10) | |
| PIK3CA | ||
| Mutant | 7 (8) | 13 (7) |
| Non-Mutant | 77 (82) | 168 (93) |
| Unknown | 9 (10) | |
The Cancer Genome Atlas (TCGA) LUAD cohort (12) included material from 279 previously untreated LUAD patients. This analysis utilizes the molecular profile of a 181 patient subset for which RPPA was performed. Clinical characteristics of these samples are described in Table 1.
RPPA, gene expression and sequence analysis
Prospect
RPPA analysis of PROSPECT samples was conducted at MDACC as previously reported (10). Briefly, the slide images were quantified using MicroVigene 4.0 (VigeneTech, Carlisle, MA, USA). The spot level raw data were processed using the R package Super Curve (13, 14), which returns the estimated protein concentrations (raw concentration) and a QC score for each slide. Only slides with QC scores >0.8 were used for downstream analysis. Raw concentration data were normalized by median-centering each sample across all the proteins to correct loading bias. Gene expression analysis and sequencing of select genes were conducted as reported elsewhere (15-18).
TCGA
Protein expression (RPPA) was measured at MDACC as previously described (12); gene expression and whole exome sequencing data generated as described elsewhere (12) were downloaded from the TCGA website (19).
Cell lines
Cell lines were established by J.D. Minna and A. Gazdar at the National Cancer Institute and the University of Texas Southwestern Medical Center (Dallas, TX) or obtained from the ATCC, cells were grown in RPMI-1640 medium supplemented with 10% FBS unless specified by the ATCC. RPPA and gene expression analysis of LUAD cell lines and cell line authentication (by DNA fingerprinting via short tandem repeats at the time of mRNA and total protein lysate preparation using the PowerPlex 1.2 kit (Promega)) was performed as reported previously (11). Fingerprinting results were compared with reference fingerprints maintained by the primary source of the cell line. NKX2-1 gene expression was used as a surrogate for TTF1 expression as TTF1 RPPA data was available only for a subset of cell lines.
DNA repair score
The DNA repair score is a proteomic signature measuring the degree of expression of DNA repair proteins (20) derived by taking the sum expression levels of 17 DNA repair proteins that are coordinately expressed in lung cancer as measured by RPPA. Proteins in the DNA repair score are: pChk1, FANCD2, MRE11, pChk2, Chk2, ATRIP, pATM, XRCC1, 53BP1, DNA.PKcs, ATM, RAD50, NBS1, MSH2, PARP1, RAD51, and BRCA1.
Immunohistochemical analysis
TTF1 immunohistochemical analysis was performed as published previously (3, 4). Briefly, 5μM FFPE sections were rehydrated, antigen retrieval was performed using a steamer (pH=9), intrinsic peroxidase activity was quenched with 3% hydrogen peroxide and 5% goat serum solution was used to block non-specific binding before incubating with a primary antibody against TTF1 (dilution 1:100, clone 8G7G3/1, Cell Marque). After three washes, slides were incubated with Dako Envisual + Dual Link. After three additional washes, slides were incubated with Dako chromagen substrate and counterstained with hematoxylin. Sections were scored by a thoracic pathologist by multiplying intensity (0-3+) and extent (0-100%) of staining by light microscopy (range 0-300) (3).
Drug sensitivity of cell lines
Drug resistance data (IC50 value) was downloaded from the GDSC website (21), the CCLE website (22), in addition to IC50 values generated in house measured by MTS assay three or more times in NSCLC cell lines (10). IC50 values were compared between cell lines in the highest and lowest third of NKX2-1 mRNA expression by t-test.
Results
Clinical characteristics of LUAD cohorts and robust quantification of TTF1 by RPPA
To investigate the molecular profiles of TTF1-negative tumors, TTF1 expression was quantified at the protein and gene expression levels and correlated with genomic and proteomic profiles from two large independent cohorts of LUAD. These included: 1) a cohort of 93 surgically resected LUADs from patients treated at MDACC (the “PROSPECT” cohort) and 2) 181 LUADs from The Cancer Genome Atlas (TCGA).
Clinical features and select mutational profiles of the 93 tumors with RPPA data from the PROSPECT cohort are shown in Table 1. The clinical characteristics of the overall TCGA cohort were recently published (12) and included 181 resected LUAD tumors with RPPA proteomic data (Table 1 shows clinical and mutational characteristics of those tumors with full protein data used in this study). Both cohorts were similar in terms of patients' characteristics, including previous smoking status and mutation status. Both cohorts included a range of Stage I-III tumors, although a majority were Stage I (52% of both). Former and current smokers made up >80% of patients in both cohorts; KRAS mutations were present in 28% and 26% of patients (PROSPECT and TCGA, respectively); EGFR mutations in 5% and 15% (PROSPECT and TCGA, respectively).
Since TTF1 is typically measured in clinical practice by immunohistochemistry (IHC), we first compared the quantification of TTF1 protein by IHC (the gold standard) with TTF1 protein levels measured by reverse phase protein array using the PROSPECT cohort. TTF1 protein expression, as measured by IHC, was quantified by a thoracic pathologist on a scale of 0-300 that reflects degree (0-3+) and extent (0-100% of tumor cells) of staining positive for TTF1 (11). Fourteen tumors had an IHC score equal to zero (“TTF1 negative”) and 79 had positive values ranging from 7-300 (median 137). IHC scores were then correlated with TTF1 protein levels measured by RPPA (Figure 1A) and NKX2-1 (the gene name for TTF1) mRNA levels (Figure 1B) from the same tumors by Spearman rank correlation.
Figure 1. Robust quantification of TTF1/NKX2-1 in clinical samples.
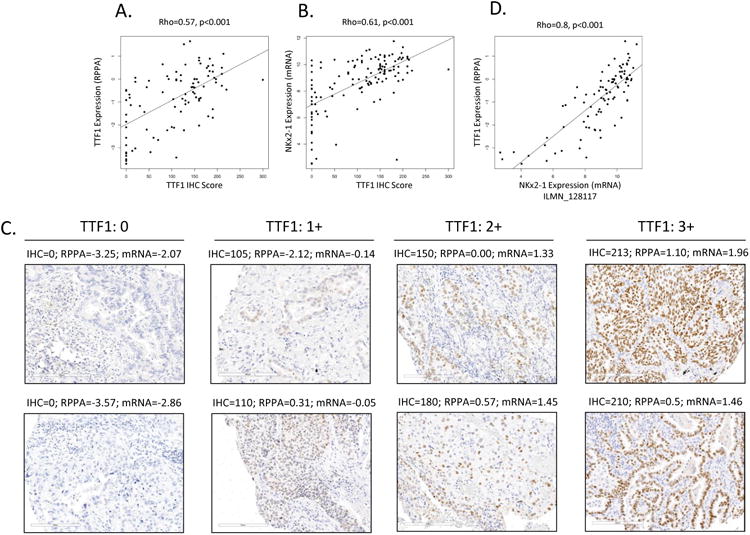
TTF1 as measured by IHC (the gold standard) and by RPPA correlate well (A) in the PROSPECT cohort (n=94). NKX2-1 mRNA expression and TTF1 IHC scores also correlate well (B) across a larger PROSPECT cohort (n=152) for which both gene expression and IHC data were available. Representative images of 0, 1+, 2+ and 3+ TTF1 IHC stating correlate well to IHC, RPPA and mRNA scores (C). By way of cross validation, NKX2-1 gene expression and TTF1 RPPA also correlated well (D, n=94).
As shown in Figure 1A-B, IHC scores were highly correlated with both RPPA protein measurements (Rho=0.57) as well as mRNA (Rho=0.61) (p<0.001 for both). Although IHC negative tumors (score=0) represented a majority of tumors with the lowest TTF1 levels by RPPA, some IHC negative tumors had relatively higher TTF1 when measured by RPPA. The range of TTF1 levels observed among IHC-negative tumors is likely due to a combination of the greater sensitivity of the RPPA platform to detect low levels of TTF1 (23) and the presence of TTF1-expressing bronchial epithelial cells (non-cancer cells) (24) that represent a fraction of the total protein lysate used for RPPA. Indeed, the correlation between TTF1 RNA and RPPA levels were greater than those of IHC with either technology consistent with this contention. Nevertheless, because cases in the PROSPECT and TCGA cohorts were required to have >70% tumor content, the extent to which non-cancer cells contribute to the levels of TTF1/NKX2-1 in the RPPA and gene expression data is expected to be limited.
The strong correlation between IHC score, TTF1 protein (RPPA) levels, and NKX2-1 mRNA levels (Figure 1A,B & C) indicate that the experimental methods subsequently used in this study to define TTF1 status (e.g., RPPA and mRNA levels) were robust and highly correlated with the clinical gold-standard of TTF1 quantification by IHC. By way of cross-validation, mRNA and protein (RPPA) expression values were compared in both PROSPECT and TCGA patients revealing very strong correlations (Figure 1D Rho= 0.8, p<0.001 for PROSPECT and Rho=0.78 p<0.001 for TCGA (Supplemental Figure 1)).
Low TTF1 expression is associated with worse outcome in LUAD
Measurements of TTF1 by RPPA revealed a bimodal distribution of low- and high-TTF1 expressing tumors in the PROSPECT and TCGA cohorts (Figure 2A). Because of the highly quantitative nature of RPPA that allows for protein detection even at extremely low levels, we used this bimodal split to define TTF1-negative versus TTF1-positive tumors. Using this approach, we classified 25% of tumors as TTF1-negative, similar to the 15-20% of LUADs reported in the literature as being TTF1-negative by IHC (25). Tumors classified as TTF1-positive by RPPA had corresponding median IHC scores of 145 (range 0-300), while TTF1-negative tumors had median IHC scores of 20 (range 0-190).
Figure 2. TTF1-negative defined by RPPA is associated with worse clinical outcome.
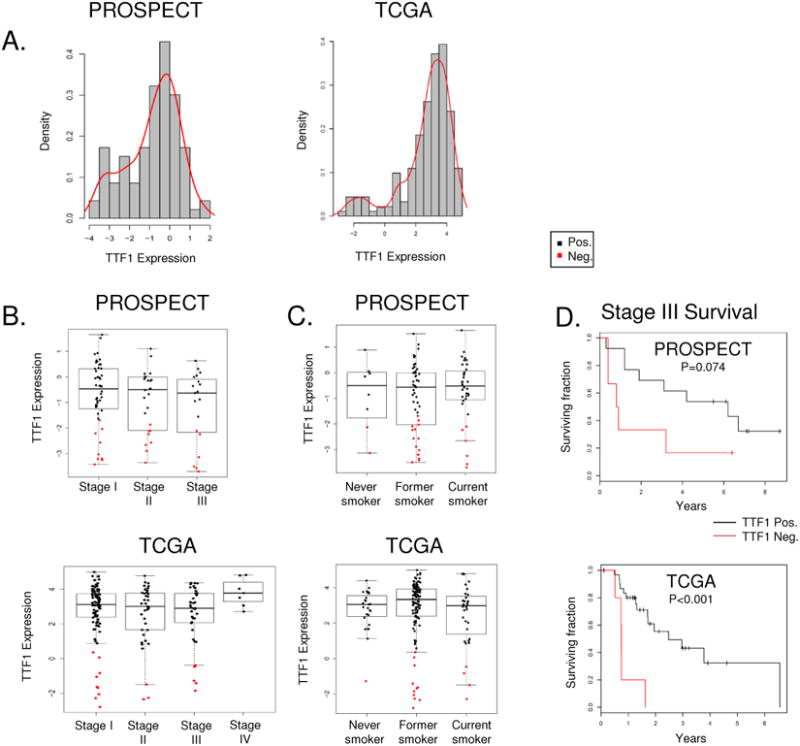
Density plot analysis of both cohorts reveals are bimodal distribution of TTF1 expression by RPPA (A) categorizing LUAD biopsy samples into new TTF1-negative and –positive groups. TTF1-negative disease is observed across stages I-III (B) and all smoking statuses (C). As previously described TTF1-negative disease is associated with worse overall survival (D).
LUAD patients with TTF1-negative tumors as assessed by IHC have previously been described to have worse clinical outcomes (4). We confirmed this observation in our cohorts and investigated the association of TTF1 levels with other clinical characteristics. TTF1-negative tumors were found across all stages and grades of LUAD, with no significant difference in TTF1-levels between stages in either PROSPECT or TCGA cohorts (Figure 2B). Although smoking history was also not statistically significantly associated with TTF1 expression (p=0.309 for PROSPECT and p=0.242 for TCGA), TTF1-negative tumors were infrequent among never smokers (2/8 in PROSPECT and 1/27 in TCGA) (Figure 2C).
Consistent with previously published studies (4), clinical outcome for patients with TTF1-negative tumors was worse in both cohorts (Figure 2D). For example, patients with TTF-1 negative, locally advanced (Stage III) disease had significantly reduced overall survival among the TCGA LUAD cohort (p<0.001), with TTF1-negative Stage III PROSPECT patients also trending towards shorter survival (p=0.07). Similar trends were observed in stage I and II disease where TTF-1-negative tumors were associated with shorter survival, however these did not reach statistical significance (p=0.17 and 0.16 for PROSPECT, p=0.18 and 0.24 for TCGA). Consistent with findings from the TCGA (12) which described a low prevalence of TTF1-negative tumors in the terminal respiratory unit (TRU) group of LUAD, only 6% of TTF1-negative tumors in our analysis were classified as TRU. However, we found no difference in the frequency of TTF1-negative tumors between the proximal proliferative (PP) and proximal inflammatory subtypes (47% (8/17) for both).
Identification of druggable mutations in TTF1 negative LUAD
Next, we assessed the relationship between TTF1 status and the incidence of established or potentially druggable mutations. For the most common of these, EGFR mutations, prior studies have reported a lower incidence of EGFR mutations among TTF1-negative LUAD (3). In our analysis, comparison of TTF1 expression between EGFR mutant and wild type tumors in the TCGA cohort showed high levels of TTF1 protein in the vast majority of EGFR mutated LUAD (Figure 3A). Only two EGFR-mutated TCGA samples (one patient had an L861Q alteration and the other both G719A and S768I alterations) were observed among 17 TTF1-negative tumors. However, these mutations are non-classical (26) and their potential association with EGFR TKI response in patients is not fully characterized. While the G719A and S768I mutations individually are associated with increased EGFR inhibitor sensitivity, there are conflicting reports as to how these mutations interact when co-occurring in the same tumor (27). Similar to the TCGA cohort, in the PROSPECT group, tumors with EGFR mutations (n=5) had some of the highest levels of TTF1 across the entire group and no EGFR mutations occurred in TTF1-negative cancers (Figure 3A).
Figure 3. Association between TTF1 and mutation status.
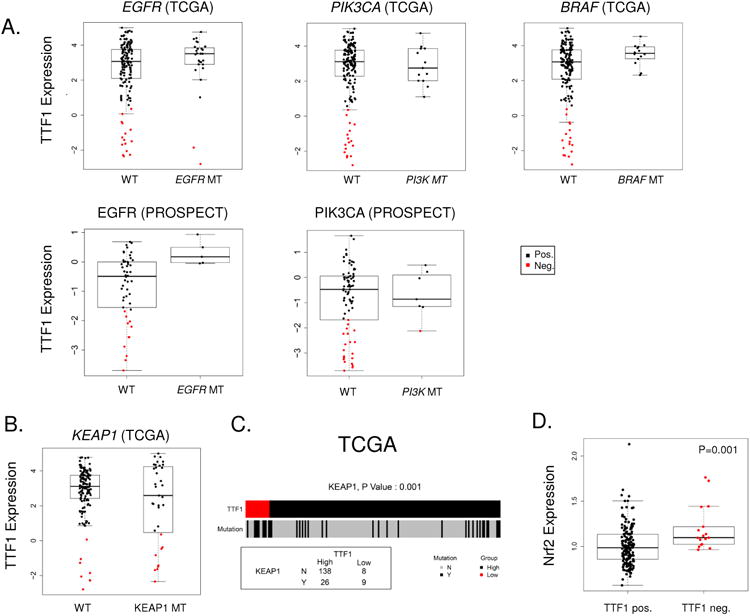
Comparison of TTF1 protein levels between wild type and mutant samples reveals a distinct association between TTF-1 positive disease and mutations (A) in EGFR (TCGA and PROSPECT), PIK3CA (TCGA and PROSPECT, and BRAF (TCGA). Particularly notable is the absence of TTF-1 negative samples in the BRAF mutant group. TCGA TTF1-negative samples show an enrichment of KEAP1 mutations (B & C, p=0.001). KEAP1 negatively regulates NRF2; as predicted analysis of Nrf2 reveals higher expression in TTF1-negative LUAD (D, p=0.001).
Analysis comparing TTF1 expression between wild type and mutant groups for other significantly mutated genes in the TCGA cohort(12) identified additional associations between TTF1 status and mutations. Here we show that BRAF mutations (n=13) are associated with high TTF1 expression and no BRAF mutations are observed among TTF1-negative tumors (Figure 3A), in agreement with a previous study that reported BRAF V600E mutations in TTF1-positive LUAD(28). Given the recent granting of breakthrough therapy designation for use of the BRAF inhibitor dabrafenib in BRAF mutant NSCLC (29-31), this observation may have clinical relevance for the selection of LUAD patients for BRAF testing.
Other potentially druggable mutations occurring preferentially in TTF1-positive LUAD included HER2 (ERBB2) mutations (n=21, all TTF1 positive in TCGA) and PIK3CA mutations (all 13 occurring in the TTF1-positive group in the TCGA cohort; 6/7 in PROSPECT). In contrast, there was no significant association observed between STK11 (LKB1), KRAS, ALK (fusion), or TP53 alterations and TTF1 status. Mutations in RIT1 and NF1 were recently identified as novel candidate driver genes in oncogene negative LUAD by the TCGA. Of these, we found RIT1 mutations to be more frequent in TTF1-negative LUAD 12% (2/17) versus TTF1-positive 2% (3/164) although this was not statistically significant (p=0.07). As expected, the overall oncogene-positive group of TCGA tumors had a trend towards higher TTF1 protein expression as compared to oncogene-negative tumors (p=0.07)
We then investigated mutations that were enriched in the TTF1-negative group. This analysis revealed a new association between mutations in kelch-like ECH-associated protein 1 (KEAP1) and TTF1-negative tumors (Figure 3B-C). Specifically, KEAP1 mutations were observed more frequently in TTF1-negative tumors (53% of TTF1-negative tumors as compared to 16% of TTF1-positive; p=0.001). KEAP1 is a substrate adapter protein for the E3 ubiquitin ligase complex that targets the transcription factor nuclear factor (erythroid 2)-like 2 (Nrf2) for ubiquitination and degradation by the proteasome. Nrf2 is a master regulator of the antioxidant response, the accumulation of which has been shown to be associated with poor prognosis in a number of cancers including lung cancer (32, 33). Nrf2 is being explored as a therapeutic target in pre-clinical studies in pancreatic and breast cancers.
Integrated analysis reveals distinct protein signature in TTF-1-negative LUAD
To identify potential therapeutic targets or activated pathways in TTF1-negative tumors, we next performed an integrated analysis comparing protein and mRNA expression in TTF1-negative versus TTF1-positive tumors from PROSPECT and TCGA. In the PROSECT cohort, 127 total or phosphorylated proteins were measured by RPPA and differences in protein expression between TTF1-positive and negative tumors were assessed by t-test. This analysis revealed significant, global differences in protein expression in TTF1-negative tumors with 71 of 127 (56%) proteins and/or phospho-proteins significantly different between TTF1-negative and –positive tumors (at a p-value <0.05) (Supplemental Table 1). Of these 71 proteins, 14 were expressed at lower levels in TTF1-negative samples, including a number of phosphorylated proteins in the MAPK and PI3K/mTOR pathways—suggesting relatively lower levels of activation of these pathways in TTF1-negative tumors. In contrast, of the 58 proteins that were higher in TTF1-negative LUAD, there was striking enrichment of proteins involved in DNA repair and cell cycle regulation (Figure 4A).
Figure 4. Protein signature of TTF-1 negative LUAD.
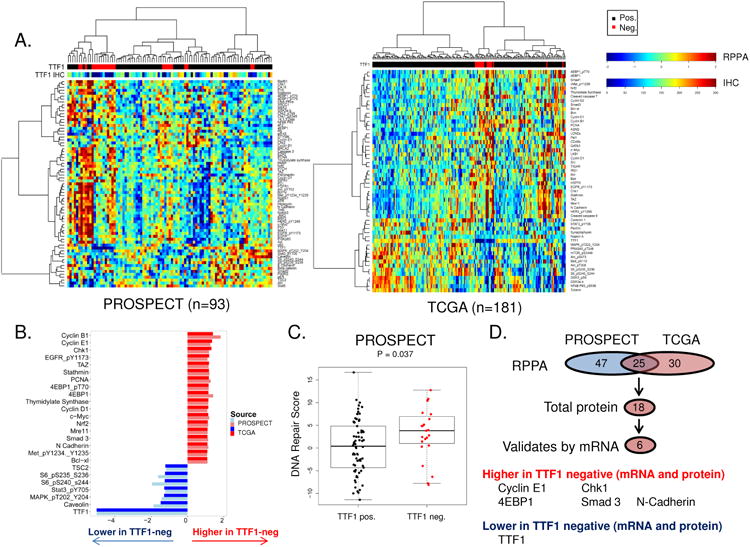
Unsupervised hierarchal clustering of protein expression (RPPA) in two clinical cohorts of LUAD (A). Comparison of protein expression between bimodally distributed TTF1-negative and positive LUAD identifies 25 proteins common to both cohorts (B & D, p<0.05). Validation of the 18 total proteins identified using mRNA expression analysis (p<0.05) identifies a five component signature commonly upregulated in TTF1-negative disease across both cohorts and platforms (D). TTF1-negative LUAD also have a higher DNA repair score (20) identifying agents that target DNA repair as potential therapeutic target for these patients (C)
These findings were then compared to differences between TTF1-negative and positive tumors in the TCGA cohort. Again, we observed a large number of protein markers (55/160) that were different between the TTF1-negative and -positive groups (p<0.05) (Supplemental Table 2). Similar to PROSPECT, proteins expressed at lower levels in TTF1-negative tumors were highly enriched for those in the PI3K/mTOR (e.g., pmTOR, pAkt) and MAPK (e.g., pMAPK) pathways and their shared downstream target pS6 (Figure 4A). Conversely, as in the PROSPECT cohort, the 36 targets higher in TTF1-negative LUAD were often involved in DNA repair, cell cycle regulation, and apoptosis (Figure 4A).
To identify those proteins with the strongest relationship to TTF1 status, we compared the common protein differences between the two cohorts. 25 proteins were commonly associated with TTF1 status (positively or negatively correlated) in both cohorts (Figure 4B). These included Cyclin B1 (p=0.049 in PROSPECT, p<0.001 in TCGA), thymidylate synthase (TS) (p<0.001, p=0.005), Chk1 (p<0.001, p=0.017), Nrf2 (p=0.036, p=0.001) (all higher in TTF1 negative tumors)and phosphorylated S6 kinase (p=0.002,p<0.001) (lower in TTF1 negative tumors). The higher incidence of mutations in genes such as PIK3CA, EGFR, BRAF, and HER2 in the TTF1-positive tumors may, in part, explain the higher levels of phosphorylated S6 seen in TTF1-positive tumors, since pS6 is a downstream target of pathways activated by these genes (e.g., PI3K and MAPK). Comparing TTF1 and other proteins as continuous variables in PROSPECT also showed significant correlations between TTF1 and 22 of the 25 commonly associated proteins (FDR ≤ 0.05, Supplemental Table 3).
Having observed higher expression of several DNA repair genes in TTF1-negative tumors (e.g. Mre11, Chk1, PCNA), we applied our previously characterized “DNA repair score” (20) to the protein expression data in PROSPECT and TCGA. As shown in Figure 4C, the DNA repair score was higher in TTF1-negative samples from the PROSPECT cohort (P=0.037). TCGA data also trended towards a higher DNA repair score in TTF1 negative tumors (p=0.072), but the analysis was limited as the TCGA RPPA analysis includes only 9 of the 17 components of the score. As we would predict based on the higher frequency of KEAP1 loss in TTF1-negative LUAD (described above in Figure 3B) and its role as a negative regulator of Nrf2, we also observed higher expression of Nrf2 protein in TTF1-negative tumors (TCGA p=0.001, PROSPECT p=0.005) (Figure 3D). Nrf2 and TTF1 proteins also showed a negative correlation when examined as continuous variables (TCGA R=-0.27, p<0.001), further confirming the relationship.
TTF1-negative and positive LUAD have clear differences at the mRNA level (Supplemental Figure 2). Therefore, as a method of validating the observed differences in total protein levels between the TTF1-positive and –negative tumors, we then compared differences in the corresponding mRNA levels for 18 targets where the antibody used detected total (rather than phosphorylated) protein levels. Five out of 15 total proteins identified as more highly expressed in TTF1-negative tumors were also significantly elevated in these tumors at the mRNA level (p<0.05). These were Cyclin E1, Chk1, 4EBP1, Smad3, and N Cadherin that were higher at the protein and mRNA levels in both cohorts (Figure 4D). The only target commonly lower in TTF1-negative tumors across both cohorts and both platforms was TTF1 itself (of 3 proteins identified).
We have previously observed increased expression of DNA repair proteins in SCLC, which we hypothesize to be driven through increased activity of the transcription factor E2F1 (11). We thus looked for alterations in the TTF1-negative population that could affect E2F1 regulation. The activity of the transcription factor E2F1 can be regulated in a number of ways, including by RB1 (11, 20), CDKN2A (p16) (34), and c-Myc (35). Our analysis reveals no difference in RB1 protein, copy number or mutation rate between the TTF1-positive and –negative groups. TTF1-negative LUAD does, however, show higher levels of c-myc expression (Figure 4B), potentially driving E2F1 activity through miR-17-5p and miR-20a (35). Additionally, copy number analysis in the TCGA cohort reveals CDKN2A loss to be strongly associated with reduced TTF1 expression (p<0.001) with CDKN2A copy number loss observed in 7/17 TTF1-negative tumors. RB1 and CDKN2A both inhibit E2F1; RB1 and CDKN2A loss thus similarly enhance E2F1 activation (20, 34), and may therefore also contribute to the higher DNA repair score seen in TTF1-negative LUAD. These potential mechanisms for driving E2F1 in TTF1-negative LUAD are shown in Figure 5D. The inverse relationship between TTF1 status and TS (another target of E2F1 (36)) is in agreement with previous observations that low TS and high TTF1 expression associate with a better response to pemetrexed in non-squamous NSCLC (37, 38).
Figure 5. Therapeutic targets in TTF1-low LUAD cell lines.
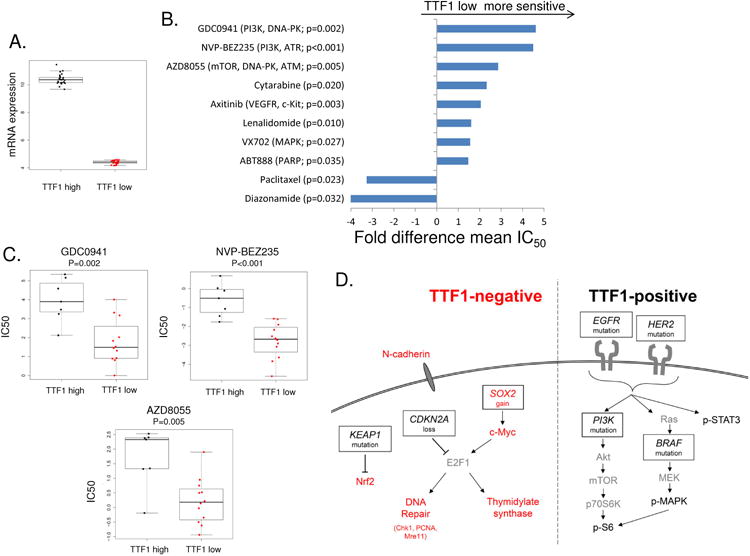
Comparison of the top and bottom thirds of cell lines by NKX2-1 expression (A) to IC50 values from drug sensitivity databases identify TTF1-low LUAD cell lines as being more sensitive to agents that impair DNA repair (B & C). Potential mechanisms for the higher expression of thymidylate synthase and DNA repair proteins via E2F1 in TTF1-negative LUAD and elevated PI3K/MAPK signaling in TTF1-positive LUAD (D) combining genetic and protein observations. Proteins/genes in red are higher/more active in TTF1-negative, those in black in TTF-positive LUAD. Copy number loss of SOX2 or gain of CDK2NA can both lead to increased E2F1.
Other proteins expressed at higher levels in TTF1-negative cohorts including c-Myc, 4EBP1 and EGFR are downstream targets of the transcription factor sex determining region Y-box 2 (SOX2) (39). SOX2 has previously been characterized as both a marker (40) and driver (41, 42) of lung squamous carcinoma where SOX2 amplification is commonly observed and results in increased tumor formation, migration and proliferation through the activation of hedgehog signaling (23). Copy number analysis between TTF1-negative and -positive tumors in the TCGA cohort reveals SOX2 copy number gain in the TTF1-negative population (p=0.001). SOX2 copy number gain has been associated with increased SOX2 expression (43), suggesting a potential mechanism for the higher expression of targets such as c-Myc (and therefore E2F1 which can be activated by c-Myc, Figure 5D), 4EBP1 and EGFR in TTF1-negative tumors. An analysis of gene expression across all tumors in the larger PROSPECT data set (LUAD and lung squamous carcinoma) shows an inverse correlation between SOX2 and TTF1 (Rho=-0.39, p<0.001) further supporting that higher SOX2 may be one mechanism driving the molecular differences observed in TTF1-negative disease. Furthermore, SOX2 is also frequently amplified in SCLC (42), suggesting that TTF1-negative LUAD may be molecularly similar to SCLC. Interestingly, the proteomic differences between TTF1-negative and positive overlap with those observed between SCLC and NSCLC (11).
Therapeutic targets in TTF1-low LUAD
As illustrated above, most of the known targetable populations in LUAD (e.g., EGFR and BRAF mutants, ALK fusions) are found in TTF1-positive adenocarcinomas. Because TTF1-negative patients have worse clinical outcomes and currently lack validated therapeutic targets; there is a critical unmet need to develop more effective therapies for these patients. To identify drugs that may have activity in TTF1-negative LUAD, we compared in vitro drug sensitivity (based on IC50 values) between cell lines with the highest versus lowest TTF1 expression (based on NKX2-1 mRNA levels) (Figure 5A). As with PROSPECT and TCGA patient tumors, mRNA and protein were highly correlated for NKX2-1/TTF1 (Rho=0.61, p<0.001). This analysis assessed 129 targeted drugs and/or chemotherapies using in vitro data from our groups and public databases (21, 22).
Using this approach, we identified 10 drugs with relatively greater activity in cell lines with low TTF1 expression (Figure 5B and Supplemental Figure 3, p<0.05). Consistent with our observations of higher expression of individual DNA repair proteins and a higher DNA repair score in TTF1-negative tumors in patient tumors (above), five of the eight drugs to which TTF1-low cell lines were more sensitive target components of DNA repair as either primary or secondary-target effects (Figure 5C, Supplemental Table 4). NVP-BEZ235 (p<0.001), for example, while developed as a PI3K inhibitor, is also a potent inhibitor of ATM and recent reports suggest that its primary anti-tumor effect is through ATM inhibition (44). Other drugs identified – GD0941, AZD8055, and ABT-888 (veliparib) – inhibit DNA-PK, ATM, and PARP respectively all components of DNA repair. When the DNA-repair signature is applied to the cell lines, the cell lines in the bottom third of NKX2-1 expression have a higher score than those in the top third (Supplemental Figure 4, P=0.063).
Among the chemotherapies tested, paclitaxel (a standard front-line chemotherapy for NSCLC) showed significantly less activity in cell lines with low TTF1 expression (p=0.023). This decreased sensitivity to a chemotherapy drug commonly used in locally advanced disease (e.g., with chemoradiation) and in the metastatic setting may contribute to the worse outcomes of TTF1-negative patients. A similar trend was observed with a second chemotherapy, pemetrexed (p=0.158) that has previously been reported to be more effective in TTF1-positive and thymidylate synthase low expressing LUAD (45).
Discussion
TTF1 is a clinical marker of LUAD that is typically scored as positive (1-3+) or negative (0) by immunohistochemistry. In this study, using two independent clinical cohorts, we tested a new approach to measuring TTF1 protein expression using reverse phase protein array (RPPA). Measurements by RPPA were highly correlated with the gold-standard of IHC, as well as with mRNA expression levels. TTF1 levels in patient tumors (based on RPPA and gene expression) were bi-modally distributed, with approximately 25% falling into the group with lowest TTF1 expression (subsequently referred to in this analysis as TTF1-negative). Consistent with previous reports, TTF1-negative tumors from the PROSPECT and TCGA cohorts had worse survival outcomes. However, we did not observe significant differences in smoking status, stage, or other clinical characteristics based on TTF1 status.
Gene sequencing performed in PROSPECT and TCGA afforded the opportunity to investigate the relationship between TTF1-status and specific gene mutations. One of the most striking and novel observations from this analysis was that BRAF mutations were observed only in patients with very high TTF1 levels. BRAF inhibition has recently received breakthrough therapy designation for the treatment of BRAF-mutant NSCLC (29-31). However, the frequency of this alteration in the overall population of LUAD is low (<10 %(12)). Therefore, our observation suggests that BRAF testing is likely to be the most clinically relevant and cost effective in TTF1-positive LUADs. Other mutations such as EGFR and PIK3CA also occurred most commonly in tumors with the highest levels of TTF1 protein expression (top third of TTF1 expression). The prevalence of these mutations may explain the higher activation of the mTOR/AKT and MAPK pathways (downstream targets of EGFR, BRAF, and PI3K) in TTF1-positive tumors observed in our proteomic analysis. Copy number gain at the NKX2-1 locus is seen in 15% of TTF1-postive patients in the TCGA cohort, explaining the observed TTF1 levels in a subset of TTF1-positive patients. For patients without copy number alterations, however, increased NKX2-1 transcription may account for the observed levels of NKX2-1 mRNA and resulting TTF1 protein. NKX2-1 is promoted by a number of transcription factors, including specificity protein 1 (Sp1)(46) which a direct target of ErbB4 and the ERK and Akt pathways--all of which we show are more highly expressed in TTF1-postive LUAD(47, 48).
In contrast, KEAP1 mutations were enriched in TTF1-negative tumors (53% vs 16%, p=0.001) with resulting overexpression of its protein target Nrf2 (Nrf2 is expression is high in all TTF1-negative LUAD). Drugs with potential activity against Nrf2 have been described, suggesting that KEAP1-Nrf2 alterations in TTF1-negative disease may represent a therapeutic vulnerability for future investigation. For example, alkaloid trigonelline, an inhibitor of Nrf2, renders pancreatic cancer more susceptible to apoptosis (49); ochratoxin inhibits the Nrf2 oxidative stress response pathway (50); and brusatol increases intracellular ROS sensitizing mammospheres to taxol (51). Thus, an Nrf2 inhibitor or the inhibition of Nrf2 by increasing the expression of caveolin (52) may be of therapeutic benefit in all TTF1-negative LUAD.
Among the other proteins that we found more highly expressed in TTF1-negative LUAD, several were targets of the SOX2 transcription factor (e.g., cMyc, 4EBP1, and Cyclin D1 (39, 53)). In contrast to TTF1, SOX2 is a marker of lung squamous carcinoma and is also frequently amplified in SCLC (42). To further explore a potential role for SOX2 in TTF1-negative adenocarcinomas, we performed a copy number analysis of SOX2 in the TCGA LUAD cohort. This revealed a subset of TTF1-negative TCGA tumors with SOX2 copy number gain (n=3/17). The higher expression of SOX2 targets in TTF1-negative LUAD, combined with more frequent SOX2 amplification events in this group, suggest that the biology of TTF1-negative LUAD may be more similar to squamous lung cancers.
Finally, our results suggest a potential role for DNA repair inhibitors in TTF1-negative LUAD based on:1) proteomic tumor profiles showing higher expression of individual DNA repair proteins and the DNA repair score in TTF1-negative LUAD and 2) greater sensitivity of TTF1-negative LUAD models to DNA repair inhibitors. Previously, our group demonstrated that lung cancer models of SCLC with elevated DNA repair scores are more sensitive to PARP inhibition (20). Consistent with this, we found that TTF1-negative LUAD cell lines had higher DNA repair scores and demonstrated greater sensitivity to the PARP inhibitor veliparib (Figure 4B). Our previous work in SCLC has shown not only a correlation between DNA repair protein expression and sensitivity to PARP inhibition, but also an inverse correlation to PI3K pathway activity (20) – an observation recapitulated here that may apply more broadly to lung cancers. Association between DNA repair protein expression and susceptibility to DNA repair antagonists is of particular clinical importance given that the PARP inhibitor veliparib is in clinical trial testing for NSCLC patients (NCT02106546). Additionally, several other small molecule inhibitors with activity against DNA repair targets were also among the top drugs with preferential activity in TTF1-negative cell lines. These included GDC0941, NVP-BEZ235, and AZD8055, which have activity against DNA-PK, ATR and ATM. In summary, molecular profiling shows TTF1-negative LUAD lack BRAF mutations but have potential sensitivity to agents targeting the KEAP1/Nrf2 and DNA repair pathways, observations with clinical implications both for which patients should be screened for treatment with BRAF inhibitors and the potential for targeted treatments in this subset of LUAD.
Supplementary Material
Translational Relevance.
TTF1 is an immunohistochemical marker routinely used in the diagnosis of lung adenocarcinoma. However, approximately 15-20% of lung adenocarcinomas do not express TTF1 and these cancers are associated with a worse prognosis. Currently, there are no targeted therapies with proven efficacy in these patients, particularly TTF1 negative tumors rarely harbor established druggable mutations such as EGFR. Here we report distinct proteomic profiles in TTF1-negative tumors, including higher expression of several potential drug targets, suggesting a distinct biology. To explore translational applications of these findings, we analyzed preclinical models and found that inhibitors of these proteins (especially DNA repair proteins) had relatively greater activity in TTF1-negative cell lines, supporting their further investigation as candidate therapeutic targets. Despite its negative prognostic associations, the routine use of TTF1 IHC provides a key opportunity to leverage TTF1 as a predictive biomarker to guide treatment selection of drugs that work preferentially in this population.
Acknowledgments
Financial support: This work was supported by DoD PROSPECT grant W81XWH-07-1-0306; TCGA (5-U24-CA143883-05); NIH Cancer Center Support Grant (CCSG) CA016672 (MDACC); NIH SPORE grant P50CA097007 (MDACC), MDACC Physician Scientist Award (LB),and NCI Cancer Clinical Investigator Team Leadership Award (P30 CA016672)(LB).
GBM has received sponsored research support from Glaxo SmithKline and AstraZeneca and serves on the scientific advisory board of AstraZeneca. JVH has received sponsored research support from Glaxo SmithKline and AstraZeneca and serves on the scientific advisory boards of Genentech, AstraZeneca, Glaxo SmithKline, Eli Lilly and Company, Boerhinger Ingelheim and Exelixis. LAB has served as a consultant for AbbVie Pharmaceutical Research & Development and for BioMarin Pharmaceutical Inc.
Footnotes
Conflicts of interest: The other authors report no relevant conflicts of interest.
References
- 1.Bingle CD. Thyroid transcription factor-1. Int J Biochem Cell Biol. 1997;29:1471–3. doi: 10.1016/s1357-2725(97)00007-1. [DOI] [PubMed] [Google Scholar]
- 2.Yamaguchi T, Hosono Y, Yanagisawa K, Takahashi T. NKX2-1/TTF-1: an enigmatic oncogene that functions as a double-edged sword for cancer cell survival and progression. Cancer Cell. 2013;23:718–23. doi: 10.1016/j.ccr.2013.04.002. [DOI] [PubMed] [Google Scholar]
- 3.Tang X, Kadara H, Behrens C, Liu DD, Xiao Y, Rice D, et al. Abnormalities of the TITF-1 lineage-specific oncogene in NSCLC: implications in lung cancer pathogenesis and prognosis. Clin Cancer Res. 2011;17:2434–43. doi: 10.1158/1078-0432.CCR-10-1412. [DOI] [PMC free article] [PubMed] [Google Scholar]
- 4.Solis LM, Behrens C, Raso MG, Lin HY, Kadara H, Yuan P, et al. Histologic patterns and molecular characteristics of lung adenocarcinoma associated with clinical outcome. Cancer. 2012;118:2889–99. doi: 10.1002/cncr.26584. [DOI] [PMC free article] [PubMed] [Google Scholar]
- 5.Takeuchi T, Tomida S, Yatabe Y, Kosaka T, Osada H, Yanagisawa K, et al. Expression profile-defined classification of lung adenocarcinoma shows close relationship with underlying major genetic changes and clinicopathologic behaviors. J Clin Oncol. 2006;24:1679–88. doi: 10.1200/JCO.2005.03.8224. [DOI] [PubMed] [Google Scholar]
- 6.Yatabe Y, Kosaka T, Takahashi T, Mitsudomi T. EGFR mutation is specific for terminal respiratory unit type adenocarcinoma. Am J Surg Pathol. 2005;29:633–9. doi: 10.1097/01.pas.0000157935.28066.35. [DOI] [PubMed] [Google Scholar]
- 7.Yoshida A, Tsuta K, Watanabe S, Sekine I, Fukayama M, Tsuda H, et al. Frequent ALK rearrangement and TTF-1/p63 co-expression in lung adenocarcinoma with signet-ring cell component. Lung Cancer. 2011;72:309–15. doi: 10.1016/j.lungcan.2010.09.013. [DOI] [PubMed] [Google Scholar]
- 8.Vincenten J, Smit EF, Vos W, Grunberg K, Postmus PE, Heideman DA, et al. Negative NKX2-1 (TTF-1) as temporary surrogate marker for treatment selection during EGFR-mutation analysis in patients with non-small-cell lung cancer. J Thorac Oncol. 2012;7:1522–7. doi: 10.1097/JTO.0b013e3182635a91. [DOI] [PubMed] [Google Scholar]
- 9.Shanzhi W, Yiping H, Ling H, Jianming Z, Qiang L. The relationship between TTF-1 expression and EGFR mutations in lung adenocarcinomas. PLoS One. 2014;9:e95479. doi: 10.1371/journal.pone.0095479. [DOI] [PMC free article] [PubMed] [Google Scholar]
- 10.Byers LA, Diao L, Wang J, Saintigny P, Girard L, Peyton M, et al. An epithelial-mesenchymal transition gene signature predicts resistance to EGFR and PI3K inhibitors and identifies Axl as a therapeutic target for overcoming EGFR inhibitor resistance. Clin Cancer Res. 2013;19:279–90. doi: 10.1158/1078-0432.CCR-12-1558. [DOI] [PMC free article] [PubMed] [Google Scholar]
- 11.Byers LA, Wang J, Nilsson MB, Fujimoto J, Saintigny P, Yordy J, et al. Proteomic Profiling Identifies Dysregulated Pathways in Small Cell Lung Cancer and Novel Therapeutic Targets Including PARP1. Cancer Discov. 2012;2:798–811. doi: 10.1158/2159-8290.CD-12-0112. [DOI] [PMC free article] [PubMed] [Google Scholar]
- 12.The Cancer Genome Atlas Research N. Comprehensive molecular profiling of lung adenocarcinoma. Nature. 2014 doi: 10.1038/nature13385. advance online publication. [DOI] [PMC free article] [PubMed] [Google Scholar]
- 13.Hu J, He X, Baggerly KA, Coombes KR, Hennessy BT, Mills GB. Non-parametric quantification of protein lysate arrays. Bioinformatics. 2007;23:1986–94. doi: 10.1093/bioinformatics/btm283. [DOI] [PubMed] [Google Scholar]
- 14.Neeley ES, Baggerly KA, Kornblau SM. Surface Adjustment of Reverse Phase Protein Arrays using Positive Control Spots. Cancer Inform. 2012;11:77–86. doi: 10.4137/CIN.S9055. [DOI] [PMC free article] [PubMed] [Google Scholar]
- 15.Tang H, Xiao G, Behrens C, Schiller J, Allen J, Chow CW, et al. A 12-gene set predicts survival benefits from adjuvant chemotherapy in non-small cell lung cancer patients. Clin Cancer Res. 2013;19:1577–86. doi: 10.1158/1078-0432.CCR-12-2321. [DOI] [PMC free article] [PubMed] [Google Scholar]
- 16.Solis LM, Raso MG, Kalhor N, Behrens C, Wistuba II, Moran CA. Primary oncocytic adenocarcinomas of the lung: a clinicopathologic, immunohistochemical, and molecular biologic analysis of 16 cases. Am J Clin Pathol. 2010;133:133–40. doi: 10.1309/AJCPOQWPT1T1AJFT. [DOI] [PubMed] [Google Scholar]
- 17.Tang X, Shigematsu H, Bekele BN, Roth JA, Minna JD, Hong WK, et al. EGFR tyrosine kinase domain mutations are detected in histologically normal respiratory epithelium in lung cancer patients. Cancer Res. 2005;65:7568–72. doi: 10.1158/0008-5472.CAN-05-1705. [DOI] [PubMed] [Google Scholar]
- 18.Shigematsu H, Lin L, Takahashi T, Nomura M, Suzuki M, Wistuba II, et al. Clinical and biological features associated with epidermal growth factor receptor gene mutations in lung cancers. J Natl Cancer Inst. 2005;97:339–46. doi: 10.1093/jnci/dji055. [DOI] [PubMed] [Google Scholar]
- 19.The results shown here are in whole or part based upon data generated by the TCGA Research Network: http://cancergenome.nih.gov/
- 20.Cardnell RJ, Feng Y, Diao L, Fan YH, Masrorpour F, Wang J, et al. Proteomic markers of DNA repair and PI3K pathway activation predict response to the PARP inhibitor BMN 673 in small cell lung cancer. Clin Cancer Res. 2013;19:6322–8. doi: 10.1158/1078-0432.CCR-13-1975. [DOI] [PMC free article] [PubMed] [Google Scholar]
- 21.Yang W, Soares J, Greninger P, Edelman EJ, Lightfoot H, Forbes S, et al. Genomics of Drug Sensitivity in Cancer (GDSC): a resource for therapeutic biomarker discovery in cancer cells. Nucleic Acids Res. 2013;41:D955–61. doi: 10.1093/nar/gks1111. [DOI] [PMC free article] [PubMed] [Google Scholar]
- 22.Barretina J, Caponigro G, Stransky N, Venkatesan K, Margolin AA, Kim S, et al. The Cancer Cell Line Encyclopedia enables predictive modelling of anticancer drug sensitivity. Nature. 2012;483:603–7. doi: 10.1038/nature11003. [DOI] [PMC free article] [PubMed] [Google Scholar]
- 23.Hennessy BT, Lu Y, Gonzalez-Angulo AM, Carey MS, Myhre S, Ju Z, et al. A Technical Assessment of the Utility of Reverse Phase Protein Arrays for the Study of the Functional Proteome in Non-microdissected Human Breast Cancers. Clin Proteomics. 2010;6:129–51. doi: 10.1007/s12014-010-9055-y. [DOI] [PMC free article] [PubMed] [Google Scholar]
- 24.Whitsett JA, Haitchi HM, Maeda Y. Intersections between pulmonary development and disease. Am J Respir Crit Care Med. 2011;184:401–6. doi: 10.1164/rccm.201103-0495PP. [DOI] [PMC free article] [PubMed] [Google Scholar]
- 25.McDonald JM, Pelloski CE, Ledoux A, Sun M, Raso G, Komaki R, et al. Elevated phospho-S6 expression is associated with metastasis in adenocarcinoma of the lung. Clin Cancer Res. 2008;14:7832–7. doi: 10.1158/1078-0432.CCR-08-0565. [DOI] [PMC free article] [PubMed] [Google Scholar]
- 26.Gazdar AF. Activating and resistance mutations of EGFR in non-small-cell lung cancer: role in clinical response to EGFR tyrosine kinase inhibitors. Oncogene. 2009;28(Suppl 1):S24–31. doi: 10.1038/onc.2009.198. [DOI] [PMC free article] [PubMed] [Google Scholar]
- 27.Kobayashi S, Canepa HM, Bailey AS, Nakayama S, Yamaguchi N, Goldstein MA, et al. Compound EGFR mutations and response to EGFR tyrosine kinase inhibitors. J Thorac Oncol. 2013;8:45–51. doi: 10.1097/JTO.0b013e3182781e35. [DOI] [PMC free article] [PubMed] [Google Scholar]
- 28.Yousem SA, Nikiforova M, Nikiforov Y. The histopathology of BRAF-V600E-mutated lung adenocarcinoma. Am J Surg Pathol. 2008;32:1317–21. doi: 10.1097/PAS.0b013e31816597ca. [DOI] [PubMed] [Google Scholar]
- 29.Gautschi O, Pauli C, Strobel K, Hirschmann A, Printzen G, Aebi S, et al. A patient with BRAF V600E lung adenocarcinoma responding to vemurafenib. J Thorac Oncol. 2012;7:e23–4. doi: 10.1097/JTO.0b013e3182629903. [DOI] [PubMed] [Google Scholar]
- 30.Planchard D, M J, R GJ. Interim results of phase II study BRF113982 of dabrafenib in BRAF V600E mutation-positive non-small cell lung cancer (NSCLC) patients. J Clin Oncol (Meeting Abstracts) 2013;31(Suppl 150) Abstract 8009. [Google Scholar]
- 31.http://www.nccn.org/professionals/physician_gls/f_guidelines.asp#nscl
- 32.Solis LM, Behrens C, Dong W, Suraokar M, Ozburn NC, Moran CA, et al. Nrf2 and Keap1 abnormalities in non-small cell lung carcinoma and association with clinicopathologic features. Clin Cancer Res. 2010;16:3743–53. doi: 10.1158/1078-0432.CCR-09-3352. [DOI] [PMC free article] [PubMed] [Google Scholar]
- 33.Jaramillo MC, Zhang DD. The emerging role of the Nrf2-Keap1 signaling pathway in cancer. Genes Dev. 2013;27:2179–91. doi: 10.1101/gad.225680.113. [DOI] [PMC free article] [PubMed] [Google Scholar]
- 34.Al-Khalaf HH, Colak D, Al-Saif M, Al-Bakheet A, Hendrayani SF, Al-Yousef N, et al. p16(INK4a) positively regulates cyclin D1 and E2F1 through negative control of AUF1. PLoS One. 2011;6:e21111. doi: 10.1371/journal.pone.0021111. [DOI] [PMC free article] [PubMed] [Google Scholar]
- 35.O'Donnell KA, Wentzel EA, Zeller KI, Dang CV, Mendell JT. c-Myc-regulated microRNAs modulate E2F1 expression. Nature. 2005;435:839–43. doi: 10.1038/nature03677. [DOI] [PubMed] [Google Scholar]
- 36.Huang CL, Liu D, Nakano J, Yokomise H, Ueno M, Kadota K, et al. E2F1 overexpression correlates with thymidylate synthase and survivin gene expressions and tumor proliferation in non small-cell lung cancer. Clin Cancer Res. 2007;13:6938–46. doi: 10.1158/1078-0432.CCR-07-1539. [DOI] [PubMed] [Google Scholar]
- 37.Sun JM, Han J, Ahn JS, Park K, Ahn MJ. Significance of thymidylate synthase and thyroid transcription factor 1 expression in patients with nonsquamous non-small cell lung cancer treated with pemetrexed-based chemotherapy. J Thorac Oncol. 2011;6:1392–9. doi: 10.1097/JTO.0b013e3182208ea8. [DOI] [PubMed] [Google Scholar]
- 38.Hou J, Lambers M, den Hamer B, den Bakker MA, Hoogsteden HC, Grosveld F, et al. Expression profiling-based subtyping identifies novel non-small cell lung cancer subgroups and implicates putative resistance to pemetrexed therapy. J Thorac Oncol. 2012;7:105–14. doi: 10.1097/JTO.0b013e3182352a45. [DOI] [PubMed] [Google Scholar]
- 39.Chen S, Xu Y, Chen Y, Li X, Mou W, Wang L, et al. SOX2 gene regulates the transcriptional network of oncogenes and affects tumorigenesis of human lung cancer cells. PLoS One. 2012;7:e36326. doi: 10.1371/journal.pone.0036326. [DOI] [PMC free article] [PubMed] [Google Scholar]
- 40.Yuan P, Kadara H, Behrens C, Tang X, Woods D, Solis LM, et al. Sex determining region Y-Box 2 (SOX2) is a potential cell-lineage gene highly expressed in the pathogenesis of squamous cell carcinomas of the lung. PLoS One. 2010;5:e9112. doi: 10.1371/journal.pone.0009112. [DOI] [PMC free article] [PubMed] [Google Scholar]
- 41.Justilien V, Walsh MP, Ali SA, Thompson EA, Murray NR, Fields AP. The PRKCI and SOX2 oncogenes are coamplified and cooperate to activate Hedgehog signaling in lung squamous cell carcinoma. Cancer Cell. 2014;25:139–51. doi: 10.1016/j.ccr.2014.01.008. [DOI] [PMC free article] [PubMed] [Google Scholar]
- 42.Rudin CM, Durinck S, Stawiski EW, Poirier JT, Modrusan Z, Shames DS, et al. Comprehensive genomic analysis identifies SOX2 as a frequently amplified gene in small-cell lung cancer. Nat Genet. 2012;44:1111–6. doi: 10.1038/ng.2405. [DOI] [PMC free article] [PubMed] [Google Scholar]
- 43.Freier K, Knoepfle K, Flechtenmacher C, Pungs S, Devens F, Toedt G, et al. Recurrent copy number gain of transcription factor SOX2 and corresponding high protein expression in oral squamous cell carcinoma. Genes Chromosomes Cancer. 2010;49:9–16. doi: 10.1002/gcc.20714. [DOI] [PubMed] [Google Scholar]
- 44.Gil del Alcazar CR, Hardebeck MC, Mukherjee B, Tomimatsu N, Gao X, Yan J, et al. Inhibition of DNA double-strand break repair by the dual PI3K/mTOR inhibitor NVP-BEZ235 as a strategy for radiosensitization of glioblastoma. Clin Cancer Res. 2014;20:1235–48. doi: 10.1158/1078-0432.CCR-13-1607. [DOI] [PMC free article] [PubMed] [Google Scholar]
- 45.Gronberg BH, Lund-Iversen M, Strom EH, Brustugun OT, Scott H. Associations between TS, TTF-1, FR-alpha, FPGS, and overall survival in patients with advanced non-small-cell lung cancer receiving pemetrexed plus carboplatin or gemcitabine plus carboplatin as first-line chemotherapy. J Thorac Oncol. 2013;8:1255–64. doi: 10.1097/JTO.0b013e3182a406a3. [DOI] [PubMed] [Google Scholar]
- 46.Boggaram V. Thyroid transcription factor-1 (TTF-1/Nkx2.1/TITF1) gene regulation in the lung. Clin Sci (Lond) 2009;116:27–35. doi: 10.1042/CS20080068. [DOI] [PubMed] [Google Scholar]
- 47.Zscheppang K, Giese U, Hoenzke S, Wiegel D, Dammann CE. ErbB4 is an upstream regulator of TTF-1 fetal mouse lung type II cell development in vitro. Biochim Biophys Acta. 2013;1833:2690–702. doi: 10.1016/j.bbamcr.2013.06.030. [DOI] [PMC free article] [PubMed] [Google Scholar]
- 48.Alroy I, Soussan L, Seger R, Yarden Y. Neu differentiation factor stimulates phosphorylation and activation of the Sp1 transcription factor. Mol Cell Biol. 1999;19:1961–72. doi: 10.1128/mcb.19.3.1961. [DOI] [PMC free article] [PubMed] [Google Scholar]
- 49.Arlt A, Sebens S, Krebs S, Geismann C, Grossmann M, Kruse ML, et al. Inhibition of the Nrf2 transcription factor by the alkaloid trigonelline renders pancreatic cancer cells more susceptible to apoptosis through decreased proteasomal gene expression and proteasome activity. Oncogene. 2013;32:4825–35. doi: 10.1038/onc.2012.493. [DOI] [PubMed] [Google Scholar]
- 50.Limonciel A, Jennings P. A review of the evidence that ochratoxin A is an Nrf2 inhibitor: implications for nephrotoxicity and renal carcinogenicity. Toxins (Basel) 2014;6:371–9. doi: 10.3390/toxins6010371. [DOI] [PMC free article] [PubMed] [Google Scholar]
- 51.Wu T, Harder BG, Wong PK, Lang JE, Zhang DD. Oxidative stress, mammospheres and Nrf2-new implication for breast cancer therapy? Mol Carcinog. 2014 doi: 10.1002/mc.22202. Epub 2014/08/27. [DOI] [PMC free article] [PubMed] [Google Scholar]
- 52.Volonte D, Liu Z, Musille PM, Stoppani E, Wakabayashi N, Di YP, et al. Inhibition of nuclear factor-erythroid 2-related factor (Nrf2) by caveolin-1 promotes stress-induced premature senescence. Mol Biol Cell. 2013;24:1852–62. doi: 10.1091/mbc.E12-09-0666. [DOI] [PMC free article] [PubMed] [Google Scholar]
- 53.Chen Y, Shi L, Zhang L, Li R, Liang J, Yu W, et al. The molecular mechanism governing the oncogenic potential of SOX2 in breast cancer. J Biol Chem. 2008;283:17969–78. doi: 10.1074/jbc.M802917200. [DOI] [PubMed] [Google Scholar]
Associated Data
This section collects any data citations, data availability statements, or supplementary materials included in this article.