

Abstract
In this paper, a novel image processing strategy is detailed for simultaneous measurement of tumor perfusion and neovascular morphology parameters from a sequence of dynamic contrast-enhanced ultrasound (DCE-US) images. After normalization and tumor segmentation, a global time-intensity curve describing contrast agent flow was analyzed to derive surrogate measures of tumor perfusion (i.e., peak intensity, time-to-peak intensity, area under the curve, wash-in rate, and wash-out rate). Further, a maximum intensity image was generated from these same segmented image sequences and each vascular component was skeletonized via a thinning algorithm. This skeletonized dataset and collection of vessel segments were then investigated to extract parameters related to the neovascular network and physical architecture (i.e., vessel-to-tissue ratio, number of bifurcations, vessel count, and average vessel length and tortuosity). An efficient computation of local perfusion parameters is also introduced and operates by averaging time-intensity curve data over each individual neovascular segment. Each skeletonized neovascular segment is then color-coded by these local measures to produce a parametric map detailing spatial properties of tumor perfusion. Longitudinal DCE-US image datasets were collected in 6 patients diagnosed with invasive breast cancer using a Philips iU22 ultrasound (US) system equipped with a L9-3 MHz transducer and Definity contrast agent. Patients were imaged using US before and after contrast agent dosing at baseline and again at weeks 6, 12, 18, and 24 after treatment started. Preliminary clinical results suggest that breast tumor response to neoadjuvant chemotherapy may be associated with temporal and spatial changes in DCE-US derived parametric measures of tumor perfusion. Moreover, changes in neovascular morphology parametric measures may also help identify any breast tumor response (or lack thereof) to systemic treatment. Breast cancer management from early detection to therapeutic monitoring is currently undergoing profound changes. The development of novel imaging techniques that are sensitive to the unique biological conditions of each individual tumor represent valuable tools in the pursuit of personalized medicine.
Keywords: Angiogenesis, breast cancer, contrast agent, microbubbles, neovascular morphology, tumor perfusion, ultrasound
INTRODUCTION
Breast cancer is a common type of cancer in women (29% of new cases) with the second highest mortality rate (14% of cancer deaths each year) (Siegel, Naishadham 2013). Monitoring response to treatment is a major challenge in the management of breast cancer. In the neoadjuvant setting, assessing tumor response to treatment prior to surgery including evaluation for pathologic response can provide prognostic information to help guide follow up care (Graham, Shupe 2014). The goals of personalized medicine are becoming increasingly important and include optimizing effective therapy for an individual patient, reducing drug associated morbidity, and reducing health care costs associated with overtreatment.
The angiogenic process by which the tumor develops its blood supply from pre-existing vessels to support metabolic demands can differentiate normal from cancerous breast tissue (Folkman 1986). An active tumor can stimulate angiogenesis by directly secreting angiogenic compounds. Several pro-angiogenic factors play a predominant role involved in the growth of endothelial cells and new blood vessel formation (Boudreau and Myers 2003). Increased neovascularity provides a valuable indication of tumor aggressiveness as adequate blood supply is crucial to sustain rapid growth and eventually metastasize to distant sites (Weidner, Folkman 1992, Weidner, Semple 1991, Weind, Maier 1998). Further, the morphology (or architecture) and structure of the neovasculature associated with malignant tumors has long been observed to be chaotic and unusual compared with that of healthy tissues. This tortuous, dilated and poorly organized neovascularity is hyperpermeable, which in turn can increase tumor interstitial fluid pressure and compromise systemic delivery of anticancer drugs (Jain 1988). Importantly, tumor- associated vascular irregularities can extend beyond the margins of a lesion, as pro-angiogenic growth factors can even influence the morphology of blood vessels in the vicinity of tumors (Bullitt, Lin 2007). Cancer-associated neovascular morphologies have in fact been observed in animal models much sooner than the arrival of a tumorous mass (Li, Shan 2000). Therefore, it is not surprising that tumor angiogenesis is an important biomarker for early breast cancer detection and a predictor of the biological behavior (Gasparini and Harris 1995, Weidner, Folkman 1992, Weidner, Semple 1991).
Traditional grayscale ultrasound (US) imaging is a frequently used clinical imaging modality. The primary advantages of this modality are minimal health risks associated with patient exposure to US energy, real-time capability, and the relatively low cost associated with both examinations and system maintenance. A major advance in US imaging has been the development of intravascular microbubble (MB) contrast agents, which improve US sensitivity to slow blood flow in small vessels such as those associated with tumor angiogenesis. The ability to visualize MB contrast agents flowing through tumorous tissue using dynamic contrast-enhanced US (DCE-US) yields an opportunity to quantify select image biomarkers associated with tumor angiogenesis (Saini and Hoyt 2014). While the evaluation of tumor perfusion is well detailed in the literature, quantitative analysis of neovascular morphology from DCE-US imaging data is a relatively new development (Chang, Huang 2006, Chang, Huang 2012, Chen, Wang 2014, Eisenbrey, Joshi 2011, Gessner, Aylward 2012, Huang, Chang 2008, Lai, Huang 2013, Molinari, Mantovani 2010). Early reports have indicated that neovascular features measured from US images (e.g., number of bifurcations and vessel length) may help differentiate malignant and benign breast lesions (Eisenbrey, Joshi 2011). In this paper, we detail an image processing technique for the analysis of spatial and temporal sequences of DCE-US images to simultaneously extract data on both tumor perfusion and neovascular morphological (vessel architecture) characteristics. Collectively, US imaging biomarkers may prove useful for not only breast cancer detection, but also for sensitively monitoring early tumor response to neoadjuvant chemotherapy.
METHODOLOGY
Study protocol and data acquisition
Clinical data presented in this article was acquired between May 2006 and November 2007 as an imaging substudy to a pilot trial of preoperative (neoadjuvant) letrozole in combination with bevacizumab in postmenopausal women with newly diagnosed estrogen receptor or progesterone receptor-positive breast cancer (Forero-Torres, Saleh 2010). Note that biopsy results revealed that all breast tumors were invasive carcinomas with lobular and/or ductal features. After IRB approval and informed written consent for all patients (mean age 62.2 ± 7.0 years), tumor response to neoadjuvant therapy using DCE-US was evaluated. For this imaging substudy, patients underwent US examinations with and without contrast media within 4 weeks of initial therapy and at 6 weeks post initial therapy. After no progression was identified on conventional US, chemotherapy was continued for an additional 18 weeks. The patients underwent US and DCE-US at 6-week intervals with off-label use of Definity (perflutren lipid MBs) injectable suspension (Lantheus Medical Imaging, N Billerica, MA). For all DCE-US studies, a 0.2 to 0.4 mL (average of 0.3 mL) bolus of a 1.1 mg/mL suspension was injected at 1 mL/sec via an 18–20 gauge cannula followed by a 10 mL saline flush. US examinations were performed by a single experienced RDMS certified sonographer with a Phillips iU22 scanner (Philips Healthcare, Andover, MA) equipped with a L9-3 MHz linear array probe using a tissue-specific pulse inversion harmonic imaging preset (transmit at 4 MHz and receive at 8 MHz) and at a low mechanical index (MI = 0.07) pre and post MB contrast agent destruction via a multi-frame high MI “flash” (0.7 < MI < 0.8). Uncompressed (linear intensity) US image data in DICOM format was recorded for at least 60 sec at a frame rate of 17 Hz to capture both initial and late phases of tumor enhancement. Multiple MB contrast agent injections (range 2 to 4) and DCE-US scans were performed following a time delay of at least 20 min to allow MB clearance from the previous bolus injection. All US scanner settings were held constant for each patient and imaging session. Note that the total dosage of Definity did not exceed the total maximum dosage provided in the package insert. After completion of neoadjuvant therapy, patients underwent surgical breast cancer therapy. The resected specimens were analyzed by a blinded board certified pathologist to determine the residual cancer burden (RCB) index (Symmans, Peintinger 2007).
Image processing
The sections below detail the DCE-US image processing algorithms that were implemented using custom Matlab programs (Mathworks Inc, Natick, MA) for performing quantitative measurements of breast tumor perfusion and neovascular morphology parameters. Parallel processing of sequential algorithms was applied to help minimize computational time.
Noise suppression
This stage of image processing involves applying an ordered sequence of noise reduction procedures that preserve US image detail. Since US data was in color format (RGB), all images were first converted to grayscale by eliminating the hue and saturation information while retaining the luminance. Because US images were acquired immediately after MB contrast agent destruction, the time history of data acquisition contained a short reference period prior to MB arrival in the field-of-view (FOV). The first frame of each DCE-US dataset was used as background reference intensity with all subsequent image frames normalized by this reference (Hoyt, Warram 2010). Given sequences of normalized DCE-US images, I(m, n, t) where m and n denote mth and nth pixels for all t frames, global intensity thresholding, using an appropriate threshold value TR, was applied:
| (1) |
Note that if TR is set too low, angiogenic blood vessels contain excessive noise around the vascular edges and compromise any eventual skeletonization (i.e., neovascular thinning), which is a necessary process for extracting morphologic characteristics. Conversely, if TR is set too high, there is a risk that true low-intensity neovasculature information is filtered out (Chang, Huang 2006, Huang, Chang 2008). Based on this criterion a TR value of 50 was manually selected by an experienced researcher and applied to all image datasets used for this study.
A maximum intensity projection (MIP) was then performed along the temporal dimension to describe high-intensity neovascular structures in 2-dimensional space using the equation:
| (2) |
All connected components in the MIP images that had fewer than 75 pixels were assumed to be cluttered noise artifacts and subsequently removed (filtered). Lastly, manual segmentation was performed by an experienced researcher using a polygonal region-of-interest (ROI) to create a binary mask Ibinary(m, n) that circumscribed the tumor angiogenic blood vessel information contained in each DCE-US image.
Tumor perfusion parametric extraction
The above described binary mask that segments the tumor space was applied to each corresponding DCE-US image sequences as follows:
| (3) |
An average time-intensity curve Ī″(t) is then calculated from all nonzero spatial pixel data within the user-selected ROI:
| (4) |
where M and N denote depth and width coordinates (in pixels), respectively. This course time-intensity curve describes the kinetics of MB contrast agent flow and can be approximated as a gamma-variate function:
| (5) |
where A, α, and β are contour-controlling constants estimated using nonlinear least-squares curve fitting (Keller, Feinstein 1987). As illustrated in Figure 1, the shape of this smoothed time-intensity curve can be analyzed to extract relevant parameters of tumor perfusion, namely, peak intensity (IPK), time-to-peak intensity (TPK), area under the curve (AUC), wash-in rate (WIR), and wash-out rate (WOR). Specifically, the IPK parameter was defined as the maximum increase in signal intensity produced by bolus contrast agent injection. The TPK parameter was defined as the interval from the beginning of enhancement to the peak of the fitted curve. The AUC parameter was calculated as the time integral of the fitted curve. The WIR and WOR were calculations of the ascending and descending slopes of the fitted curve during the MB replenishment (from 10 to 90% of IPK) and dissolution phases (from IPK to curve endpoint if a wash-out phase was detected), respectively. Quality-of-fit statistics (R-square) evaluated the fit between the time-intensity curves and the gamma-variate mathematical model.
Figure 1.
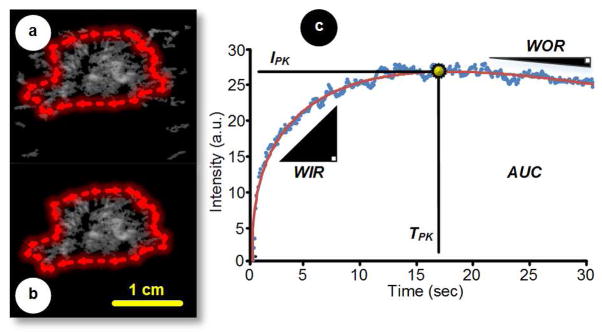
Representative dynamic contrast-enhanced ultrasound (DCE-US; maximum intensity projection, MIP) images (a) before and (b) after manual segmentation. The segmented region-of-interest (ROI) is then used as a mask to generate an (c) average time-intensity dataset from which global parametric perfusion metrics can be automatically derived, namely, peak intensity (IPK), time-to-peak intensity (TPK), area under the curve (AUC), wash-in rate (WIR), and wash-out rate (WOR). An appropriate mathematical model can be curve fit to the otherwise noisy time-intensity data to improve perfusion parameter estimation.
Neovascular skeletonization and tree construction
The process of extracting neovascular morphologic information from DCE-US imaging data begins by superimposing the binary mask created by manual segmentation of the 2-dimensional MIP image described by Eqn 2 as follows:
| (6) |
where the requisite MIP binary image for performing select morphologic operations is determined by intensity thresholding as described by Eqn 1. The neovascular network profile (foreground features) depicted in may be contaminated by intensity artifacts that create discontinuities in vessel contours. To minimize the negative impact of these imperfections on angiogenic biomarker quantification, morphological image processing of binary datasets was performed using a 3-by-3 structuring element (flat disk-shaped kernel). During this initial preprocessing step, binary images were closed then opened to suppress noise artifacts and enhance neovascular definition from the background image space (Gonzalez and Woods 2002). In practice, opening smoothes the contour of an object and eliminates any thin spurious projections. Closing also tends to smooth sections of contours but, as opposed to opening, it eliminates small holes and fills in any gaps in the foreground contour (Huang, Chang 2008). Operator pairing returns foreground image features to their original size.
Skeletonization is a dedicated process for reducing foreground regions in a binary image to a pixel-thin skeleton trace that largely preserves the extent and connectivity of the original region while discarding most of the original foreground pixels. For this study, we adopted a robust thinning algorithm to produce skeletons for tumor angiogenic blood vessels detailed in 2D binary images (Lam, Lee 1992). Skeletons were separated into different subsets whereby each connected component forms a neovascular tree. Pruning methods are an essential complement to skeletonization procedures as they can leave parasitic components (unwanted branching segments in the neovascular tree components) that need to be removed by simple post processing (Gonzalez and Woods 2002). To that end, any branch of a vascular tree that contained five or less leaf nodes was pruned. Finally, if the number of pixels in a particular component was fewer than 10 the tree was deleted and ignored from further analysis. Given the spatial dimensions of the scan-converted US image sequences and the data processing strategy adopted, only angiogenic blood vessels with length and width greater than 1 mm and 0.5 mm, respectively, were analyzed.
Neovascular morphology parametric extraction
The following section details the five neovascular morphologic parameters that were obtained by recursively traversing the neovascular trees and measuring certain key features associated with pixel connectivity. A precursory step involved counting the number of spatial pixel values equal to 1 in (i.e., foreground pixels), which was used as an estimate of the number of vascular points (VP) in the breast tumor neovascular network. The vessel-to-tissue ratio (VR) is then calculated as:
| (7) |
The number of bifurcations (NB) was found by counting each cross point (node) in every neovascular tree component where a cross point is a pixel location that has at least three neighbors. The number of vessels (NV) is determined by counting each discrete neovascular segment in the skeletonized DCE-US dataset. Here, each vessel segment S with K pixels is defined as a contour comprised of line points (exactly two pixel neighbors) terminated by end points (only one pixel neighbor); S = {S1, S2, …, SK} where Si = (mi, ni) indicates pixel location i in S. The vessel length (VL) for each segment was calculated as:
| (8) |
Lastly, vessel tortuosity (VT) associated with the same neovascular segment was quantified as follows:
| (9) |
yielding an estimate to the degree of blood vessel bending. Note that for the case of a straight vessel segment, VT = 0. Once these latter two parameters were calculated throughout the entire neovascular network, both VL and VT were summarized as average values for simplicity of reporting. All length-based morphologic values were converted to millimeters given knowledge of the US image spatial sampling rate.
Tumor perfusion information derived using Equations 4 and 5 is acceptable for describing global conditions within the user-selected ROI but local parametric perfusion information may also be desirable for certain applications. Beyond signal noise concerns, nonlinear curve fitting may be too computationally costly to estimate perfusion properties at every pixel location. As an alternative strategy, we propose an efficient computation that operates by averaging time-intensity curve data over each neovascular segment. Specifically, given the binary mask S(m, n) for a particular segment, the local time-intensity curve is given as follows:
| (10) |
After curve fitting using the gamma-variate function described by Equation 5, local parametric perfusion estimation is performed as detailed in Section 2.2.2. Each skeletonized neovascular segment can then be color-coded by these local measures to yield a parametric map detailing the spatial heterogeneity of tumor perfusion properties. To minimize noise levels such as associated with time-intensity data from short vessels, the width of each segment can be dilated (beyond the one pixel width skeletonization yields) to incorporate more time-intensity curve data in the averaging process. A summary of the image processing flowchart developed for estimating and mapping neovascular morphology features from DCE-US images is illustrated in Figure 2.
Figure 2.

Step-wise DCE-US image processing flow chart. After loading a (a) temporal sequence of DCE-US images, each frame undergoes (b) intensity thresholding to reduce the background tissue signal. (c) MIP and digital morphologic processing are then performed prior (d) manual segmentation of the tumor. To derive neovascular morphology features, the segmented MIP image is converted to a (e) binary dataset and subjected to a series of dedicated spatial filters. The tumor neovasculature is then (f) thinned to form a vessel skeleton before deleting isolated pixels and pixel clusters. Finally, neovascular morphology parameters are automatically computed, namely, vessel-to-tissue ratio (VR), number of bifurcation (NB), number of vessels (NV), vessel length (VL), and vessel tortuosity (VT) as displayed in (h). Note the (g) skeletonized image can be color-coded and overlaid on tumor neovascularity images to describe the local perfusion measures.
Statistical analysis
All data was summarized as mean ± SE when applicable. Longitudinal measurements were normalized by week 0 values and reported as percent change from baseline. Paired substudy measurements were compared using a 2-sample paired t-test. A repeated measures analysis of variance (ANOVA) test was used to test differences (i.e., temporal changes) between related means. A Pearson’s correlation test was used to compare individual tumor perfusion and neovascular morphology parameters to tumor size or RCB indices. P-values less than 0.05 were considered statistically significant. All statistical calculations were performed using JMP Pro 10 software (SAS Institute Inc, Cary NC).
RESULTS
We evaluated the use of quantitative DCE-US imaging for measuring changes in tumor perfusion and neovascular morphology in six female subjects with newly diagnosed operable breast cancer and scheduled to receive neoadjuvant therapy. Patients were imaged using US before and after MB contrast agent dosing at baseline and again at weeks 6, 12, 18, and 24 after treatment started. Surrogate measures of tumor perfusion and neovascular morphology were computed using custom software developed by our group. Briefly, tumor tissue ROIs were manually segmented from a sequence of DCE-US images and then the mean time-intensity curve describing the history of MB flow was analyzed to calculate parametric perfusion measures. Thereafter, tumor perfusion images were further processed to extract neovascular morphology features. A comparison of US images in Figure 3 suggests that human breast cancer can exhibit a high contrast perfusion profile as detailed in DCE-US acquisitions, which is due to increased angiogenic activity and neovascular growth to support tumor metabolic demands. Importantly, time-intensity curve features changed over time as the tumor responded to systemic drug treatment. When comparing substudy imaging endpoint (week 24) to baseline DCE-US-derived parametric perfusion measures, neoadjuvant therapy produced considerable changes in intratumoral blood volume (AUC and IPK metrics; −16.8 ± 4.1% and −14.8 ± 4.3%, respectively, P < 0.012) and blood flow velocity (TPK, WIR and WOR metrics; 59.3 ± 13.1%, −41.9 ± 7.2%, and −55.0 ± 11.8%, respectively, P < 0.07). As illustrated in Figure 4, spatial and temporal changes in the tumor perfusion parameters were matched by changes in the tumor neovascular network. On average for patients studied, there was a marked reduction in angiogenic blood vessel (VR and NV metrics; −26.1 ± 10.8% and −23.9 ± 12.2%, respectively, P < 0.20) and bifurcations (branch points, −27.5 ± 13.8%, P = 0.20) associated with the breast tumors along with a varied decrease in vessel tortuosity (−16.2 ± 15.7%, P = 0.53). These changes also corresponded to a slight insignificant increase in vessel length (4.4 ± 4.1%, P = 0.46) that could be due in part to pruning of the smaller angiogenic blood vessels during vascular renormalization (Jain 2013). Note that the normalization of tumor neovascularity has served as an early indication of eventual tumor size reduction and the lack of normalization has correspondingly been associated with poor therapeutic response (Bullitt, Ewend 2009, Bullitt, Lin 2007).
Figure 3.

Representative series of DCE-US images of the same breast cancer at baseline (week 0) and at weeks 6, 12, 18, and 24 after initiation of neoadjuvant chemotherapy (color-coded left to right, respectively) including select grayscale ultrasound (US) subimages (hypoechoic lesion indicated by white arrow). Time-intensity curves (and ROI variability, error bars) from each dataset are shown illustrating the progressive changes in shape that occur as the tumor changed in response to systemic drug treatment. Pathologic analyses revealed that the tumor was an invasive ductal carcinoma.
Figure 4.

Spatial maps of local perfusion parameters describing changes in the same breast tumor before (week 0) and after initiation of neoadjuvant chemotherapy (week 6, 12, 18 and 24). Note the heterogeneous spatial distribution of each perfusion parameter throughout the tumor burden.
The average (n = 6) longitudinal tumor perfusion and neovascular morphology parametric measurements are summarized in Figure 5. Second order polynomial regression lines were plotted to further highlight tumor response trends (R2 > 0.71). Inspection of parametric perfusion repeated measures indicates that intratumoral changes had occurred by the first time sample (week 6) and these changes increased with time (P < 0.39). A slightly different trend was observed in the neovascular morphology parameters. Albeit not statistically significant, longitudinal changes were also noted at week 6 but repeated measures either plateaued or regressed (P < 0.76). These patterns more closely match changes in tumor size as approximated from the grayscale US images (P = 0.07), Figure 6.
Figure 5.

Preliminary longitudinal DCE-US imaging results from a study of neoadjuvant chemotherapy in women with newly diagnosed breast cancer. Normalized data plots represent changes in summary statistics for both (a) tumor perfusion (peak intensity, IPK; time-to-peak intensity, TPK; area under the curve, AUC; wash-in rate, WIR; wash-out rate, WOR) and (b) neovascular morphology (vessel-to-tumor ratio, VR); number of bifurcation, NB); number of vessels, NV; vessel length, VL; vessel tortuosity, VT) parametric measurements. Error bars represent standard error measurements and * denotes statistical significance of data changes.
Figure 6.

Longitudinal changes in (a) breast tumor size during a study of neoadjuvant chemotherapy in women with newly diagnosed breast cancer. (b) Residual cancer burden (RCB) indices for each patient studied as determined from surgical specimens. A residual tumor indicates a partial pathologic response to neoadjuvant treatment. Error bars represent standard error measurements.
Additional statistical tests were performed to determine if either baseline or endpoint DCE-US image measurements correlated with tumor size or response to treatment as determined by the RCB indices obtained at surgery, 3.1 ± 0.4 (see Figure 6). Interestingly, baseline IPK, AUC, WIR, WOR, and VL metrics predicted tumor response (ρ > 0.82, P < 0.05); however, this observation was no longer apparent when analyzing these same tumor perfusion and neovascular morphology parameters at week 6 after start of neoadjuvant treatment (ρ < 0.56, P > 0.25). No statistically significant correlations were found between both tumor size measurements at baseline or week 24 (at completion of chemotherapy) and any of the tumor perfusion and neovascular morphology parameters (ρ < 0.82, P > 0.09). While baseline measurements of tumor size also did not correlate with treatment response (ρ = 0.63, P = 0.18), there was a positive trend towards significance when comparing tumor size measurements at week 24 (ρ = 0.82, P = 0.09). The imaging endpoint tumor size measurement is expected to correlate more favorably with tumor response as it was collected months after treatment began and since a measure of tumor size is used in part to compute the RCB index after surgery. Lastly, a final review of patient medical records (July 2013) revealed that there was no breast disease reoccurrence for all patients involved in the imaging substudy suggesting satisfactory locoregional control.
DISCUSSION
Early functional evaluations of treatments in oncology are of major importance. Several clinical studies conducted throughout the last decade have shown that DCE-US can be used to assess anticancer efficacy of systemic treatment of solid tumors. Some of the first US imaging studies in the neoadjuvant setting focused on the evaluation of vascular reducing antiangiogenic drugs in the treatment of metastatic colorectal cancer (Schirin-Sokhan, Winograd 2012), gastrointestinal stromal tumor (Lassau, Lamuraglia 2006), primary hepatocellular carcinoma (Lassau, Koscielny 2011), renal cell carcinoma (Lassau, Koscielny 2010, Williams, Hudson 2011), and melanoma (Chami, Lassau 2011). As recently reported by Lassau et al. (Lassau, Chami 2011), experience with 400 patients and 1096 DCE-US examinations revealed that tumor perfusion measurements as early as 4 weeks after antiangiogenic therapy initiation can predict tumor response at 24 weeks. It was also found that decreases in these DCE-US-derived measurements manifested before any reductions in physical tumor size (Lassau, Brule 2008, Lassau, Chami 2007, Lassau, Chami 2011). In another study involving 41 patients with pancreatic carcinoma receiving neoadjuvant chemotherapy, a considerable decrease in US- based parametric perfusion measurements was found after a single cycle of treatment (Tawada, Yamaguchi 2009), which was in accord with findings from previous clinical studies (Masaki, Ohkawa 2005, Suetomi, Kitano 2008). Similarly, neoadjuvant chemotherapy of breast cancer produced decreases in tumor perfusion as measured using DCE-US imaging (Cao, Xue 2012, Mahéo, Chevalier 2012). The above studies further support our overall findings that breast tumor response to neoadjuvant chemotherapy is characterized in part by considerable changes in intratumoral blood volume (i.e., AUC and IPK) and blood flow rate (i.e., TPK, WIR, and WOR) parameters. Moreover, our study also revealed that DCE-US-based neovascular morphology (i.e., VR, NB, NV, VL, and VT) parametric measures also exhibit pronounced changes that may be predictive of breast tumor response to systemic treatment. Collectively, DCE-US findings suggest that signature changes in tumor angiogenic biomarkers may allow a noninvasive detection of early cancer response to neoadjuvant chemotherapy.
Beyond the use of small sample size, a potential limitation of our study is that tumor angiogenic biomarkers were quantified from a single US image plane, a situation that is unlikely to accurately reflect the true (global) properties of the entire tumor under consideration. This is particularly valid for neovascular morphology features which inherently exist in 3-dimensional space. Another known limitation of planar DCE-US is that small changes in transducer position or subject motion can have profound impacts on measurement reproducibility (Feingold, Gessner 2010, Hoyt, Sorace 2012). This observation has motivated the development of 4-dimensional (3-dimensional space + time) DCE-US methods for interrogation of tumor perfusion (Chen, Wang 2014, Eisenbrey, Sridharan 2012, Hoyt, Sorace 2012, Mahoney, Sorace 2014, Sridharan, Eisenbrey 2013) and neovascular morphology (Gessner, Aylward 2012, Gessner, Frederick 2013, Molinari, Mantovani 2010) in volume space. Future work should continue the development and validation of clinically translatable high-resolution DCE-US imaging methods for more accurately quantifying tumor angiogenic biomarkers throughout an entire tumor mass. This work should include a comprehensive analysis of the tumor segmentation process and any potential biomarker measurement variability (error) from the image processing procedure. All imaging and measurements will eventually need to be standardized to help validate efficacy and further extend the preclinical and clinical use of DCE-US. Any clinical studies monitoring tumor response to systemic chemotherapy should be performed at earlier time points than we considered, such as within 1 to 2 weeks after initiation of treatment when predictive intratumoral changes are known to occur (Lassau, Chapotot 2012). Actively targeting the MB contrast agents to tumor neovascularity may also help improve angiogenic biomarker quantification given enhanced visualization of the tumor neovascular network (Saini and Hoyt 2014, Sorace, Saini 2012, Streeter, Gessner 2011, Warram, Sorace 2011).
CONCLUSIONS
Image processing algorithms for analyzing sequences of DCE-US images to extract data on both tumor perfusion and neovascular morphological features was presented. These tumor angiogenic biomarker measurements may prove useful in determining tumor response to chemotherapy in the neoadjuvant setting.
Acknowledgments
This research project was supported by NIH grant numbers P50CA89019 and K25EB017222.
Footnotes
Publisher's Disclaimer: This is a PDF file of an unedited manuscript that has been accepted for publication. As a service to our customers we are providing this early version of the manuscript. The manuscript will undergo copyediting, typesetting, and review of the resulting proof before it is published in its final citable form. Please note that during the production process errors may be discovered which could affect the content, and all legal disclaimers that apply to the journal pertain.
References
- Boudreau N, Myers C. Breast cancer-induced angiogenesis: multiple mechanisms and the role of the microenvironment. Breast Cancer Res. 2003;5:140–6. doi: 10.1186/bcr589. [DOI] [PMC free article] [PubMed] [Google Scholar]
- Bullitt E, Ewend M, Vredenburgh J, Friedman A, Lin W, Wilber K, Zeng D, Aylward SR, Reardon D. Computerized assessment of vessel morphological changes during treatment of glioblastoma multiforme: report of a case imaged serially by MRA over four years. Neuroimage. 2009;47(Suppl 2):T143–51. doi: 10.1016/j.neuroimage.2008.10.067. [DOI] [PMC free article] [PubMed] [Google Scholar]
- Bullitt E, Lin NU, Smith JK, Zeng D, Winer EP, Carey LA, Lin W, Ewend MG. Blood vessel morphologic changes depicted with MR angiography during treatment of brain metastases: a feasibility study. Radiology. 2007;245:824–30. doi: 10.1148/radiol.2453061889. [DOI] [PMC free article] [PubMed] [Google Scholar]
- Cao X, Xue J, Zhao B. Potential application value of contrast-enhanced ultrasound in neoadjuvant chemotherapy of breast cancer. Ultrasound Med Biol. 2012;38:2065–71. doi: 10.1016/j.ultrasmedbio.2012.07.027. [DOI] [PubMed] [Google Scholar]
- Chami L, Lassau N, Chebil M, Robert C. Imaging of melanoma: usefulness of ultrasonography before and after contrast injection for diagnosis and early evaluation of treatment. Clin Cosmet Investig Dermatol. 2011;4:1–6. doi: 10.2147/CCID.S13499. [DOI] [PMC free article] [PubMed] [Google Scholar]
- Chang RF, Huang SF, Moon WK, Lee YH, Chen DR. Computer algorithm for analysing breast tumor angiogenesis using 3-D power Doppler ultrasound. Ultrasound Med Biol. 2006;32:1499–508. doi: 10.1016/j.ultrasmedbio.2006.05.029. [DOI] [PubMed] [Google Scholar]
- Chang YC, Huang YH, Huang CS, Chang RF. Vascular morphology and tortuosity analysis of breast tumor inside and outside contour by 3-D power Doppler ultrasound. Ultrasound Med Biol. 2012;38:1859–69. doi: 10.1016/j.ultrasmedbio.2012.06.010. [DOI] [PubMed] [Google Scholar]
- Chen M, Wang WP, Jia WR, Tang L, Wang Y, Zhan WW, Fei XC. Three-dimensional contrast-enhanced sonography in the assessment of breast tumor angiogenesis: correlation with microvessel density and vascular endothelial growth factor expression. J Ultrasound Med. 2014;33:835–46. doi: 10.7863/ultra.33.5.835. [DOI] [PubMed] [Google Scholar]
- Eisenbrey JR, Joshi N, Dave JK, Forsberg F. Assessing algorithms for defining vascular architecture in subharmonic images of breast lesions. Phys Med Biol. 2011;56:919–30. doi: 10.1088/0031-9155/56/4/003. [DOI] [PubMed] [Google Scholar]
- Eisenbrey JR, Sridharan A, Machado P, Zhao H, Halldorsdottir VG, Dave JK, Liu JB, Park S, Dianis S, Wallace K, Thomenius KE, Forsberg F. Three-dimensional subharmonic ultrasound imaging in vitro and in vivo. Acad Radiol. 2012;19:732–9. doi: 10.1016/j.acra.2012.02.015. [DOI] [PMC free article] [PubMed] [Google Scholar]
- Feingold S, Gessner R, Guracar IM, Dayton PA. Quantitative volumetric perfusion mapping of the microvasculature using contrast ultrasound. Invest Radiol. 2010;45:669–74. doi: 10.1097/RLI.0b013e3181ef0a78. [DOI] [PMC free article] [PubMed] [Google Scholar]
- Folkman J. How is blood vessel growth regulated in normal and neoplastic tissue? G.H.A. Clowes memorial Award lecture. Cancer Res. 1986;46:467–73. [PubMed] [Google Scholar]
- Forero-Torres A, Saleh MN, Galleshaw JA, Jones CF, Shah JJ, Percent IJ, Nabell LM, Carpenter JT, Falkson CI, Krontiras H, Urist MM, Bland KI, De Los Santos JF, Meredith RF, Caterinicchia V, Bernreuter WK, O’Malley JP, Li Y, LoBuglio AF. Pilot trial of preoperative (neoadjuvant) letrozole in combination with bevacizumab in postmenopausal women with newly diagnosed estrogen receptor- or progesterone receptor-positive breast cancer. Clin Breast Cancer. 2010;10:275–80. doi: 10.3816/CBC.2010.n.035. [DOI] [PMC free article] [PubMed] [Google Scholar]
- Gasparini G, Harris AL. Clinical importance of the determination of tumor angiogenesis in breast carcinoma: much more than a new prognostic tool. J Clin Oncol. 1995;13:765–82. doi: 10.1200/JCO.1995.13.3.765. [DOI] [PubMed] [Google Scholar]
- Gessner RC, Aylward SR, Dayton PA. Mapping microvasculature with acoustic angiography yields quantifiable differences between healthy and tumor-bearing tissue volumes in a rodent model. Radiology. 2012;264:733–40. doi: 10.1148/radiol.12112000. [DOI] [PMC free article] [PubMed] [Google Scholar]
- Gessner RC, Frederick CB, Foster FS, Dayton PA. Acoustic angiography: a new imaging modality for assessing microvasculature architecture. Int J Biomed Imaging. 2013:936593. doi: 10.1155/2013/936593. [DOI] [PMC free article] [PubMed] [Google Scholar]
- Gonzalez RC, Woods RE. Digital image processing. Delhi, India: Pearson Education; 2002. [Google Scholar]
- Graham LJ, Shupe MP, Schneble EJ, Flynt FL, Clemenshaw MN, Kirkpatrick AD, Gallagher C, Nissan A, Henry L, Stojadinovic A, Peoples GE, Shumway NM. Current Approaches and Challenges in Monitoring Treatment Responses in Breast Cancer. J Cancer. 2014;5:58–68. doi: 10.7150/jca.7047. [DOI] [PMC free article] [PubMed] [Google Scholar]
- Hoyt K, Sorace A, Saini R. Quantitative mapping of tumor vascularity using volumetric contrast-enhanced ultrasound. Invest Radiol. 2012;47:167–74. doi: 10.1097/RLI.0b013e318234e6bc. [DOI] [PMC free article] [PubMed] [Google Scholar]
- Hoyt K, Sorace A, Saini R. Volumetric contrast-enhanced ultrasound imaging to assess early response to apoptosis-inducing anti-death receptor 5 antibody therapy in a breast cancer animal model. J Ultrasound Med. 2012;31:1759–66. doi: 10.7863/jum.2012.31.11.1759. [DOI] [PMC free article] [PubMed] [Google Scholar]
- Hoyt K, Warram JM, Umphrey H, Belt L, Lockhart ME, Robbin ML, Zinn KR. Determination of breast cancer response to bevacizumab therapy using contrast-enhanced ultrasound and artificial neural networks. J Ultrasound Med. 2010;29:577–85. doi: 10.7863/jum.2010.29.4.577. [DOI] [PMC free article] [PubMed] [Google Scholar]
- Huang SF, Chang RF, Moon WK, Lee YH, Chen DR, Suri JS. Analysis of tumor vascularity using three-dimensional power Doppler ultrasound images. IEEE Trans Med Imaging. 2008;27:320–30. doi: 10.1109/TMI.2007.904665. [DOI] [PubMed] [Google Scholar]
- Jain RK. Determinants of tumor blood flow: a review. Cancer Res. 1988;48:2641–58. [PubMed] [Google Scholar]
- Jain RK. Normalizing Tumor Microenvironment to Treat Cancer: Bench to Bedside to Biomarkers. J Clin Oncol. 2013;10:2205–18. doi: 10.1200/JCO.2012.46.3653. [DOI] [PMC free article] [PubMed] [Google Scholar]
- Keller MW, Feinstein SB, Watson DD. Successful left ventricular opacification following peripheral venous injection of sonicated contrast agent: an experimental evaluation. Am Heart J. 1987;114:570–5. doi: 10.1016/0002-8703(87)90754-x. [DOI] [PubMed] [Google Scholar]
- Lai YC, Huang YS, Wang DW, Tiu CM, Chou YH, Chang RF. Computer-aided diagnosis for 3-d power Doppler breast ultrasound. Ultrasound Med Biol. 2013;39:555–67. doi: 10.1016/j.ultrasmedbio.2012.09.020. [DOI] [PubMed] [Google Scholar]
- Lam L, Lee S-W, Suen C. Thinning methodologies - A comprehensive survey. IEEE Trans Pattern Anal Mach Intell. 1992;14:869–85. [Google Scholar]
- Lassau N, Brule A, Chami L, Benatsou B, Péronneau P, Roche A. Evaluation of early response to antiangiogenic treatment with dynamic contrast enhanced ultrasound. J Radiol. 2008;89:549–55. doi: 10.1016/s0221-0363(08)71480-x. [DOI] [PubMed] [Google Scholar]
- Lassau N, Chami L, Benatsou B, Peronneau P, Roche A. Dynamic contrast-enhanced ultrasonography (DCE-US) with quantification of tumor perfusion: a new diagnostic tool to evaluate the early effects of antiangiogenic treatment. Eur Radiol. 2007;17(Suppl 6):F89–98. doi: 10.1007/s10406-007-0233-6. [DOI] [PubMed] [Google Scholar]
- Lassau N, Chami L, Chebil M, Benatsou B, Bidault S, Girard E, Abboud G, Roche A. Dynamic contrast-enhanced ultrasonography (DCE-US) and anti-angiogenic treatments. Discov Med. 2011;11:18–24. [PubMed] [Google Scholar]
- Lassau N, Chapotot L, Benatsou B, Vilgrain V, Kind M, Lacroix J, Cuinet M, Taieb S, Aziza R, Sarran A, Labbe C, Gallix B, Lucidarme O, Ptak Y, Rocher L, Caquot LM, Chagnon S, Marion D, Luciani A, Uzan-Augui J, Koscielny S. Standardization of dynamic contrast-enhanced ultrasound for the evaluation of antiangiogenic therapies: the French multicenter Support for Innovative and Expensive Techniques Study. Invest Radiol. 2012;47:711–6. doi: 10.1097/RLI.0b013e31826dc255. [DOI] [PubMed] [Google Scholar]
- Lassau N, Koscielny S, Albiges L, Chami L, Benatsou B, Chebil M, Roche A, Escudier BJ. Metastatic renal cell carcinoma treated with sunitinib: early evaluation of treatment response using dynamic contrast-enhanced ultrasonography. Clin Cancer Res. 2010;16:1216–25. doi: 10.1158/1078-0432.CCR-09-2175. [DOI] [PubMed] [Google Scholar]
- Lassau N, Koscielny S, Chami L, Chebil M, Benatsou B, Roche A, Ducreux M, Malka D, Boige V. Advanced hepatocellular carcinoma: early evaluation of response to bevacizumab therapy at dynamic contrast-enhanced US with quantification--preliminary results. Radiology. 2011;258:291–300. doi: 10.1148/radiol.10091870. [DOI] [PubMed] [Google Scholar]
- Lassau N, Lamuraglia M, Chami L, Leclère J, Bonvalot S, Terrier P, Roche A, Le Cesne A. Gastrointestinal stromal tumors treated with imatinib: monitoring response with contrast-enhanced sonography. AJR Am J Roentgenol. 2006;187:1267–73. doi: 10.2214/AJR.05.1192. [DOI] [PubMed] [Google Scholar]
- Li CY, Shan S, Huang Q, Braun RD, Lanzen J, Hu K, Lin P, Dewhirst MW. Initial stages of tumor cell-induced angiogenesis: evaluation via skin window chambers in rodent models. J Natl Cancer Inst. 2000;92:143–7. doi: 10.1093/jnci/92.2.143. [DOI] [PubMed] [Google Scholar]
- Mahoney M, Sorace A, Warram J, Samuel S, Hoyt K. Volumetric contrast-enhanced ultrasound imaging of renal perfusion. J Ultrasound Med. 2014;33:1427–37. doi: 10.7863/ultra.33.8.1427. [DOI] [PMC free article] [PubMed] [Google Scholar]
- Mahéo K, Chevalier S, Vibet S, Bougnoux P, Richard S, Serrière S, Bleuzen A, Tranquart F, Goupille C. Non-invasive quantification of tumor vascular architecture during docetaxel-chemotherapy. Breast Cancer Res Treat. 2012;134:1013–25. doi: 10.1007/s10549-012-2015-7. [DOI] [PubMed] [Google Scholar]
- Masaki T, Ohkawa S, Amano A, Ueno M, Miyakawa K, Tarao K. Noninvasive assessment of tumor vascularity by contrast-enhanced ultrasonography and the prognosis of patients with nonresectable pancreatic carcinoma. Cancer. 2005;103:1026–35. doi: 10.1002/cncr.20875. [DOI] [PubMed] [Google Scholar]
- Molinari F, Mantovani A, Deandrea M, Limone P, Garberoglio R, Suri JS. Characterization of single thyroid nodules by contrast-enhanced 3-D ultrasound. Ultrasound Med Biol. 2010;36:1616–25. doi: 10.1016/j.ultrasmedbio.2010.07.011. [DOI] [PubMed] [Google Scholar]
- Saini R, Hoyt K. Recent developments in dynamic contrast-enhanced ultrasound imaging of tumor angiogenesis. Imaging Med. 2014;6:41–52. doi: 10.2217/iim.13.74. [DOI] [PMC free article] [PubMed] [Google Scholar]
- Schirin-Sokhan R, Winograd R, Roderburg C, Bubenzer J, do Ó NC, Guggenberger D, Hecker H, Trautwein C, Tischendorf JJ. Response evaluation of chemotherapy in metastatic colorectal cancer by contrast enhanced ultrasound. World J Gastroenterol. 2012;18:541–5. doi: 10.3748/wjg.v18.i6.541. [DOI] [PMC free article] [PubMed] [Google Scholar]
- Siegel R, Naishadham D, Jemal A. Cancer statistics, 2013. CA Cancer J Clin. 2013;63:11–30. doi: 10.3322/caac.21166. [DOI] [PubMed] [Google Scholar]
- Sorace AG, Saini R, Mahoney M, Hoyt K. Molecular ultrasound imaging using a targeted contrast agent for assessing early tumor response to antiangiogenic therapy. J Ultrasound Med. 2012;31:1543–50. doi: 10.7863/jum.2012.31.10.1543. [DOI] [PMC free article] [PubMed] [Google Scholar]
- Sridharan A, Eisenbrey JR, Liu JB, Machado P, Halldorsdottir VG, Dave JK, Zhao H, He Y, Park S, Dianis S, Wallace K, Thomenius KE, Forsberg F. Perfusion Estimation Using Contrast-Enhanced 3-dimensional Subharmonic Ultrasound Imaging: An In Vivo Study. Invest Radiol. 2013;48:654–60. doi: 10.1097/RLI.0b013e3182925160. [DOI] [PMC free article] [PubMed] [Google Scholar]
- Streeter JE, Gessner RC, Tsuruta J, Feingold S, Dayton PA. Assessment of molecular imaging of angiogenesis with three-dimensional ultrasonography. Mol Imaging. 2011;10:460–8. [PMC free article] [PubMed] [Google Scholar]
- Suetomi Y, Kitano M, Kudo M, Sakamoto H, Maekawa K. Evaluation of therapeutic response to gemcitabine in pancreatic cancer. Hepatogastroenterology. 2008;55:1785–8. [PubMed] [Google Scholar]
- Symmans WF, Peintinger F, Hatzis C, Rajan R, Kuerer H, Valero V, Assad L, Poniecka A, Hennessy B, Green M, Buzdar AU, Singletary SE, Hortobagyi GN, Pusztai L. Measurement of residual breast cancer burden to predict survival after neoadjuvant chemotherapy. J Clin Oncol. 2007;25:4414–22. doi: 10.1200/JCO.2007.10.6823. [DOI] [PubMed] [Google Scholar]
- Tawada K, Yamaguchi T, Kobayashi A, Ishihara T, Sudo K, Nakamura K, Hara T, Denda T, Matsuyama M, Yokosuka O. Changes in tumor vascularity depicted by contrast-enhanced ultrasonography as a predictor of chemotherapeutic effect in patients with unresectable pancreatic cancer. Pancreas. 2009;38:30–5. doi: 10.1097/mpa.0b013e318183ff73. [DOI] [PubMed] [Google Scholar]
- Warram JM, Sorace AG, Saini R, Umphrey HR, Zinn KR, Hoyt K. A triple-targeted ultrasound contrast agent provides improved localization to tumor vasculature. J Ultrasound Med. 2011;30:921–31. doi: 10.7863/jum.2011.30.7.921. [DOI] [PMC free article] [PubMed] [Google Scholar]
- Weidner N, Folkman J, Pozza F, Bevilacqua P, Allred EN, Moore DH, Meli S, Gasparini G. Tumor angiogenesis: a new significant and independent prognostic indicator in early-stage breast carcinoma. J Natl Cancer Inst. 1992;84:1875–87. doi: 10.1093/jnci/84.24.1875. [DOI] [PubMed] [Google Scholar]
- Weidner N, Semple JP, Welch WR, Folkman J. Tumor angiogenesis and metastasis--correlation in invasive breast carcinoma. N Engl J Med. 1991;324:1–8. doi: 10.1056/NEJM199101033240101. [DOI] [PubMed] [Google Scholar]
- Weind KL, Maier CF, Rutt BK, Moussa M. Invasive carcinomas and fibroadenomas of the breast: comparison of microvessel distributions--implications for imaging modalities. Radiology. 1998;208:477–83. doi: 10.1148/radiology.208.2.9680579. [DOI] [PubMed] [Google Scholar]
- Williams R, Hudson JM, Lloyd BA, Sureshkumar AR, Lueck G, Milot L, Atri M, Bjarnason GA, Burns PN. Dynamic microbubble contrast-enhanced US to measure tumor response to targeted therapy: a proposed clinical protocol with results from renal cell carcinoma patients receiving antiangiogenic therapy. Radiology. 2011;260:581–90. doi: 10.1148/radiol.11101893. [DOI] [PubMed] [Google Scholar]