

Abstract
TNFAIP3 encodes aubiquitin-modifying protein, A20, that is a critical regulator of inflammatory responses. TNFAIP3 polymorphisms are associated with susceptibility to multiple autoimmune diseases including psoriasis, systemic lupus erythematosus, rheumatoid arthritis, systemic sclerosis, and celiac disease. In order to refine the TNFAIP3 association signal in psoriasis and identify candidate causal variants, we performed imputation and meta-analysis of the TNFAIP3 region in five European ancestry cohorts totaling 4,704 psoriasis cases and 7,805 controls. We identified 49 variants whose significance exceeded a corrected Bonferroni threshold, with the top variant being rs582757 (P = 6.07 × 10⁻¹², OR = 1.23). Conditional analysis revealed a suggestive independent association at rs6918329 (Pcond = 7.22 × 10⁻⁵, OR=1.15). Functional annotation of the top variants identified several with strong evidence of regulatory potential and several within long non-coding RNAs. Analysis of TNFAIP3 haplotypes revealed that the psoriasis risk haplotype is distinct from other autoimmune diseases. Overall, our findings identify novel candidate causal variants of TNFAIP3 in psoriasis and highlight the complex genetic architecture of this locus in autoimmune susceptibility.
Introduction
Psoriasis is an autoimmune inflammatory skin disorder which ranges in severity from isolated scaling erythematosus plaques on the joints or scalp to almost complete coverage of the skin’s surface. A worldwide prevalence of 2–4% has been reported with higher prevalence rates in populations of European descent and populations in higher latitudes. Currently, 40 independent loci are associated with the development of psoriasis.2 Psoriasis susceptibility shares genetic overlap with several other autoimmune diseases such as Crohn’s disease.3
One of the most robust psoriasis associations is with a region harboring the gene for tumor necrosis factor alpha inducible protein 3 (TNFAIP3). This is of high interest because variants in TNFAIP3 are also associated with susceptibility to systemic lupus erythematosus (SLE),4, 5 rheumatoid arthritis (RA),6 systemic sclerosis (SSc),7 and celiac disease (CD).8 TNFAIP3 encodes the A20 protein, which downregulates inflammation by restricting NF-kB pathway signaling downstream of tumor necrosis factor receptor 1, CD40, toll-like receptors, NOD-like receptors, and the interleukin-1 receptor.9 A20 deficient mice develop a severe autoimmune phenotype with organ inflammation, cachexia, and premature death.10 As TNFAIP3 may serve as a master regulator of autoimmunity, identifying the causal genetic variants associated with autoimmune diseases is of prime interest.
In the initial psoriasis GWA studies, the intronic TNFAIP3 SNP rs610604 was the most significantly associated variant identified.11 However, whether rs610604 is the causal variant was unknown. To further refine the susceptibility signals in psoriasis and to identify potential functional variants in the TNFAIP3 region, we performed imputation and meta-analysis of five case-control psoriasis cohorts, three of which were used in previously published GWAS. Our large fine-mapping study of the TNFAIP3 region in psoriasis included a total of 4,704 cases and 7,805 controls.
Results
Association Testing
We performed a meta-analysis of the TNFAIP3 region, encompassing TNFAIP3 ± 250 kb, in five European ancestry psoriasis cohorts totaling 4,704 cases and 7,805 controls (Table 1). We optimized the density and accuracy of SNP imputation using a combined reference panel from the Division of Cancer Epidemiology and Genetics (DCEG)12 and 1000 Genomes phase 3resulting in 3,815variants that were analyzed (Supplementary Table 1). Association testing identified 43 variants whose significance exceeded a strict Bonferroni threshold of P< 1.3 × 10⁻⁵ (Table 2) and 49 variants whose significance exceeded an adjusted Bonferroni threshold of P < 5.3 × 10⁻⁵ that accounts for the linkage disequilibrium between nearby SNPs (see Materials and Methods). The most significant variant using a random-effects model was rs582757 (p =6.07 × 10⁻¹², odds ratio (OR) = 1.23), which is located within an intron of TNFAIP3 (Figure 1A). This SNP is as significantly associated with psoriasis riskas the lead SNP reported in several previous GWA studies, rs610604 (p = 8.13 × 10⁻¹², OR = 1.22).11, 13
Table 1.
Description of studies following quality control measures
| Platform | Number of SNPs genotyped in TNFAIP3 region | Population | Region | Cases | Controls | Samples |
|---|---|---|---|---|---|---|
| Illumina 317K29 | 72 | North American | Texas, California, New York | 197 | 500 | 697 |
| Perlegen 400K11 | 107 | North American | Michigan, Utah, St. Louis | 1331 | 1354 | 2685 |
| Illumina 550K | 120 | Swedish | Sweden | 725 | 438 | 1163 |
| Illumina 660Quad/1.2M | 112 | United | London, Manchester, | 2178 | 5175 | 7353 |
| Duo*13 | Kingdom | Dublin (IRE), Sheffield, Glasgow | ||||
| Illumina Golden Gate | 68 | North American | California, Missouri | 273 | 338 | 611 |
|
| ||||||
| total | 4704 | 7805 | 12509 | |||
Cases were typed on 660W Quad and controls were typed on 1.2 mil. This dataset represents the overlap of SNPs which is 519K.
Table 2.
List of 43 variants associated with psoriasis exceeding Bonferroni significance (p<1.3 × 10⁻⁵)
| SNP | Position | Minor allele | Major allele | OR (95% CI) | P-value | Het* | RegDB score | Regulome Score details | Comments |
|---|---|---|---|---|---|---|---|---|---|
| chr6:138151315:D A,B,C | 138151315 | T | TCA | 1.21 (1.13 – 1.28) | 4.36E-08 | 0.8 | N/A | In top g was sig cluster | |
| rs7746779B | 138154501 | G | A | 1.20 (1.13 – 1.28) | 6.53E-08 | 0.9 | 6 | ||
| rs56232106B | 138156122 | C | A | 1.21 (1.13 – 1.29) | 5.59E-08 | 0.8 | 6 | ||
| rs57163170B | 138157308 | A | T | 1.21 (1.13 – 1.29) | 2.89E-08 | 0.8 | |||
| rs9494879A,B | 138159432 | C | T | 1.15 (1.08 – 1.21) | 4.73E-06 | 0.8 | 2c | TF binding + matched TF motif + Dnase peak | In LD with rs6918329 & high RegDB score |
| rs55847703B | 138159576 | C | T | 1.21 (1.13 – 1.29) | 2.74E-08 | 0.8 | |||
| rs11964456B | 138160065 | A | G | 1.15 (1.09 – 1.21) | 4.01E-06 | 0.8 | 5 | ||
| rs111355666A,B | 138160322 | T | C | 1.21 (1.13 – 1.29) | 3.09E-08 | 0.8 | 3a | TF binding + any motif + Dnase peak | Highly significant results in 1st pass and high RegDB score |
| rs56078247B | 138160790 | A | C | 1.21 (1.13 – 1.29) | 3.02E-08 | 0.8 | |||
| rs6918329A,B | 138161013 | G | A | 1.15 (1.09 – 1.22) | 3.20E-06 | 0.8 | 6 | Motif hit | Top SNP after 1st round of conditional analysis |
| rs1836846B | 138166068 | G | C | 1.15 (1.09 – 1.22) | 3.45E-06 | 0.8 | 5 | ||
| rs583522B | 138189884 | C | T | 1.23 (1.16 – 1.3) | 1.47E-11 | 0.5 | 4 | ||
| chr6:138190118:D | 138190118 | TAA | T | 1.18 (1.11 – 1.25) | 6.62E-09 | 0.5 | |||
| rs629953 | 138195041 | A | G | 1.19 (1.12 – 1.25) | 3.95E-09 | 0.5 | 5 | ||
| rs598493A | 138195402 | T | C | 1.23 (1.16 – 1.3) | 7.84E-12 | 0.5 | 3a | TF binding + any motif + Dnase peak | Lowest p-val with highest RegDB score |
| rs643177 | 138195693 | T | C | 1.23 (1.16 – 1.3) | 8.10E-12 | 0.4 | 4 | ||
| chr6:138195961:D | 138195961 | TCTC | T | 1.19 (1.12 – 1.25) | 7.11E-09 | 0.6 | |||
| rs661561 | 138197331 | A | C | 1.19 (1.12 – 1.25) | 2.87E-09 | 0.5 | 7 | ||
| rs582757A | 138197824 | C | T | 1.23 (1.16 – 1.3) | 6.07E-12 | 0.5 | 5 | TF binding or DNase peak | Top SNP in meta-analysis |
| rs610604A | 138199417 | G | T | 1.22 (1.15 – 1.28) | 8.13E-12 | 0.8 | 4 | TF binding + DNase peak | Published index SNP in psoriasis |
| rs642627 | 138206783 | A | G | 1.23 (1.16 – 1.3) | 1.97E-11 | 0.5 | 6 | ||
| rs622091 | 138207042 | C | T | 1.22 (1.15 – 1.28) | 2.89E-11 | 0.7 | |||
| rs1082428 | 138207729 | C | G | 1.22 (1.15 – 1.28) | 1.15E-11 | 0.7 | 7 | ||
| rs603904 | 138209785 | G | A | 1.19 (1.12 – 1.25) | 4.09E-09 | 0.4 | 7 | ||
| rs1082425 | 138210537 | C | T | 1.22 (1.15 – 1.28) | 1.22E-11 | 0.7 | 6 | ||
| rs601035A,C | 138212720 | A | G | 1.19 (1.12 – 1.25) | 2.68E-09 | 0.4 | 7 | No data | In top g was sig cluster |
| rs612217 | 138212961 | A | G | 1.23 (1.16 – 1.3) | 1.27E-11 | 0.5 | 7 | ||
| rs593622 | 138215354 | C | T | 1.19 (1.12 – 1.25) | 2.48E-09 | 0.4 | 7 | ||
| rs592810 | 138215516 | C | T | 1.19 (1.12 – 1.25) | 2.43E-09 | 0.4 | |||
| rs644340 | 138215574 | G | A | 1.19 (1.12 – 1.25) | 2.49E-09 | 0.4 | 7 | ||
| rs674451 | 138216788 | C | T | 1.22 (1.15 – 1.29) | 1.29E-11 | 0.6 | 7 | ||
| rs67543742 | 138219168 | G | A | 1.18 (1.11 – 1.26) | 4.52E-07 | 0.6 | 6 | ||
| rs9321634 | 138222510 | G | T | 1.18 (1.11 – 1.25) | 9.71E-08 | 0.4 | 7 | ||
| rs4896301 | 138227102 | A | G | 1.18 (1.11 – 1.26) | 1.77E-07 | 0.3 | 6 | ||
| rs1561121A,C | 138229819 | A | C | 1.18 (1.11 – 1.25) | 1.43E-07 | 0.4 | 5 | TF binding or DNase peak | In top g was sig cluster |
| rs6570193 | 138231107 | G | A | 1.18 (1.11 – 1.26) | 1.90E-07 | 0.4 | 4 | ||
| rs6903624 | 138232479 | A | T | 1.18 (1.11 – 1.26) | 9.89E-08 | 0.4 | 5 | ||
| rs4896303 | 138234085 | C | G | 1.19 (1.11 – 1.26) | 2.75E-07 | 0.3 | 6 | ||
| rs4895498 | 138236977 | C | T | 1.22 (1.15 – 1.29) | 1.70E-10 | 0.5 | 5 | ||
| rs6933987 | 138239434 | T | C | 1.22 (1.15 – 1.29) | 2.06E-10 | 0.5 | 7 | ||
| rs6909442 | 138242487 | G | C | 1.21 (1.13 – 1.31) | 2.27E-07 | 0.3 | 7 | ||
| chr6:138242623:D | 138242623 | A | ATAAAT | 1.21 (1.14 – 1.28) | 2.68E-09 | 0.5 | |||
| rs67297943 | 138244816 | C | T | 1.18 (1.11 – 1.26) | 2.50E-06 | 0.6 | 7 |
Variant of interest is boldfaced either because of functional evidence or a top variant after conditional analysis.
Variant overlaps with 44 kb lnc RNALOC 100130476.
Variant overlaps with linc RNA transcript.
p-value for Cochrane’s Q
Figure 1. Association plots of psoriasis meta-analysis and conditional analysis in the TNFAIP3 region from 138.0Mb to 138.3Mb.
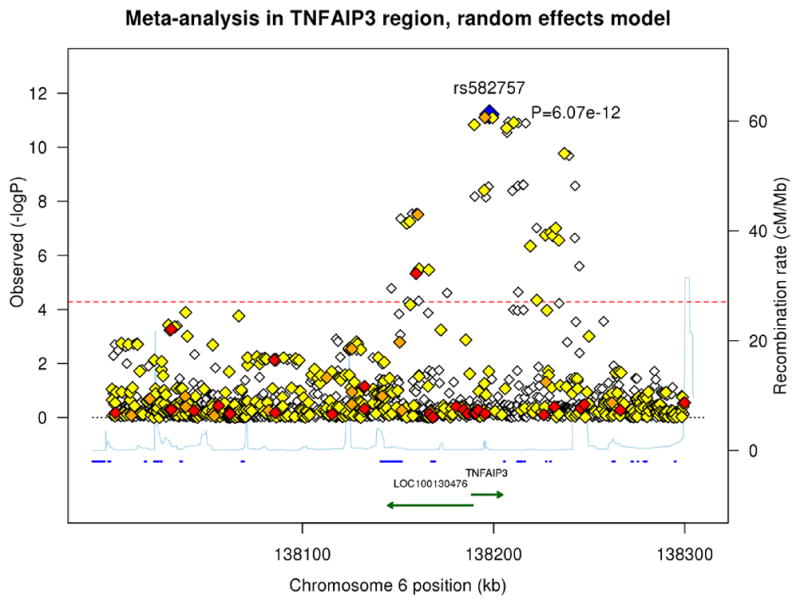
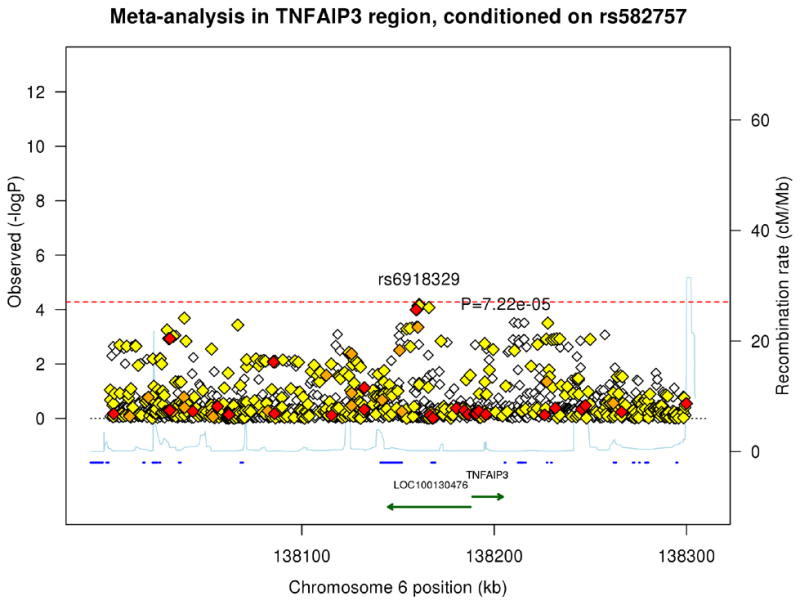

The blue diamond represents the top SNP from each analysis. The red, orange, and yellow colors represent the RegulomeDB categories of likely functionality: red (2a–2c), orange (3a–3b) and yellow (4–6). (A) Meta-analysis using a random effects model. (B) Meta-analysis conditioning on the top signal rs582757. (C) Meta-analysis conditioning on the top two signals rs582757 and rs6918329.
To identify potential additional independent signals in the TNFAIP3 region, we performed conditional association testing. After conditioning on the top variant, rs582757, the most significant SNP was rs6918329 (pcond=7.22 × 10⁻⁵, OR=1.15), whose p-value was very close to the adjusted Bonferroni significance threshold (Figure 1B). This SNP is located approximately 35 kb upstream of the TNFAIP3 mRNA start site. Conditioning on the top two SNPs, rs582757 and rs6918329, yielded residual peaks that did not cross the adjusted Bonferroni threshold (Figure 1C). The meta-analysis and conditional testing was also performed using a fixed-effects model but the results did not differ greatly from the random-effects model. We report the results of the random-effects model as it is more conservative since it does not assume the same effect size across studies.14
Identification of Candidate Causal Variants
We cross-referenced top SNPs exceeding Bonferroni significance in the TNFAIP3 region (Table 2) with a variety of bioinformatics databases to identify SNPs with evidence of functionality. We utilized RegulomeDB, 15 a database that pools functional data from sources such as the Encyclopedia of DNA Elements (ENCODE), manual annotations, and experimental datasets including DNase-seq, DNase footprinting, transcription factor ChIP-seq, histone ChIP-seq, expression quantitative trait loci analyses, DNase I sensitivity QTLs analyses, ChIP-exo data, and validated enhancer regions. RegulomeDB contains over 60 million annotations derived from 962 experimental datasets and for any queried SNP computes a prediction score from 1 to 6 for evidence of functional significance, with a score of 1 indicating the highest evidence of functionality, 6 indicating the least evidence, and 7 indicating that no data is available. We also evaluated our top TNFAIP3 SNPs using a newly developed metric for variant pathogenicity16 and an expanded database17 containing the positions of long non-coding RNAs (lncRNAs), as variants within such lncRNAs could impact lncRNA function.18 Finally, we examined our SNPs for evidence of evolutionary conservation.
We first used RegulomeDB to examine SNPs in high LD with our most highly associated SNP, rs582757, which we refer to as “Signal 1”. rs582757 itself had a RegulomeDB score of 5, which corresponds to minimal evidence of transcription factor binding. However, rs598493, a SNP in nearly perfect LD with rs582757 (r2=0.99), had a RegulomeDB score of 3a, which corresponds to empiric evidence of transcription factor (TF) binding to NFKB1, IRF4, and SMARCA4, location within a TF DNA binding motif, and location within a region of DNase hypersensitivity (Table 2). Interestingly, the previously reported lead GWAS SNP, rs610604, was also in high LD with rs582757 (r2=0.80) and had a RegulomeDB score of 4, corresponding to evidence of TF binding plus location within a region of DNase hypersensitivity.
We next examined SNPs in high LD with rs6918329 (“Signal 2”), the most highly associated SNP after conditioning on rs582757. Although rs6918329 itself showed little evidence of regulatory function (RegulomeDB score of 6), rs9494879, a SNP in perfect LD (r2=1.0) with rs6918329, had a RegulomeDB score of 2c, indicating high likelihood of regulatory function (Table 2). This SNP has been shown to be a TF binding site for the proteins FOXA1, FOXA2, CDX2, and HNF4A through ChIP-seq and contains a matched TF motif and DNase hypersensitivity peak.19, 20 rs9494879 is located within a large 44 kb long non-coding RNA, LOC100130476 (Figures 1A–C), whose function is not known and which is in close proximity to TNFAIP3. Thus, rs9494879 could potentially regulate TNFAIP3, LOC100130476, or both.
We also identified several SNPs in moderate LD (r2 = 0.5 to 0.7) with both Signal 1 and Signal 2 that had significant p-values and displayed functional potential. Three SNPs—rs601035 (p =2.68 × 10⁻⁹), rs1561121 (p = 1.43 × 10⁻⁷), and the dinucleotide deletion chr6:138151315 (p = 4.36 × 10⁻⁸)—were found to be located within long intergenic non-coding RNAs17 in the TNFAIP3 region. Another SNP, rs111355666 (p = 3.09 × 10⁻⁸), was also in moderate LD with both Signal 1 and Signal 2 and had a RegulomeDB score of 3a, due to potential SPI1 binding, location within a TF binding motif, and location within a DNase hypersensitive region. Recently, the Combined Annotation-Dependent Depletion (CADD) method16 has been developed to estimate the relative deleteriousness of genetic variants according to a C-score, with a larger C-score indicative of higher pathogenic potential. Two variants among our highly associated variants, rs629953 (p = 3.95 × 10⁻⁹) and chr6:138195961:D (p = 7.11 × 10⁻⁹), both in moderate LD with Signal 1 and Signal 2, displayed a C-score > 10.0 indicative of possible functionality (Supplementary Table 2). Finally, we also examined our top variants for conservation across mammalian species using phast Cons scores but this did not reveal any evidence of high conservation of these sequences.
All together, we have identified a number of SNPs in the TNFAIP3 region with dual evidence of significant statistical association with psoriasis and evidence of potential functionality. These SNPs serve as candidate causal SNPs for psoriasis in the TNFAIP3 region.
Haplotype Analysis
Haplotype analysis of the top two independent risk variants, rs582757 and rs6918329, identified four main haplotypes present within the European population (Figure 2). H2, the most detrimental risk haplotype containing the minor alleles of both SNPs, had a frequency of 23% in the European population and conferred a psoriasis odds ratio of 1.23. Haplotype H4, containing the minor allele of rs582757 but major allele of rs6918329, had a frequency of 8% and conferred a psoriasis odds ratio of 1.16.
Figure 2. Haplotype analysis of the top 2 SNPs from conditional analysis.

(A) Shaded boxes represent the minor allele. (B) An LD plot shows that with an r2 of 0.29 and D′=0.58, the top two SNPs are not in strong LD with each other.
To determine the relationship between the TNFAIP3 psoriasis risk haplotypes identified in this study and the TNFAIP3 risk haplotypes identified in other autoimmune diseases, we examined previously published TNFAIP3 risk haplotypes associated with SLE, RA, SSc, and CD (Table 3). The SLE risk haplotype is tagged by the minor alleles of the two variants, rs5029939(G) - rs2230926(G), and confers an OR in SLE of 1.71, p=8.7×10−10.4 Surprisingly, when we examined the SLE risk haplotype in our psoriasis dataset, we found that the SLE risk haplotype conferred a protective effect in psoriasis (OR=0.81, 95% CI 0.70–0.95, p=0.0068). Similarly, as SLE and SSc share several risk SNPs, the SSc haplotype (OR=2.88, p=2.63×10⁻⁶ in SSc) also conferred protection in psoriasis (OR=0.8, p=0.007).7 When we examined four RA haplotypes (RA1-RA4) in psoriasis, we found that risk or protection in RA did not confer similar risk or protection in psoriasis.6 As in RA, the SNP associated with risk in CD, rs2327832(G), did not confer risk in psoriasis.8 Thus, none of the TNFAIP3 risk haplotypes in four other autoimmune diseases conferred risk of psoriasis, and in some cases, appeared to confer protection against psoriasis.
Table 3.
TNFAIP3 risk in psoriasis and other autoimmune diseases (AID)
| Disease | Haplotype/SNP | OR in AID | P-value in other AID | Risk direction in other AID | OR in psoriasis | P-value in psoriasis | Risk direction in psoriasis |
|---|---|---|---|---|---|---|---|
| SLE4 | rs5029339(G) - rs2230926(G) | 1.71 | 8.71 × 10⁻¹⁰ | risk | 0.81 | 0.0068 | protective |
| RA-16 | rs1878658(A) - rs675520(A) - rs9376293(T) - rs10499194(C)-rs6920220(A) | 1.22 | 1.0 × 10⁻⁷ | risk | 0.99 | 0.7 | neutral |
| RA-26 | rs1878658(A) - rs675520(A) - rs9376293(T) - rs10499194(C)-rs6920220(G) | 1.00 | 0.74 | neutral | 0.93 | 0.023 | protective |
| RA-36 | rs1878658(A) - rs675520(G) - rs9376293(C) - rs10499194(C)-rs6920220(G) | 1.05 | 0.53 | neutral | 1.11 | 0.01 | risk |
| RA-46 | rs1878658(G) - rs675520(G) - rs9376293(C) - rs10499194(T)-rs6920220(G) | 0.80 | 3.0 × 10⁻⁷ | protective | 1.04 | 0.24 | neutral |
| Celiac Disease8 | rs2327832(G) | 1.20 | 6.6 × 10⁻⁶ | risk | 0.98 | 0.62 | neutral |
| Systemic Sclerosis7 | rs9494883(G) - rs5029939(G) - rs2230926(G) - rs7749323(A) | 2.88 | 2.63 × 10⁻⁶ | risk | 0.8 | 0.007 | protective |
Discussion
TNFAIP3 appears to be a central player in the regulation of autoimmunity as genetic variants at this locus have been associated with susceptibility to SLE, RA, SSc, CD, and psoriasis. Here, to refine the association signal in psoriasis, we performed an imputation and meta-analysis of the TNFAIP3 region in 4,704 psoriasis cases and 7,805 controls. To maximize imputation accuracy, we utilized a combined reference panel of 1000 Genomes Phase 3 and DCEG, with the latter having been shown to provide enhanced imputation accuracy compared to 1000 Genomes / HapMap alone.12
We identified 49 variants whose significance exceeded an adjusted-Bonferroni significance threshold. Our top hit was rs582757 (p = 6.07 × 10⁻¹², OR=1.23), located within an intron of TNFAIP3. rs582757 had a lower p-value than rs610604 (p = 8.13 × 10⁻¹², OR=1.22), the index SNP originally identified in GWA studies of psoriasis.11, 13 Conditional analysis on rs582757 identified another SNP with suggestive evidence of association, rs6918329 (pcond=7.22 × 10⁻⁵, OR=1.15). Thus, our analysis suggests that there may be two independent psoriasis associations at the TNFAIP3 locus.
Another meta-analysis of psoriasis that included Immunochip data also identified rs582757 as the top SNP at the TNFAIP3 locus.21 However, that study did not conduct fine mapping or conditional analysis of the TNFAIP3 association. Interestingly, our analysis suggests that rs582757 is not the most probable causal SNP at the TNFAIP3 locus, with rs598493 (RegulomeDB score of 3a) more likely to be functional. Similarly, within our second association peak we identified rs9494879 (RegulomeDB score of 2c and location within a long non-coding RNA) as a SNP with high evidence of functionality.
One of the most surprising results of our study was that the TNFAIP3 risk haplotype in psoriasis did not correspond to the TNFAIP3 risk haplotypes seen in SLE, RA, SSc, or CD. In fact, the risk haplotypes in SLE and systemic sclerosis were protective in psoriasis. Expression of TNFAIP3 in different cell types might be regulated by different genetic variants, and cell lineage-specific expression of TNFAIP3 might determine different autoimmune phenotypes. Indeed, the recent development of mice with lineage-specific deletions of TNFAIP3 has shed light on the potential role of TNFAIP3 in different autoimmune phenotypes. Mice with deletion of TNFAIP3 in B cells showed increased plasma cells, IgM and IgG autoantibody production, and renal immunoglobulin deposition that corresponds to features seen in human SLE.22, 23 Mice with deletion of TNFAIP3 in dendritic cells (DCs) demonstrated DC activation, expansion of T cells, and either autoantibody production and nephritis similar to SLE,24 or colitis and seronegative arthritis similar to inflammatory bowel disease.25 Similarly, targeted deletion of TNFAIP3 in intestinal epithelial cells results in mice with hypersensitivity to experimental colitis.26 Mice with deletion of TNFAIP3 in macrophages and granulocytes developed spontaneous polyarthritis and collagen-specific autoantibodies reminiscent of rheumatoid arthritis.27 Finally, targeted deletion of TNFAIP3 in keratinocytes led to mice with keratinocyte hyperproliferation, disheveled hair, and sebocyte hyperplasia, but no inflammation.28 Together, these studies suggest that the dysregulation of TNFAIP3 in different cell types may lead to different clinical outcomes. Therefore, our identification of a distinct psoriasis risk haplotype for TNFAIP3 suggests the possibility that this haplotype might act on a different cell type or combination of cell types compared to other autoimmune diseases. Alternatively, the psoriasis risk haplotype might influence differential temporal expression of TNFAIP3.
In summary, through imputation and meta-analysis of a large number of psoriasis cases and controls, we have identified two probable independent association signals in the TNFAIP3 region corresponding to a select number of candidate causal variants. Comparison of our psoriasis data to other autoimmune diseases revealed that the psoriasis risk haplotype is distinct from otherTNFAIP3 risk variants observed in systemic lupus erythematosus, rheumatoid arthritis, systemic sclerosis, and celiac disease. Our work has highlighted the complex genetic architecture of this locus in autoimmune susceptibility.
Materials and Methods
Cohorts
The five studies in our meta-analysis consisted of data used in three previously published GWAS and one unpublished GWAS, and one additional case-control cohort for which a dense SNP panel was available in the TNFAIP3 region.11, 13, 29 All of the studies were comprised of individuals of self-reported European descent. Table 1 describes these five studies in detail. Two of the GWAS cohorts are North American, the third is from Sweden and the fourth is the psoriasis set from the Wellcome Trust Case Control Consortium 2 (WTCCC2) from the United Kingdom (UK). The additional case-control cohort that was typed on the Illumina Golden Gate panel consisted of North American psoriasis cases diagnosed by a dermatologist and healthy controls recruited at University of California San Francisco and Washington University in St Louis.
Quality Control
In the four GWA studies, common quality-control (QC) filters were applied to each of the GWAS cohorts. We filtered out individuals who have less than93% of complete genotypes, removed SNPs that have less than 95% of complete genotypes, have minor allele frequency (MAF) less than 1% and failed the Hardy-Weinberg equilibrium (HWE) test at p<0.001. In the fine-mapping study, we filtered out individuals who have less than90% complete genotypes, SNPs that have less than 95% of complete genotypes, MAF less than 1% and failed HWE at p<0.0001.
We performed identity-by-descent analysis (IBD) analysis across all North American cohorts to detect duplicates and first-degree relatives because any of the recruitment sites may have contributed to more than one of the cohorts. Because genome-wide data were available for four of the five studies, analysis was performed in three stages. In the first stage, we started with a set of 78,455 SNPs that were common to all four GWAS platforms. Linkage disequilibrium (LD) pruning at r-squared of 0.25 of this set of 78,455 SNPs reduced the number to 52,615 SNPs which we then used to run an IBD analysis in PLINK on the two US cohorts. The IBD analysis indicated that there were 11 duplicates to remove and 5 first-degree relatives (pi-hat >0.47). In the second stage, we compared the 103 common SNPs between the Illumina Golden Gate Panel and the Illumina 317K panel. We had prior knowledge that there were 135 duplicates in the overlap and those 135 were kept in the analysis to confirm that 103 SNPs were sufficient to detect duplicates and relatives. Clustering of the resulting pi-hat values suggested that there were 138 duplicates and 21 first-degree relatives. In the third stage, we compared 163 overlapping SNPs between the Golden Gate and Perlegen 400K panels. As with the second stage, 205 known duplicates were included in this stage of the IBD analysis. The resulting IBD analysis suggested that we remove 219 duplicates and 42 first degree relatives.
Population substructure
Principal components analyses (PCA) to identify ancestry outliers were performed in EIGENSTRAT in three stages in order to incorporate the fine-mapping study. In the first stage of PCA, we used the LD-pruned set of 52k SNPs common across the 4 GWAS platforms. At a threshold of sigma seven, which represents seven standard deviations from the mean of the per-subject principal component values, we removed eight individuals from the Illumina 317K study and 31 individuals from the Perlegen 400k study. We excluded ancestry outliers at a sigma threshold of seven because when graphing the first principal component (PC1) against the second principal component (PC2) at a sigma threshold of six, the threshold removed the Europeans that did not cluster near the Northern Europeans. Since there were 7,353 individuals from the UK (WTCCC2 cohort) and 1,163 individuals from Sweden, the larger proportion of Northern Europeans narrowed the standard deviation. In the second stage, we used the 87 ancestry informative markers (AIMS) that were typed as part of the fine-mapping study to run PCA. No individuals were removed at that stage. In the third stage, we used 48 overlapping AIMS between the Golden Gate panel and the 52k pruned dataset. No additional outliers were removed at that stage from this cohort.
Imputation
We imputed a 250kb region on each side of TNFAIP3 using Impute2 with a combined reference panel of the observed genotypes in the Division of Cancer Epidemiology and Genetics (DCEG) reference panel and the phased haplotypes of the 1000Genomes phase 3.12, 30 SNPs that were present in the DCEG dataset only were removed before imputation. This combined reference panel resulted in 8,787 variants imputed in each study. We removed any imputed SNPs that had an information score of less than 0.3.
Statistical Analyses
Using a missing data likelihood score test in SNPTESTv2.4, we performed single-SNP association tests using an additive model which accounted for genotype uncertainty and adjusted for the first three PCs in each cohort.31 After removing the SNPs with no variation and the poorly performing imputed SNPs, there remained 3,082 SNPs in Illumina 317k, 3,850 SNPs in Perlegen 400k, 3,136 SNPs in Illumina 550k, 3,816 SNPs in Illumina Quad 6 60/1.2M Duo and 2,547 SNPs in the Illumina Golden Gate study. Meta-analysis using a random-effects model was performed in PLINK with 3,815 SNPs represented in two or more studies.32
Upon identifying the most significant SNP in the meta-analysis, we conditioned on that top SNP and adjusted for the first three PCs in each cohort in SNPTEST, and then meta-analyzed those results in PLINK with a random-effects model. The most significant SNP after conditioning on the first then became the second SNP that we adjusted for in the next round of association tests and subsequent meta-analysis. We repeated that process two more times to adjust for the top three SNPs in the fourth round of association tests. To estimate haplotypes and perform haplotype association tests, the genotype dosage data was then converted to a best-guess dataset with a threshold of 0.8 for use in Haploview version 4.2.33 We then compared the risk haplotypes for psoriasis against the risk haplotypes that have been published for other autoimmune diseases. To adjust for multiple testing, we applied a modified Bonferroni correction threshold that accounts for the LD structure by determining the number of informative SNPs in the region. Since the 3,815 SNPs in the TNFAIP3 region are not independent due to LD, we applied a previously published and validated spectral decomposition algorithm to determine the number of the most informative SNPs reducing the 3,815 SNPs in the TNFAIP3 region down to 954 informative SNPs thus making our threshold for significance p<5.3 × 10−5.34
Supplementary Material
Acknowledgments
This work was supported in part by grants from the National Institutes of Health (R01AR065174 and K08AR057763 to W.L. and 2R01 AR050266 to A.B.), Swedish Medical Research Council, Stockholm County Council, Swedish Psoriasis Association, and the Agency for Science Technology and Research (ASTAR), Singapore. Funding for the Collaborative Association Study of Psoriasis was provided by the National Institutes of Health, the Foundation for the National Institutes of Health, and the National Psoriasis Foundation. Support for genotyping of samples was provided through the Genetic Association Information Network (GAIN). Funding for WTCCC data was provided by the Wellcome Trust under awards 076113 and 085475.
Footnotes
Conflict of Interest
The authors have no competing interesting to declare.
References
- 1.Parisi R, Symmons DP, Griffiths CE, Ashcroft DM, et al. Identification, Management of P. Global epidemiology of psoriasis: a systematic review of incidence and prevalence. The Journal of investigative dermatology. 2013;133(2):377–85. doi: 10.1038/jid.2012.339. [DOI] [PubMed] [Google Scholar]
- 2.Prieto-Perez R, Cabaleiro T, Dauden E, Ochoa D, Roman M, Abad-Santos F. Genetics of Psoriasis and Pharmacogenetics of Biological Drugs. Autoimmune diseases. 2013;2013:613086. doi: 10.1155/2013/613086. [DOI] [PMC free article] [PubMed] [Google Scholar]
- 3.Ellinghaus D, Ellinghaus E, Nair RP, Stuart PE, Esko T, Metspalu A, et al. Combined analysis of genome-wide association studies for Crohn disease and psoriasis identifies seven shared susceptibility loci. American journal of human genetics. 2012;90(4):636–47. doi: 10.1016/j.ajhg.2012.02.020. [DOI] [PMC free article] [PubMed] [Google Scholar]
- 4.Adrianto I, Wen F, Templeton A, Wiley G, King JB, Lessard CJ, et al. Association of a functional variant downstream of TNFAIP3 with systemic lupus erythematosus. Nature genetics. 2011;43(3):253–8. doi: 10.1038/ng.766. [DOI] [PMC free article] [PubMed] [Google Scholar]
- 5.Musone SL, Taylor KE, Lu TT, Nititham J, Ferreira RC, Ortmann W, et al. Multiple polymorphisms in the TNFAIP3 region are independently associated with systemic lupus erythematosus. Nature genetics. 2008;40(9):1062–4. doi: 10.1038/ng.202. [DOI] [PMC free article] [PubMed] [Google Scholar]
- 6.Plenge RM, Cotsapas C, Davies L, Price AL, de Bakker PI, Maller J, et al. Two independent alleles at 6q23 associated with risk of rheumatoid arthritis. Nature genetics. 2007;39(12):1477–82. doi: 10.1038/ng.2007.27. [DOI] [PMC free article] [PubMed] [Google Scholar]
- 7.Koumakis E, Giraud M, Dieude P, Cohignac V, Cuomo G, Airo P, et al. Brief report: candidate gene study in systemic sclerosis identifies a rare and functional variant of the TNFAIP3 locus as a risk factor for polyautoimmunity. Arthritis and rheumatism. 2012;64(8):2746–52. doi: 10.1002/art.34490. [DOI] [PubMed] [Google Scholar]
- 8.Trynka G, Hunt KA, Bockett NA, Romanos J, Mistry V, Szperl A, et al. Dense genotyping identifies and localizes multiple common and rare variant association signals in celiac disease. Nature genetics. 2011;43(12):1193–201. doi: 10.1038/ng.998. [DOI] [PMC free article] [PubMed] [Google Scholar]
- 9.Ma A, Malynn BA. A20: linking a complex regulator of ubiquitylation to immunity and human disease. Nature reviews Immunology. 2012;12(11):774–85. doi: 10.1038/nri3313. [DOI] [PMC free article] [PubMed] [Google Scholar]
- 10.Lee EG, Boone DL, Chai S, Libby SL, Chien M, Lodolce JP, et al. Failure to regulate TNF-induced NF-kappaB and cell death responses in A20-deficient mice. Science. 2000;289(5488):2350–4. doi: 10.1126/science.289.5488.2350. [DOI] [PMC free article] [PubMed] [Google Scholar]
- 11.Nair RP, Duffin KC, Helms C, Ding J, Stuart PE, Goldgar D, et al. Genome-wide scan reveals association of psoriasis with IL-23 and NF-kappaB pathways. Nature genetics. 2009;41(2):199–204. doi: 10.1038/ng.311. [DOI] [PMC free article] [PubMed] [Google Scholar]
- 12.Wang Z, Jacobs KB, Yeager M, Hutchinson A, Sampson J, Chatterjee N, et al. Improved imputation of common and uncommon SNPs with a new reference set. Nature genetics. 2012;44(1):6–7. doi: 10.1038/ng.1044. [DOI] [PMC free article] [PubMed] [Google Scholar]
- 13.Strange A, Capon F, Spencer CC, Knight J, et al. Genetic Analysis of Psoriasis C, the Wellcome Trust Case Control C. A genome-wide association study identifies new psoriasis susceptibility loci and an interaction between HLA-C and ERAP1. Nature genetics. 2010;42(11):985–90. doi: 10.1038/ng.694. [DOI] [PMC free article] [PubMed] [Google Scholar]
- 14.DerSimonian R, Laird N. Meta-analysis in clinical trials. Controlled clinical trials. 1986;7(3):177–88. doi: 10.1016/0197-2456(86)90046-2. [DOI] [PubMed] [Google Scholar]
- 15.Boyle AP, Hong EL, Hariharan M, Cheng Y, Schaub MA, Kasowski M, et al. Annotation of functional variation in personal genomes using RegulomeDB. Genome research. 2012;22(9):1790–7. doi: 10.1101/gr.137323.112. [DOI] [PMC free article] [PubMed] [Google Scholar]
- 16.Kircher M, Witten DM, Jain P, O’Roak BJ, Cooper GM, Shendure J. A general framework for estimating the relative pathogenicity of human genetic variants. Nature genetics. 2014;46(3):310–5. doi: 10.1038/ng.2892. [DOI] [PMC free article] [PubMed] [Google Scholar]
- 17.Hangauer MJ, Vaughn IW, McManus MT. Pervasive transcription of the human genome produces thousands of previously unidentified long intergenic noncoding RNAs. PLoS genetics. 2013;9(6):e1003569. doi: 10.1371/journal.pgen.1003569. [DOI] [PMC free article] [PubMed] [Google Scholar]
- 18.Wan Y, Qu K, Zhang QC, Flynn RA, Manor O, Ouyang Z, et al. Landscape and variation of RNA secondary structure across the human transcriptome. Nature. 2014;505(7485):706–9. doi: 10.1038/nature12946. [DOI] [PMC free article] [PubMed] [Google Scholar]
- 19.Consortium EP, Birney E, Stamatoyannopoulos JA, Dutta A, Guigo R, Gingeras TR, et al. Identification and analysis of functional elements in 1% of the human genome by the ENCODE pilot project. Nature. 2007;447(7146):799–816. doi: 10.1038/nature05874. [DOI] [PMC free article] [PubMed] [Google Scholar]
- 20.Verzi MP, Shin H, He HH, Sulahian R, Meyer CA, Montgomery RK, et al. Differentiation-specific histone modifications reveal dynamic chromatin interactions and partners for the intestinal transcription factor CDX2. Developmental cell. 2010;19(5):713–26. doi: 10.1016/j.devcel.2010.10.006. [DOI] [PMC free article] [PubMed] [Google Scholar]
- 21.Tsoi LC, Spain SL, Knight J, Ellinghaus E, Stuart PE, Capon F, et al. Identification of 15 new psoriasis susceptibility loci highlights the role of innate immunity. Nature genetics. 2012;44(12):1341–8. doi: 10.1038/ng.2467. [DOI] [PMC free article] [PubMed] [Google Scholar]
- 22.Tavares RM, Turer EE, Liu CL, Advincula R, Scapini P, Rhee L, et al. The ubiquitin modifying enzyme A20 restricts B cell survival and prevents autoimmunity. Immunity. 2010;33(2):181–91. doi: 10.1016/j.immuni.2010.07.017. [DOI] [PMC free article] [PubMed] [Google Scholar]
- 23.Chu Y, Vahl JC, Kumar D, Heger K, Bertossi A, Wojtowicz E, et al. B cells lacking the tumor suppressor TNFAIP3/A20 display impaired differentiation and hyperactivation and cause inflammation and autoimmunity in aged mice. Blood. 2011;117(7):2227–36. doi: 10.1182/blood-2010-09-306019. [DOI] [PubMed] [Google Scholar]
- 24.Kool M, van Loo G, Waelput W, De Prijck S, Muskens F, Sze M, et al. The ubiquitin-editing protein A20 prevents dendritic cell activation, recognition of apoptotic cells, and systemic autoimmunity. Immunity. 2011;35(1):82–96. doi: 10.1016/j.immuni.2011.05.013. [DOI] [PubMed] [Google Scholar]
- 25.Hammer GE, Turer EE, Taylor KE, Fang CJ, Advincula R, Oshima S, et al. Expression of A20 by dendritic cells preserves immune homeostasis and prevents colitis and spondyloarthritis. Nature immunology. 2011;12(12):1184–93. doi: 10.1038/ni.2135. [DOI] [PMC free article] [PubMed] [Google Scholar]
- 26.Vereecke L, Sze M, Mc Guire C, Rogiers B, Chu Y, Schmidt-Supprian M, et al. Enterocyte-specific A20 deficiency sensitizes to tumor necrosis factor-induced toxicity and experimental colitis. The Journal of experimental medicine. 2010;207(7):1513–23. doi: 10.1084/jem.20092474. [DOI] [PMC free article] [PubMed] [Google Scholar]
- 27.Matmati M, Jacques P, Maelfait J, Verheugen E, Kool M, Sze M, et al. A20 (TNFAIP3) deficiency in myeloid cells triggers erosive polyarthritis resembling rheumatoid arthritis. Nature genetics. 2011;43(9):908–12. doi: 10.1038/ng.874. [DOI] [PubMed] [Google Scholar]
- 28.Lippens S, Lefebvre S, Gilbert B, Sze M, Devos M, Verhelst K, et al. Keratinocyte-specific ablation of the NF-kappaB regulatory protein A20 (TNFAIP3) reveals a role in the control of epidermal homeostasis. Cell death and differentiation. 2011;18(12):1845–53. doi: 10.1038/cdd.2011.55. [DOI] [PMC free article] [PubMed] [Google Scholar]
- 29.Liu Y, Helms C, Liao W, Zaba LC, Duan S, Gardner J, et al. A genome-wide association study of psoriasis and psoriatic arthritis identifies new disease loci. PLoS genetics. 2008;4(3):e1000041. doi: 10.1371/journal.pgen.1000041. [DOI] [PMC free article] [PubMed] [Google Scholar]
- 30.Genomes Project C. Abecasis GR, Altshuler D, Auton A, Brooks LD, Durbin RM, et al. A map of human genome variation from population-scale sequencing. Nature. 2010;467(7319):1061–73. doi: 10.1038/nature09534. [DOI] [PMC free article] [PubMed] [Google Scholar]
- 31.Marchini J, Howie B, Myers S, McVean G, Donnelly P. A new multipoint method for genome-wide association studies by imputation of genotypes. Nature genetics. 2007;39(7):906–13. doi: 10.1038/ng2088. [DOI] [PubMed] [Google Scholar]
- 32.Purcell S, Neale B, Todd-Brown K, Thomas L, Ferreira MA, Bender D, et al. PLINK: a tool set for whole-genome association and population-based linkage analyses. American journal of human genetics. 2007;81(3):559–75. doi: 10.1086/519795. [DOI] [PMC free article] [PubMed] [Google Scholar]
- 33.Barrett JC, Fry B, Maller J, Daly MJ. Haploview: analysis and visualization of LD and haplotype maps. Bioinformatics. 2005;21(2):263–5. doi: 10.1093/bioinformatics/bth457. [DOI] [PubMed] [Google Scholar]
- 34.Nyholt DR. A simple correction for multiple testing for single-nucleotide polymorphisms in linkage disequilibrium with each other. American journal of human genetics. 2004;74(4):765–9. doi: 10.1086/383251. [DOI] [PMC free article] [PubMed] [Google Scholar]
Associated Data
This section collects any data citations, data availability statements, or supplementary materials included in this article.