

ABSTRACT
It is well known that rhizosphere microbiomes differ from those of surrounding soil, and yet we know little about how these root-associated microbial communities change through the growing season and between seasons. We analyzed the response of soil bacteria to roots of the common annual grass Avena fatua over two growing seasons using high-throughput sequencing of 16S rRNA genes. Over the two periods of growth, the rhizosphere bacterial communities followed consistent successional patterns as plants grew, although the starting communities were distinct. Succession in the rhizosphere was characterized by a significant decrease in both taxonomic and phylogenetic diversity relative to background soil communities, driven by reductions in both richness and evenness of the bacterial communities. Plant roots selectively stimulated the relative abundance of Alphaproteobacteria, Betaproteobacteria, and Bacteroidetes but reduced the abundance of Acidobacteria, Actinobacteria, and Firmicutes. Taxa that increased in relative abundance in the rhizosphere soil displayed phylogenetic clustering, suggesting some conservation and an evolutionary basis for the response of complex soil bacterial communities to the presence of plant roots. The reproducibility of rhizosphere succession and the apparent phylogenetic conservation of rhizosphere competence traits suggest adaptation of the indigenous bacterial community to this common grass over the many decades of its presence.
IMPORTANCE
We document the successional patterns of rhizosphere bacterial communities associated with a “wild” annual grass, Avena fatua, which is commonly a dominant plant in Mediterranean-type annual grasslands around the world; the plant was grown in its grassland soil. Most studies documenting rhizosphere microbiomes address “domesticated” plants growing in soils to which they are introduced. Rhizosphere bacterial communities exhibited a pattern of temporal succession that was consistent and repeatable over two growing seasons. There are few studies assessing the reproducibility over multiple seasons. Through the growing season, the rhizosphere community became progressively less diverse, likely reflecting root homogenization of soil microniches. Phylogenetic clustering of the rhizosphere dynamic taxa suggests evolutionary adaptation to Avena roots. The reproducibility of rhizosphere succession and the apparent phylogenetic conservation of rhizosphere competence traits suggest adaptation of the indigenous bacterial community to this common grass over the many decades of its presence.
INTRODUCTION
Plant roots supply a significant amount of carbon (C) to adjacent rhizosphere soil, resulting in growth and interactions among populations present in the resident soil microbial community (1, 2). Root activities modify the physiochemical properties of the surrounding soil (e.g., water and oxygen availability and pH), which also shape microbial communities (3, 4). Through their interactions with plant roots, rhizosphere microbial communities influence terrestrial C and nutrient cycling, as well as plant growth and health (5–7). The ecological processes that control the assembly of the rhizosphere microbiome and drive the succession of the rhizosphere community are of fundamental importance to terrestrial ecosystem functioning.
Previous studies using microbial fingerprinting techniques (e.g., denaturing gradient gel electrophoresis [DGGE] and terminal restriction fragment length polymorphism [TRFLP]) have shown that plant species and soil types have measurable effects on rhizosphere microbial communities (8, 9). However, the responses of microbial populations to plant growth are less well known (10). High-throughput sequencing (e.g., Illumina and 454 pyrosequencing) of 16S rRNA gene amplicons enables exploration of the phylogenetic/taxonomic composition and structure of microbial communities at a much higher resolution than previous techniques (11, 12) and has increased our capacity to describe the diversity and evolutionary basis of succession in root-associated soil microbial communities (10, 13). For example, two studies that characterized rhizosphere communities and endophytes associated with the model plant Arabidopsis thaliana (1,000 to 4,000 operational taxonomic units [OTUs]) using 454 pyrosequencing showed that A. thaliana roots were preferentially colonized by Proteobacteria, Bacteroidetes, and Actinobacteria (14, 15). More recently, Chaparro et al. (16) reported that rhizosphere bacterial communities associated with A. thaliana at the seedling stage were significantly different from other developmental stages (vegetative, bolting, and flowering) based on over 30,000 454 sequencing reads; some phyla (e.g., Acidobacteria, Actinobacteria, and Bacteroidetes) followed distinct patterns as the plant grew. However, it remains unclear how microbial communities change after plant senescence and when a new growing season begins.
In this study, we followed the responses and succession of the bacterial community in the rhizosphere of a common annual grass, Avena fatua, growing in a California annual grassland soil. A. fatua is a common, naturalized exotic inhabitant of California Mediterranean grasslands and a globally important agricultural weed. The composition of the rhizosphere bacterial community was followed for two growing seasons separated by a dry season, as occurs annually in the California Mediterranean-type climate. Soil microbial communities were analyzed from preplanting through four plant growth stages (i.e., seedling, vegetative, flowering, and senescent) in both seasons (Fig. 1) using Illumina MiSeq sequencing of 16S rRNA gene amplicons and quantitative PCR (qPCR). Plants were grown in a greenhouse for 12 weeks per growth cycle, using grassland soil from the University of California Hopland field station in which Avena spp. have been resident for over a century. This investigation was designed to answer two questions: (i) how does the composition of the soil bacterial community associated with growing roots of an annual grass, Avena fatua, change with growth of the plant, and is this pattern repeatable across seasons? and (ii) do bacteria indigenous to a soil in which A. fatua has grown for many years exhibit adaptation to the soil environment created by roots, as evidenced by phylogenetic clustering?
FIG 1 .

Experimental design and definition of soils sampled for analysis.
RESULTS
Succession of rhizosphere bacterial communities.
Across the 288 samples analyzed, a total of 153,504 OTUs were obtained after randomly resampling Illumina 16S sequence reads to the same depth (11,914 sequences per sample). However, this sequencing depth was not sufficient to document the vast diversity of the bacterial community in this natural soil ecosystem (see Fig. S1 in the supplemental material). To assess the dynamics of bacterial community structure over time, a principal coordinate analysis (PCoA) based on the Bray distance metric was conducted (Fig. 2). The composition of rhizosphere bacterial communities differed significantly (P < 0.01, Adonis) from bulk/residual soil communities in both seasons (Fig. 2). Rhizosphere bacterial communities exhibited successional patterns in which the rhizosphere community gradually diverged from bulk/residual soil communities as the plants grew (P < 0.01, Adonis). In addition, samples collected from the two seasons showed a clear and significant (P < 0.01, Adonis) separation. Interestingly, within each season, bulk soil samples clustered much more closely together than the rhizosphere samples (Fig. 2). In general, the dispersion among replicates of bulk bacterial communities did not change over time (0.362 to 0.369). However, in season 1, the dispersion in replicated rhizosphere bacterial communities generally increased over time with plant growth (from 0.375 to 0.417 [Fig. 2]). The source of this increased dispersion in the season 1 rhizosphere community composition was further explored by comparing the variation in plant shoot biomass (at each sampling time in season 1) and the dispersion of the associated rhizosphere community. The dispersion in the rhizosphere bacterial communities correlated strongly (Pearson’s r2 = 0.99, P < 0.01) with the variation in plant shoot biomass (see Fig. S2). Although the dispersion in rhizosphere communities in season 2 was larger than that in the residual soil communities (0.300 and 0.280, respectively; P < 0.05) (Fig. 2), it was similar across plant growth stages (0.294 to 0.302) and did not show significant correlations with the variation of plant biomass.
FIG 2 .
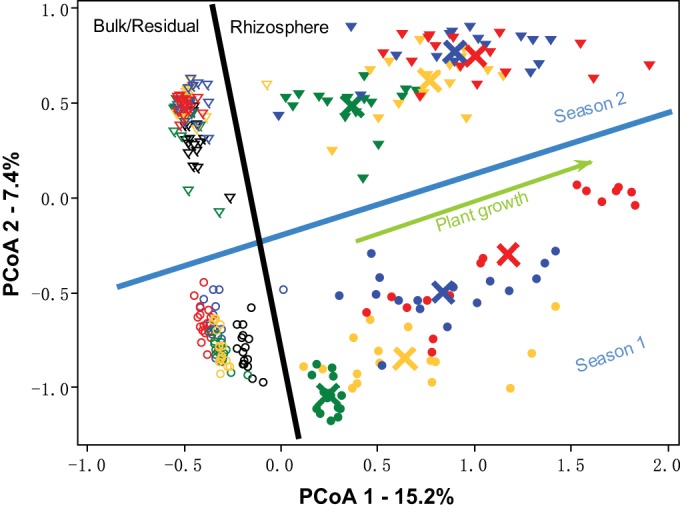
PCoA analysis of bulk/residual soil and rhizosphere microbial community associated with Avena fatua grown in microcosms for 12 weeks in two seasons, based on the Bray distance metric. The percent value for each axis represents the proportion of total variation explained. Circles and triangles represent samples from seasons 1 and 2, respectively. Solid symbols indicate rhizosphere soils, and open symbols indicate the bulk/residual soils. Samples collected at weeks 0, 3, 6, 9, and 12 are shown in black, green, yellow, blue, and red, respectively. Large crosses indicate the centroid of rhizosphere treatment at different plant growth stages in corresponding colors.
Effects of plant growth on the bacterial community alpha-diversity.
Calculation of traditional (richness, Shannon’s diversity, and Pielou’s evenness) and phylogenetic (Faith’s phylogenetic diversity [PD]) diversity indices yielded similar conclusions. Indices of bacterial alpha-diversity in the rhizosphere communities were significantly lower than those of the bulk or residual soils; all diversity indices in rhizosphere soil gradually decreased over time as the plant grew, in both seasons (Fig. 3; see also Table S1 in the supplemental material). In contrast, the diversity of bulk/residual soil bacterial communities remained relatively stable, although a reduction in richness and Faith’s PD was detected from week 0 to week 3 in season 2. In season 2, each community diversity index was lower than the comparable value from season 1 (Fig. 3).
FIG 3 .

The diversity of bulk/residual soil and rhizosphere microbial community associated with Avena fatua as indicated by OTU richness, phylogenetic diversity, Shannon index, and Pielou’s evenness in rhizosphere and bulk soils across plant growth stages in both seasons. Data are presented as means ± standard errors (n = 16).
Bacterial responses to plant growth.
In both seasons, bacterial 16S rRNA gene abundance (measured by qPCR) in rhizosphere soil gradually increased over time beginning at week 3 (P < 0.05 [Fig. 4]). 16S rRNA gene abundance was significantly higher in rhizosphere soils than in bulk/residual soil beginning at week 6 for season 1 and week 3 for season 2. In the bulk/residual soil, seasonal patterns were also quite consistent; bacterial 16S rRNA gene abundance decreased from week 0 to weeks 3 and 6 (P < 0.05), followed by a slight increase (Fig. 4).
FIG 4 .
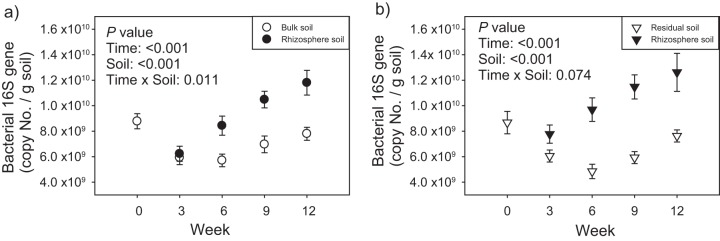
Abundance of bacterial 16S rRNA genes in bulk and rhizosphere soils associated with A. fatua at different growth stages in season 1 (a) and season 2 (b). Data are presented as means ± standard errors (n = 16). ANOVA P values are shown in the figure.
The relative abundances of several abundant bacterial phyla (classes for the Proteobacteria phylum) differed significantly between rhizosphere and bulk/residual soil communities. Proteobacteria (particularly Alphaproteobacteria, Betaproteobacteria, and Gammaproteobacteria) and Bacteroidetes became significantly enriched in the rhizosphere compared to the preplanted (week 0) soils (Fig. 5a and c). In contrast, the relative abundances of Actinobacteria, Acidobacteria, Firmicutes, Planctomycetes, Gemmatimonadetes, and Chloroflexi were significantly reduced in the rhizosphere compared to preplanted soil, and in general, their relative abundances decreased gradually over time (Fig. 5a and c). Generally, the patterns of bacterial responses to plant growth are consistent between two seasons. Compared to the rhizosphere communities, the relative abundances of commonly occurring bacterial groups in the bulk/residual soils remained relatively stable across sampling time points in both seasons, and in some cases, the direction of changes in relative phylum abundance was opposite that observed in the rhizosphere communities (Fig. 5b and d).
FIG 5 .

Relative abundance of abundant soil microbial groups at the phylum level in preplanted and rhizosphere (a and c) and preplanted and bulk/residual (b and d) soils at different A. fatua growth stages as detected by Illumina sequencing of 16S rRNA gene amplicons. Data are presented as means ± standard errors (n = 16). *, P < 0.05, **, P < 0.01, ***, P < 0.001.
We determined the “dynamic” rhizosphere bacterial taxa, that is, the taxa commonly present in rhizosphere soils (>50% frequency) that significantly changed in relative abundance compared to week 0 soils in a given season. The number of these dynamic rhizosphere OTUs increased over time, with 258, 539, 677, and 1,028 OTUs at weeks 3, 6, 9, and 12 in season 1, respectively (see Fig. S3 in the supplemental material). In many cases, OTUs from the same taxonomic groups, mostly at the phylum or class level, demonstrated a similar response to the plant growth (either positive or negative). Similar patterns were found for the dynamic rhizosphere OTUs in season 2 (see Fig. S3). Six hundred taxa (~30% of total dynamic taxa) were found in common in the two seasons.
Net relatedness index (NRI) values were calculated to further explore the phylogenetic clustering of rhizosphere-enriched taxa to determine whether those OTUs are more related to each other than would be predicted by a random model. NRI values provide an index of basal clustering of taxa on the phylogenetic tree (17). Taxa that responded positively (i.e., rhizosphere enriched) to A. fatua roots were significantly clustered within the phylogenetic tree at each growth stage (season 1, week 12, NRI of 7.42, P = 0.01; season 2, week 12, NRI of 6.97, P = 0.01), suggesting that the traits related to rhizosphere competence are phylogenetically conserved.
DISCUSSION
The effects of plant roots on soil bacterial communities are well documented (8, 18, 19). Our study demonstrated that the “rhizosphere effect” was present as early as 3 weeks after grass germination and that the effect increased throughout the plant growth cycle. This suggests that plant growth drove succession in the rhizosphere community, while the bulk/residual soil communities remained relatively stable. Li et al. (20) reported that maize rhizosphere communities changed between early and late growth stages; however, in their research it was difficult to distinguish between plant growth and seasonal effects. Chaparro et al. (16) showed that rhizosphere bacterial communities at the seedling stage of Arabidopsis thaliana were distinct from vegetative, bolting, and flowering stages; the communities associated with the latter three stages were not significantly different. It is commonly hypothesized that plant-driven changes in the rhizosphere microbial community composition could result from alterations of plant root exudates (quality and quantity) at different growth stages (21, 22). Using a sterile hydroponics system, we have documented a gradual shift in the exudate profile of A. fatua over time (S. Shi, R. Estera, S. Jenkins, T. Northen, M. Firestone, unpublished data). Interestingly, our study here clearly demonstrates that the rhizosphere succession pattern was reproducible from season to season. The significant difference observed between samples collected from two seasons may be due to the presence of root debris in residual soil in season 2.
We found that the presence of living Avena roots increased the dispersion of the bacterial community significantly in both seasons. This was likely due to variability in the effects of live roots on the soil community. The microbial community variance at the end of season 1 disappeared in the absence of live roots during the dry season between season 1 and season 2.
Interestingly, the presence of Avena roots decreased bacterial diversity in the rhizosphere. Soil is thought to be among the most diverse microbial habitats on Earth (23, 24). This high diversity is commonly attributed to microsite niche heterogeneity (25, 26). If the presence of roots reduces extant niche heterogeneity (albeit temporarily), then the microbial community richness (and diversity) could be reduced in the rhizosphere soil. As roots move through a heterogeneous array of soil microsites, the impacts of the root on C availability, pH, water, and soil atmosphere could overwhelm and homogenize differences among soil microsites, at least until other environmental drivers, such as summer dry-down, reset the system. By 12 weeks, taxon richness in our A. fatua rhizosphere soil was significantly reduced and showed continued reduction in the second season (Fig. 3). Alternatively, a reduction in community diversity could result from altered species abundance distributions over time. If the presence of roots substantially reduces the evenness of taxon distribution (enrichment of select members or loss of detectable low-abundance taxa), then a decrease in taxon-based univariate diversity indices would likely result. In our study, the presence of Avena roots did significantly reduce Pielou’s evenness in the rhizosphere samples from week 12 in the first season and later in the second season (Fig. 3). Interestingly, the reductions in bacterial richness and Faith’s PD indices that were observed at the end of season 1 persisted over the dry, nongrowing season and were apparent at the beginning of the second season. Thus, the observed reduction in bacterial community diversity in the rhizosphere soil likely resulted from a combination of reduced taxon richness and evenness. Reductions in bacterial community diversity in rhizosphere soils have been observed in other plant systems (13, 20, 27–29). We do not yet know whether reductions in taxonomic and phylogenetic diversity are accompanied by reductions in functional diversity. Reducing functional diversity could impact microbial community redundancy and/or biogeochemical processes.
The response of taxa to Avena roots was generally consistent at the phylum/class level and between the two seasons (Fig. 5; see also Fig. S3 in the supplemental material). For example, Proteobacteria and Bacteroidetes commonly respond positively to plant roots (2, 13–15, 18, 30). Members of the Proteobacteria, especially Alphaproteobacteria, Betaproteobacteria, and Gammaproteobacteria, are well-known rhizosphere colonizers and have generally been characterized as fast-growing r-strategists, which respond positively to low-molecular-weight substrates (31, 32), which are abundant in plant root exudates (1, 35). Studies using 13CO2 pulse-labeling of host plants have demonstrated that Proteobacteria were the major microbial group utilizing root exudates (33, 34). Apart from stimulating these soil microbial groups by releasing a variety of exudate compounds (1, 5, 35, 36), plant root activities can also modify the physicochemical environment (e.g., water content, pH, and nutrient availability) of surrounding soil (3), thus acting as a habitat filter to select for or against microbial populations.
In general, our results show that populations affiliated with the phyla of Acidobacteria, Actinobacteria, and Firmicutes decreased in relative abundance in the rhizosphere as the plant grew. The depletion of these populations in the rhizosphere could be due to a decrease in their absolute abundance (actual depletion) or a decrease in relative abundances as the result of increased abundances of other microbes (apparent depletion). Indeed, we did detect a significant increase of overall bacterial 16S copy number in the rhizosphere. Although it is difficult to distinguish between these two situations, rank order shifts of different microbial groups within a community can reflect survival/functional ability within available niches (32). The decrease of these populations could be due to a negative impact of the changing environment in soil near plant roots (e.g., pH) or due to competition from fast-growing microbes (e.g., Alphaproteobacteria and Betaproteobacteria) for resources or microbe-microbe inhibition. For example, the “depletion” of Acidobacteria in our study may be due to their typically low growth rates and classical k-strategist lifestyle (31, 37, 38).
Significantly, rhizosphere-stimulated taxa were phylogenetically clustered across all four growth stages in both seasons, suggesting that these bacterial taxa share ecological traits (i.e., rhizosphere competence) that are phylogenetically conserved (17). Our greenhouse-based study corroborates a study of bacterial populations associated with Avena spp. growing in three California annual grasslands; Nuccio reports strong phylogenetic clustering of the core Avena rhizosphere microbiome (39). Apart from C utilization traits, other traits associated with habitat (e.g., growth strategy, optimum pH, and soil moisture) may play important roles in rhizosphere colonization. Past studies have shown that microbes with habitat preference traits are ecologically coherent at high taxonomic ranks and thus potentially phylogenetically clustered (31, 40–43). As the rhizosphere presents a complex and dynamic environment, rhizosphere competence likely requires a coordination of multiple phenotypic traits. Thus, our observation of phylogenetic clustering of rhizosphere competence suggests that the complex suite of traits necessary to proliferate in the root environment may have deep evolutionary origins.
Our results provide a detailed picture of the temporal succession of the soil bacterial community in response to growing roots of the common annual grass Avena fatua. The pattern of succession is repeatable and highly consistent over two growing seasons. We show that this annual grass exerts selection pressure from early stages of growth and throughout its life span, resulting in a rhizosphere community substantially changed from that of the background soil. Previous field-based research suggested that components of the Avena microbiome provide nutrient-based benefits to the plant (44, 45). Thus, this strong and consistent successional pattern of the Avena rhizosphere may represent a fitness trait of the plant as it consistently recruits soil microbes with similar functions to its root environment. Such an annual cycle of selection would be expected to repeat each year with variation in selection associated with different grasses and forbs growing in the field. The indigenous soil community encountered by a growing root in this annual grassland soil would thus result from integration of repeated and varied annual plant selection nested in soil and climatic controllers of the extant soil community.
MATERIALS AND METHODS
Experimental design.
This study was conducted at the Environmental Plant Isotope Chamber (EPIC) facility at the University of California, Berkeley, in a replicated series of plant growth chambers housed within the university’s Oxford Tract Greenhouse complex. Soil (0 to 10 cm) was collected from the Little Buck watershed at the University of California Hopland Research and Extension Center, in an area in which Avena spp. are the dominant vegetation. The soil is classified as coarse-loamy, mesic Ultic Haploxeroll (USDA-NRCS web soil survey; http://websoilsurvey.nrcs.usda.gov) and contains 55% sand, 31% silt, and 14% clay. Mean C and N contents at the beginning of the experiment were 1.68% and 0.138%, respectively. After sieving (<2 mm), soil was packed into microcosms (11.5 by 2.9 by 25.5 linear cm) to a bulk density of 1.21 g ⋅ linear cm to match that in the field. In total, 160 microcosms were used in this study. To ensure that bulk soils with minimal influence by plant roots could be collected during the first season, each microcosm contained a root-excluding mesh bag (1 µm; 2 by 2.9 by 25.5 linear cm) at the edge of the growth box (Fig. 1). Microcosms were incubated in 16 growth chambers (56 by 56 by 76 linear cm) with a 16-h light period per day (from 6 a.m. to 10 p.m.) and a maximum air temperature of 28°C. Microcosms were watered with tap water three times a week to maintain soil moisture at approximately 15%. The experimental design included two concentrations of atmospheric CO2 (400 ppm and 700 ppm). However, atmospheric CO2 concentration did not have a detectable impact on the 16S rRNA gene-based taxonomic composition of rhizosphere or bulk soil bacterial communities (see Table S2 in the supplemental material); hence, we combined the results from the two CO2 levels, resulting in 16 replicates for each soil type (rhizosphere or bulk/residual soils) at each sampling time. Monitoring and maintenance of chambers are described in detail in Text S1 in the supplemental material. After 2 weeks of moist soil acclimation, one microcosm from each chamber was sampled as a preplanted control (season 1, week 0). On the same day, the remaining microcosms were planted with 3-day-old A. fatua seedlings (one seedling per microcosm; seeds were obtained from Pacific Coast Seed Inc., CA, and germinated in wet paper towels). During the first growing season, one microcosm from each of 16 chambers was harvested for rhizosphere and paired bulk soil sample collection at the seedling stage (week 3), vegetative stage (week 6), flowering stage (week 9), and senescence stage (week 12) (Fig. 1). After 12 weeks, the plant shoots from the remaining 80 microcosms were clipped off and these microcosms were kept in the greenhouse without any watering for 3 months, to simulate a dry Mediterranean-type summer period. The second growth season was initiated by watering the soils as in the first season. One week later, one microcosm from each chamber was sampled as preplanted control (season 2, week 0). On the same day, A. fatua seedlings were planted in the remaining microcosms in the chambers (1 seedling per microcosm) and the second growing season was begun. The same growth conditions and sampling strategies were used for the second season as for the first season (Fig. 1).
Plant and soil sampling.
At each harvest, rhizosphere soil was collected by gently shaking the whole plant root system to remove loosely attached soil, and then the soil adhering to the root system was placed in a stomacher bag (Seward Ltd., West Sussex, United Kingdom) filled with 20 ml of phosphate-buffered saline and processed for molecular microbial community analysis as previously described (36). Approximately 5 g of bulk soils collected from the middle section of bulk soil bags (or from preplanted microcosms) was prepared in the same way as rhizosphere soils. After collection, all soils were stored at −80°C until analysis. For season 2 samples, no “pure” bulk soil existed. Instead, live roots with attached rhizosphere soils were removed from the microcosms and all remaining soil was collected and is referred to as “residual soil.” In total, 288 samples were obtained: 2 seasons × [16 replicates of preplanted soil at week 0 + (4 plant growth stages × 16 replicates × 2 soils)].
DNA extraction.
Soil microbial DNA was extracted from 0.5 g of rhizosphere or bulk/residual soil samples in a cetyltrimethylammonium bromide (CTAB) buffer using a phenol-chloroform purification protocol (18). DNA concentrations were quantified by PicoGreen using a FLUOstar Optima microplate reader (BMG Labtech, Jena, Germany).
qPCR and Illumina sequencing of 16S rRNA gene amplicons.
The abundance of 16S rRNA was measured by quantitative PCR (qPCR) with primer set EUB338/EUB518 (46). The V4 regions of 16S rRNA genes in all DNA samples were amplified with primer set F515 and R806 with attached Illumina flow cell adapter sequences and sequenced on an Illumina MiSeq 2.0 platform at the Institute for Environmental Genomics, University of Oklahoma. Sample libraries were prepared according to the MiSeq reagent kit preparation guide (Illumina, San Diego, CA), and the sequencing protocol was modified from the work of Caporaso et al. (11). Additional details are available in the supplemental material.
Sequence and statistical analyses.
Raw sequence data were processed using an in-house pipeline at the University of Oklahoma built on the Galaxy platform. The raw data were first quality evaluated with FastQC (http://www.bioinformatics.babraham.ac.uk/projects/fastqc/), and sequences were assigned to samples using barcode/index reads. Sequences with quality scores of <20 were removed using Btrim (47), and paired-end reads were merged into full-length amplicon sequences with FLASH (48). Unqualified sequences were removed if they were <251 bp or >256 bp or contained ambiguous residues. Chimeric sequences were discarded based on prediction by UCHIME (49) using the reference database mode. Sequences were clustered into OTUs using UCLUST (50) at a threshold of 97% similarity. Singletons were also discarded. Taxonomies of 16S OTUs were annotated according to the RDP 16S rRNA classifier (51). To reduce the influence of sequencing depth on treatment effects, samples were then randomly resampled to the same sequence depth (11,914 sequences per sample).
A phylogenetic tree used to calculate phylogenetic diversity (Faith’s PD) was created using the generalized time-reversible model in FastTree with a gamma branch-length correction (52) with all detected 153,504 OTUs. Faith’s PD was calculated using the Picante package in R (53) for each treatment. To determine the phylogenetic relatedness of dynamic microbial populations responding to plant roots, we conducted NRI analysis on rhizosphere-enriched taxa (17, 54). The entire 153,504-OTU member tree was too large for the available NRI calculation package, so the tree used to calculate NRI was composed of the 13,000 most abundant taxa in the data set (relative abundance, ≥2 × 10⁻⁶) and constructed with the same method as described above. NRI analysis was performed with the Picante and Ape packages in R (53, 55).
All statistical analyses were conducted in the R environment (version 2.15.0; R Development Core Team, 2011), and significant differences were defined at P values of <0.05. The overall structure of microbial communities was ordinated by principal coordinate analysis (PCoA) based on the Bray distance metric. Adonis in the vegan package (56) based on Bray distance was used to evaluate significance compared to the null hypothesis. Dispersion of replicate microbial communities (average distance to centroid) was calculated using the permdisp2 procedure (57, 58). PCoA, Adonis, permdisp2, and diversity indices (richness, Shannon, and Pielou’s evenness) were performed using the “vegan” package in R (59). Bacterial community diversity indices and abundance of bacterial 16S rRNA in each growing season were analyzed using a two-factor analysis of variance (ANOVA) model (time and rhizosphere versus bulk/residual soils), while phylum/class abundances were analyzed with a one-factor test (time). All of the abundance data (qPCR and Illumina sequencing) were log2 (1 + x) transformed to meet assumptions of normality. To determine if bacterial populations were impacted by the plant and its growth, dynamic A. fatua rhizosphere microbiomes were constructed based on two criteria: (i) OTUs commonly present in rhizosphere samples (≥50% frequency) and (ii) OTUs whose abundance changed significantly compared to the preplanted soils in each season (paired Student’s t test with Benjamini-Hochberg-corrected P value of <0.05).
SUPPLEMENTAL MATERIAL
Detailed materials and methods. Download
Rarefaction curves of bulk/residual and rhizosphere bacterial communities of Avena grown in microcosms collected at five sampling points in two seasons. Shown are the mean rarefaction curves of each community (n = 16). The broken line indicates the rarefaction used for this study. Download
Relationship of variance in rhizosphere microbial community composition (distance to centroid, based on Bray distance) and variation in shoot biomass of Avena grown in microcosms collected at four time points (weeks 3, 6, 9, and 12) in season 1. Download
Numbers of dynamic taxa in Avena rhizosphere microbiome at different plant growth stages in both seasons. OTUs enriched in the rhizosphere (the abundance of OTUs increased significantly compared to the corresponding OTUs at week 0) are shown on the right panel of the figure, and the OTUs depleted in the rhizosphere are shown on the left panel. The top panel contains the most dominant phyla/classes of soil microbes, and the bottom panel contains the phyla/classes present in soil at lower concentrations. Download
ANOVA P values of each diversity index calculated based on Illumina MiSeq 16S sequencing in each growing season using a two-factor model (time and rhizosphere versus bulk soils) in paired samples (from same microcosm).
Adonis analysis of CO2 treatment effects (n = 8) on the overall structure of bulk soil and rhizosphere microbial community of Avena fatua analyzed by MiSeq 16S sequencing with the Bray distance metric.
ACKNOWLEDGMENTS
This material is based upon work supported by the U.S. Department of Energy, Office of Science, Office of Biological and Environmental Research Genomic Science Program, under award no. DE-SC0004730 and DE-SC0010570. Part of this work was performed at the University of Oklahoma, funded by the DOE under UC subcontract no. 00008322. Part of this work (E.L.B. and U.N.D.) was performed at Lawrence Berkeley National Laboratory under Department of Energy contract no. DE-AC02-05CH11231; the work of J.P.-R. was conducted under the auspices of the U.S. Department of Energy at Lawrence Livermore National Laboratory under contract SA-DOE-29318.
We thank Julie Wang, Kristina Lee (UC Berkeley), and HsiaoChien (Jeny) Lim (LBNL) for their valuable assistance in the lab. We also thank Liyou Wu (OU) for the development of MiSeq sequencing technology and Yujia Qin (OU) for constructing the sequencing analysis pipeline.
Footnotes
Citation Shi S, Nuccio E, Herman DJ, Rijkers R, Estera K, Li J, da Rocha UN, He Z, Pett-Ridge J, Brodie EL, Zhou J, Firestone M. 2015. Successional trajectories of rhizosphere bacterial communities over consecutive seasons. mBio 6(4):e00746-15. doi:10.1128/mBio.00746-15.
REFERENCES
- 1.Bais HP, Weir TL, Perry LG, Gilroy S, Vivanco JM. 2006. The role of root exudates in rhizosphere interactions with plants and other organisms. Annu Rev Plant Biol 57:233–266. doi: 10.1146/annurev.arplant.57.032905.105159. [DOI] [PubMed] [Google Scholar]
- 2.Shi S, Richardson AE, O’Callaghan M, DeAngelis KM, Jones EE, Stewart A, Firestone MK, Condron LM. 2011. Effects of selected root exudate components on soil bacterial communities. FEMS Microbiol Ecol 77:600–610. doi: 10.1111/j.1574-6941.2011.01150.x. [DOI] [PubMed] [Google Scholar]
- 3.Hinsinger P, Bengough AG, Vetterlein D, Young IM. 2009. Rhizosphere: biophysics, biogeochemistry and ecological relevance. Plant Soil 321:117–152. doi: 10.1007/s11104-008-9885-9. [DOI] [Google Scholar]
- 4.da Rocha UN, Van Overbeek L, Van Elsas JD. 2009. Exploration of hitherto-uncultured bacteria from the rhizosphere. FEMS Microbiol Ecol 69:313–328. doi: 10.1111/j.1574-6941.2009.00702.x. [DOI] [PubMed] [Google Scholar]
- 5.Mendes R, Garbeva P, Raaijmakers JM. 2013. The rhizosphere microbiome: significance of plant beneficial, plant pathogenic, and human pathogenic microorganisms. FEMS Microbiol Rev 37:634–663. doi: 10.1111/1574-6976.12028. [DOI] [PubMed] [Google Scholar]
- 6.Mendes R, Kruijt M, de Bruijn I, Dekkers E, van der Voort M, Schneider JH, Piceno YM, DeSantis TZ, Andersen GL, Bakker PA, Raaijmakers JM. 2011. Deciphering the rhizosphere microbiome for disease-suppressive bacteria. Science 332:1097–1100. doi: 10.1126/science.1203980. [DOI] [PubMed] [Google Scholar]
- 7.Carney KM, Hungate BA, Drake BG, Megonigal JP. 2007. Altered soil microbial community at elevated CO2 leads to loss of soil carbon. Proc Natl Acad Sci U S A 104:4990–4995. doi: 10.1073/pnas.0610045104. [DOI] [PMC free article] [PubMed] [Google Scholar]
- 8.Berg G, Smalla K. 2009. Plant species and soil type cooperatively shape the structure and function of microbial communities in the rhizosphere. FEMS Microbiol Ecol 68:1–13. doi: 10.1111/j.1574-6941.2009.00654.x. [DOI] [PubMed] [Google Scholar]
- 9.Smalla K, Wieland G, Buchner A, Zock A, Parzy J, Kaiser S, Roskot N, Heuer H, Berg G. 2001. Bulk and rhizosphere soil bacterial communities studied by denaturing gradient gel electrophoresis: plant-dependent enrichment and seasonal shifts revealed. Appl Environ Microbiol 67:4742–4751. doi: 10.1128/AEM.67.10.4742-4751.2001. [DOI] [PMC free article] [PubMed] [Google Scholar]
- 10.Philippot L, Raaijmakers JM, Lemanceau P, van der Putten WH. 2013. Going back to the roots: the microbial ecology of the rhizosphere. Nat Rev Microbiol 11:789–799. doi: 10.1038/nrmicro3109. [DOI] [PubMed] [Google Scholar]
- 11.Caporaso JG, Lauber CL, Walters WA, Berg-Lyons D, Lozupone CA, Turnbaugh PJ, Fierer N, Knight R. 2011. Global patterns of 16S rRNA diversity at a depth of millions of sequences per sample. Proc Natl Acad Sci U S A 108(Suppl 1):4516–4522. doi: 10.1073/pnas.1000080107. [DOI] [PMC free article] [PubMed] [Google Scholar]
- 12.Fierer N, Leff JW, Adams BJ, Nielsen UN, Bates ST, Lauber CL, Owens S, Gilbert JA, Wall DH, Caporaso JG. 2012. Cross-biome metagenomic analyses of soil microbial communities and their functional attributes. Proc Natl Acad Sci U S A 109:21390–21395. doi: 10.1073/pnas.1215210110. [DOI] [PMC free article] [PubMed] [Google Scholar]
- 13.Peiffer JA, Spor A, Koren O, Jin Z, Tringe SG, Dangl JL, Buckler ES, Ley RE. 2013. Diversity and heritability of the maize rhizosphere microbiome under field conditions. Proc Natl Acad Sci U S A 110:6548–6553. doi: 10.1073/pnas.1302837110. [DOI] [PMC free article] [PubMed] [Google Scholar]
- 14.Lundberg DS, Lebeis SL, Paredes SH, Yourstone S, Gehring J, Malfatti S, Tremblay J, Engelbrektson A, Kunin V, del Rio TG, Edgar RC, Eickhorst T, Ley RE, Hugenholtz P, Tringe SG, Dangl JL. 2012. Defining the core Arabidopsis thaliana root microbiome. Nature 488:86–90. doi: 10.1038/nature11237. [DOI] [PMC free article] [PubMed] [Google Scholar]
- 15.Bulgarelli D, Rott M, Schlaeppi K, Ver Loren van Themaat E, Ahmadinejad N, Assenza F, Rauf P, Huettel B, Reinhardt R, Schmelzer E, Peplies J, Gloeckner FO, Amann R, Eickhorst T, Schulze-Lefert P. 2012. Revealing structure and assembly cues for Arabidopsis root-inhabiting bacterial microbiota. Nature 488:91–95. doi: 10.1038/nature11336. [DOI] [PubMed] [Google Scholar]
- 16.Chaparro JM, Badri DV, Vivanco JM. 2014. Rhizosphere microbiome assemblage is affected by plant development. ISME J 8:790–803. doi: 10.1038/ismej.2013.196. [DOI] [PMC free article] [PubMed] [Google Scholar]
- 17.Webb CO, Ackerly DD, McPeek MA, Donoghue MJ. 2002. Phylogenies and community ecology. Annu Rev Ecol Syst 33:475–505. doi: 10.1146/annurev.ecolsys.33.010802.150448. [DOI] [Google Scholar]
- 18.DeAngelis KM, Brodie EL, DeSantis TZ, Andersen GL, Lindow SE, Firestone MK. 2009. Selective progressive response of soil microbial community to wild oat roots. ISME J 3:168–178. doi: 10.1038/ismej.2008.103. [DOI] [PubMed] [Google Scholar]
- 19.Schreiter S, Ding G-C, Heuer H, Neumann G, Sandmann M, Grosch R, Kropf S, Smalla K. 2014. Effect of the soil type on the microbiome in the rhizosphere of field-grown lettuce. Front Microbiol 5:144. doi: 10.3389/fmicb.2014.00144. [DOI] [PMC free article] [PubMed] [Google Scholar]
- 20.Li X, Rui J, Mao Y, Yannarell A, Mackie R. 2014. Dynamics of the bacterial community structure in the rhizosphere of a maize cultivar. Soil Biol Biochem 68:392–401. doi: 10.1016/j.soilbio.2013.10.017. [DOI] [Google Scholar]
- 21.Singh G, Mukerji KG. 2006. Root exudates as determinant of rhizospheric microbial biodiversity, p 39–54. In Mukerji KG, Manoharachary C, Singh J (ed), Microbial activity in the rhizosphere. Springer, Berlin, Germany. [Google Scholar]
- 22.Chaparro JM, Badri DV, Bakker MG, Sugiyama A, Manter DK, Vivanco JM. 2013. Root exudation of phytochemicals in Arabidopsis follows specific patterns that are developmentally programmed and correlate with soil microbial functions. PLoS One 8:e55731. doi: 10.1371/journal.pone.0055731. [DOI] [PMC free article] [PubMed] [Google Scholar]
- 23.Torsvik V, Øvreås L, Thingstad TF. 2002. Prokaryotic diversity—magnitude, dynamics, and controlling factors. Science 296:1064–1066. doi: 10.1126/science.1071698. [DOI] [PubMed] [Google Scholar]
- 24.Fierer N, Lennon JT. 2011. The generation and maintenance of diversity in microbial communities. Am J Bot 98:439–448. doi: 10.3732/ajb.1000498. [DOI] [PubMed] [Google Scholar]
- 25.Smalla K, Van Elsas JD. 2010. The soil environment, p 111–130. In Liu W-T, Jasson JK (ed), Environmental molecular microbiology. Caister Academic Press, Poole, Dorset, United Kingdom. [Google Scholar]
- 26.Leibold MA, McPeek MA. 2006. Coexistence of the niche and neutral perspectives in community ecology. Ecology 87:1399–1410. doi: 10.1890/0012-9658(2006)87[1399:COTNAN]2.0.CO;2. [DOI] [PubMed] [Google Scholar]
- 27.Costa R, Götz M, Mrotzek N, Lottmann J, Berg G, Smalla K. 2006. Effects of site and plant species on rhizosphere community structure as revealed by molecular analysis of microbial guilds. FEMS Microbiol Ecol 56:236–249. doi: 10.1111/j.1574-6941.2005.00026.x. [DOI] [PubMed] [Google Scholar]
- 28.Kowalchuk GA, Buma DS, de Boer W, Klinkhamer PG, van Veen JA. 2002. Effects of above-ground plant species composition and diversity on the diversity of soil-borne microorganisms. Antonie Van Leeuwenhoek 81:509–520. doi: 10.1023/A:1020565523615. [DOI] [PubMed] [Google Scholar]
- 29.Uroz S, Buée M, Murat C, Frey-Klett P, Martin F. 2010. Pyrosequencing reveals a contrasted bacterial diversity between oak rhizosphere and surrounding soil. Environ Microbiol Rep 2:281–288. doi: 10.1111/j.1758-2229.2009.00117.x. [DOI] [PubMed] [Google Scholar]
- 30.Hawkes CV, DeAngelis KM, Firestone MK. 2007. Root interactions with soil microbial communities and processes, p 1–31. In Cardon ZG, Whitbeck JL (ed), The rhizosphere: an ecological perspective. Elsevier Inc, New York, NY. [Google Scholar]
- 31.Fierer N, Bradford MA, Jackson RB. 2007. Toward an ecological classification of soil bacteria. Ecology 88:1354–1364. doi: 10.1890/05-1839. [DOI] [PubMed] [Google Scholar]
- 32.Goldfarb KC, Karaoz U, Hanson CA, Santee CA, Bradford MA, Treseder KK, Wallenstein MD, Brodie EL. 2011. Differential growth responses of soil bacterial taxa to carbon substrates of varying chemical recalcitrance. Front Microbiol 2:94. doi: 10.3389/fmicb.2011.00094. [DOI] [PMC free article] [PubMed] [Google Scholar]
- 33.Vandenkoornhuyse P, Mahé S, Ineson P, Staddon P, Ostle N, Cliquet J-B, Francez A-J, Fitter AH, Young JP. 2007. Active root-inhabiting microbes identified by rapid incorporation of plant-derived carbon into RNA. Proc Natl Acad Sci U S A 104:16970–16975. doi: 10.1073/pnas.0705902104. [DOI] [PMC free article] [PubMed] [Google Scholar]
- 34.Haichar FZ, Marol C, Berge O, Rangel-Castro JI, Prosser JI, Balesdent J, Heulin T, Achouak W. 2008. Plant host habitat and root exudates shape soil bacterial community structure. ISME J 2:1221–1230. doi: 10.1038/ismej.2008.80. [DOI] [PubMed] [Google Scholar]
- 35.Shi S, Condron L, Larsen S, Richardson AE, Jones E, Jiao J, O’Callaghan M, Stewart A. 2011. In situ sampling of low molecular weight organic anions from rhizosphere of Radiata pine (Pinus radiata) grown in a rhizotron system. Environ Exp Bot 70:131–142. doi: 10.1016/j.envexpbot.2010.08.010. [DOI] [Google Scholar]
- 36.Shi S, O’Callaghan M, Jones EE, Richardson AE, Walter C, Stewart A, Condron L. 2012. Investigation of organic anions in tree root exudates and rhizosphere microbial communities using in situ and destructive sampling techniques. Plant Soil 359:149–163. doi: 10.1007/s11104-012-1198-3. [DOI] [Google Scholar]
- 37.Lauber CL, Hamady M, Knight R, Fierer N. 2009. Pyrosequencing-based assessment of Soil pH as a predictor of soil bacterial community structure at the continental scale. Appl Environ Microbiol 75:5111–5120. doi: 10.1128/AEM.00335-09. [DOI] [PMC free article] [PubMed] [Google Scholar]
- 38.Kielak A, Pijl AS, van Veen JA, Kowalchuk GA. 2009. Phylogenetic diversity of acidobacteria in a former agricultural soil. ISME J 3:378–382. doi: 10.1038/ismej.2008.113. [DOI] [PubMed] [Google Scholar]
- 39.Nuccio E. 2013. Deconstructing the soil microbiome: elucidating the influence of roots and arbuscular mycorrhizae on soil microbial communities. Ph.D. thesis University of California, Berkeley, California. [Google Scholar]
- 40.Lennon JT, Aanderud ZT, Lehmkuhl BK, Schoolmaster DR. 2012. Mapping the niche space of soil microorganisms using taxonomy and traits. Ecology 93:1867–1879. doi: 10.1890/11-1745.1. [DOI] [PubMed] [Google Scholar]
- 41.Placella SA, Brodie EL, Firestone MK. 2012. Rainfall-induced carbon dioxide pulses result from sequential resuscitation of phylogenetically clustered microbial groups. Proc Natl Acad Sci U S A 109:10931–10936. doi: 10.1073/pnas.1204306109. [DOI] [PMC free article] [PubMed] [Google Scholar]
- 42.Philippot L, Andersson SG, Battin TJ, Prosser JI, Schimel JP, Whitman WB, Hallin S. 2010. The ecological coherence of high bacterial taxonomic ranks. Nat Rev Microbiol 8:523–529. doi: 10.1038/nrmicro2367. [DOI] [PubMed] [Google Scholar]
- 43.Barnard RL, Osborne CA, Firestone MK. 2013. Responses of soil bacterial and fungal communities to extreme desiccation and rewetting. ISME J 7:2229–2241. doi: 10.1038/ismej.2013.104. [DOI] [PMC free article] [PubMed] [Google Scholar]
- 44.Hawkes CV, Wren IF, Herman DJ, Firestone MK. 2005. Plant invasion alters nitrogen cycling by modifying the soil nitrifying community. Ecol Lett 8:976–985. doi: 10.1111/j.1461-0248.2005.00802.x. [DOI] [PubMed] [Google Scholar]
- 45.Hawkes CV, Belnap J, D’Antonio C, Firestone MK. 2006. Arbuscular mycorrhizal assemblages in native plant roots change in the presence of invasive exotic grasses. Plant Soil 281:369–380. doi: 10.1007/s11104-005-4826-3. [DOI] [Google Scholar]
- 46.Fierer N, Jackson JA, Vilgalys R, Jackson RB. 2005. Assessment of soil microbial community structure by use of taxon-specific quantitative PCR assays. Appl Environ Microbiol 71:4117–4120. doi: 10.1128/AEM.71.7.4117-4120.2005. [DOI] [PMC free article] [PubMed] [Google Scholar]
- 47.Kong Y. 2011. Btrim: a fast, lightweight adapter and quality trimming program for next-generation sequencing technologies. Genomics 98:152–153. doi: 10.1016/j.ygeno.2011.05.009. [DOI] [PubMed] [Google Scholar]
- 48.Magoč T, Salzberg SL. 2011. FLASH: fast length adjustment of short reads to improve genome assemblies. Bioinformatics 27:2957–2963. doi: 10.1093/bioinformatics/btr507. [DOI] [PMC free article] [PubMed] [Google Scholar]
- 49.Edgar RC, Haas BJ, Clemente JC, Quince C, Knight R. 2011. UCHIME improves sensitivity and speed of chimera detection. Bioinformatics 27:2194–2200. doi: 10.1093/bioinformatics/btr381. [DOI] [PMC free article] [PubMed] [Google Scholar]
- 50.Edgar RC. 2010. Search and clustering orders of magnitude faster than BLAST. Bioinformatics 26:2460–2461. doi: 10.1093/bioinformatics/btq461. [DOI] [PubMed] [Google Scholar]
- 51.Wang Q, Garrity GM, Tiedje JM, Cole JR. 2007. Naive Bayesian classifier for rapid assignment of rRNA sequences into the new bacterial taxonomy. Appl Environ Microbiol 73:5261–5267. doi: 10.1128/AEM.00062-07. [DOI] [PMC free article] [PubMed] [Google Scholar]
- 52.Price MN, Dehal PS, Arkin AP. 2010. FastTree 2—approximately maximum-likelihood trees for large alignments. PLoS One 5:e9490. doi: 10.1371/journal.pone.0009490. [DOI] [PMC free article] [PubMed] [Google Scholar]
- 53.Kembel SW, Cowan PD, Helmus MR, Cornwell WK, Morlon H, Ackerly DD, Blomberg SP, Webb CO. 2010. Picante: R tools for integrating phylogenies and ecology. Bioinformatics 26:1463–1464. doi: 10.1093/bioinformatics/btq166. [DOI] [PubMed] [Google Scholar]
- 54.Nuccio EE, Hodge A, Pett-Ridge J, Herman DJ, Weber PK, Firestone MK. 2013. An arbuscular mycorrhizal fungus significantly modifies the soil bacterial community and nitrogen cycling during litter decomposition. Environ Microbiol 15:1870–1881. doi: 10.1111/1462-2920.12081. [DOI] [PubMed] [Google Scholar]
- 55.Paradis E, Claude J, Strimmer K. 2004. APE: analyses of phylogenetics and evolution in R language. Bioinformatics 20:289–290. doi: 10.1093/bioinformatics/btg412. [DOI] [PubMed] [Google Scholar]
- 56.Anderson MJ. 2001. A new method for non-parametric multivariate analysis of variance. Austral Ecol 26:32–46. doi: 10.1046/j.1442-9993.2001.01070.x. [DOI] [Google Scholar]
- 57.Anderson MJ, Ellingsen KE, McArdle BH. 2006. Multivariate dispersion as a measure of beta diversity. Ecol Lett 9:683–693. doi: 10.1111/j.1461-0248.2006.00926.x. [DOI] [PubMed] [Google Scholar]
- 58.Anderson MJ. 2006. Distance-based tests for homogeneity of multivariate dispersions. Biometrics 62:245–253. doi: 10.1111/j.1541-0420.2005.00440.x. [DOI] [PubMed] [Google Scholar]
- 59.Oksanen JF, Blanchet G, Kindt R, Legendre P, Minchin PR, O’Hara RB, Simpson GL, Solymos PM, Stevens HH, Wagner H. 2013. vegan: community ecology package. Package version 20-10. R Project, Vienna, Austria. [Google Scholar]
Associated Data
This section collects any data citations, data availability statements, or supplementary materials included in this article.
Supplementary Materials
Detailed materials and methods. Download
Rarefaction curves of bulk/residual and rhizosphere bacterial communities of Avena grown in microcosms collected at five sampling points in two seasons. Shown are the mean rarefaction curves of each community (n = 16). The broken line indicates the rarefaction used for this study. Download
Relationship of variance in rhizosphere microbial community composition (distance to centroid, based on Bray distance) and variation in shoot biomass of Avena grown in microcosms collected at four time points (weeks 3, 6, 9, and 12) in season 1. Download
Numbers of dynamic taxa in Avena rhizosphere microbiome at different plant growth stages in both seasons. OTUs enriched in the rhizosphere (the abundance of OTUs increased significantly compared to the corresponding OTUs at week 0) are shown on the right panel of the figure, and the OTUs depleted in the rhizosphere are shown on the left panel. The top panel contains the most dominant phyla/classes of soil microbes, and the bottom panel contains the phyla/classes present in soil at lower concentrations. Download
ANOVA P values of each diversity index calculated based on Illumina MiSeq 16S sequencing in each growing season using a two-factor model (time and rhizosphere versus bulk soils) in paired samples (from same microcosm).
Adonis analysis of CO2 treatment effects (n = 8) on the overall structure of bulk soil and rhizosphere microbial community of Avena fatua analyzed by MiSeq 16S sequencing with the Bray distance metric.