

Abstract
Renal nitrogen metabolism primarily involves urea and ammonia metabolism, and is essential to normal health. Urea is the largest circulating pool of nitrogen, excluding nitrogen in circulating proteins, and its production changes in parallel to the degradation of dietary and endogenous proteins. In addition to serving as a way to excrete nitrogen, urea transport, mediated through specific urea transport proteins, mediates a central role in the urine concentrating mechanism. Renal ammonia excretion, although often considered only in the context of acid-base homeostasis, accounts for approximately 10% of total renal nitrogen excretion under basal conditions, but can increase substantially in a variety of clinical conditions. Because renal ammonia metabolism requires intrarenal ammoniagenesis from glutamine, changes in factors regulating renal ammonia metabolism can have important effects on glutamine in addition to nitrogen balance. This review covers aspects of protein metabolism and the control of the two major molecules involved in renal nitrogen excretion: urea and ammonia. Both urea and ammonia transport can be altered by glucocorticoids and hypokalemia, two conditions that also affect protein metabolism. Clinical conditions associated with altered urine concentrating ability or water homeostasis can result in changes in urea excretion and urea transporters. Clinical conditions associated with altered ammonia excretion can have important effects on nitrogen balance.
Keywords: renal physiology, acidosis, urea
Introduction
Nitrogen metabolism is necessary for normal health. Nitrogen is an essential element present in all amino acids; it is derived from dietary protein intake, is necessary for protein synthesis and maintenance of muscle mass, and is excreted by the kidneys. Under steady-state conditions, renal nitrogen excretion equals nitrogen intake. Renal nitrogen excretion consists almost completely of urea and ammonia. (To note, ammonia exists in two distinct molecular forms, NH3 and NH4+, which are in equilibrium with each other. In this review, we use the term ammonia to refer to the combination of both molecular forms. When referring to a specific molecular form, we state either NH3 or NH4+.) Other nitrogen compounds (e.g., nitric oxide metabolites, and nitrates) and many nitrogen-containing compounds (e.g., uric acid, urinary protein, etc.), comprise <1% of total renal nitrogen excretion. The two major components of renal nitrogen excretion, urea and ammonia, are regulated by a wide variety of conditions and play important roles in normal health and disease, including roles in the urine concentrating mechanism and in acid-base homeostasis. In this review, we discuss the mechanisms and regulation of both urea and ammonia handling in the kidneys, their roles in renal physiologic responses other than nitrogen excretion, and the clinical uses of urea production and metabolism.
Urea Introduction
Proteins throughout the body are continually turning over but at vastly different rates: consider the short half-lives of transcription factors versus the longer half-lives of structural proteins of muscle. To achieve such differences, there must be biochemical mechanisms that precisely identify proteins to be degraded plus mechanisms that efficiently degrade doomed proteins. The consequence is that these processes do not interfere with the turnover of proteins that are required to maintain cellular functions. The “how” and “why” of the biochemical reactions that are required for maintenance of cellular functions are being uncovered (1,2). Here, we will examine the overall metabolism and functions of urea. Knowledge of urea functions and metabolism is important because urea is the major circulating source of nitrogen-containing compounds and it plays important roles in regulating kidney function.
Foods rich in protein are converted to the 9 essential and 11 nonessential amino acids, as shown in the summary of overall protein metabolism in Figure 1. The difference between the two groups is that the essential amino acids cannot be synthesized in the body and, hence, they must be provided in the diet or proteins cannot be synthesized. Amino acids have two fates: (1) they can be used to synthesize protein, or (2) they are degraded in a monotonous fashion in which the α-amino group is removed and converted to urea in the liver. Not surprisingly, the production of urea is closely related to the amount of protein eaten; therefore, urea can be used to estimate whether a patient with CKD is receiving the required amounts of protein (3,4). In addition, urea production serves as an estimate of the accumulation of putative uremic toxins and, thus, as a guideline for management of the diets of patients with CKD.
Figure 1.

Overview of protein metabolism. Dietary protein intake can either be metabolized quickly to essential and nonessential amino acids or to metabolic waste products and ions. Essential and nonessential amino acids are interconvertible with body protein stores. Amino acids may also be metabolized through the liver to form urea, which is then excreted in the urine. Body protein stores can be converted back to essential and nonessential amino acids or may be metabolized, forming waste products and ions, which, as previously detailed, are excreted in the urine.
It has long been known that the amount of dietary protein affects renal function (5,6). For example, otherwise normal individuals who eat small amounts of protein have low GFR values (7). On the contrary, eating a large meal of protein transiently raises GFR (8). The role of a dietary protein–induced change in GFR as a contributor to the consequences of CKD is unclear because most patients with advanced CKD eat substantially more protein than recommended by the World Health Organization (9).
Urea Transport
The urea transporter (UT)-A1 protein is expressed in the apical plasma membrane of the terminal inner medullary collecting duct (IMCD) (10–12). It consists of 12 transmembrane-spanning domains connected by a cytoplasmic loop (Figures 2 and 3) (13). UT-A3 is the N-terminal half of UT-A1 and is also expressed in the IMCD, primarily in the basolateral membrane, but can be detected in the apical membrane after vasopressin stimulation (14,15). UT-A2 is the C-terminal half of UT-A1 and is expressed in the thin descending limb (11,15–17). UT-A4 is the N-terminal 25% of UT-A1 spliced to the C-terminal 25% (11). UT-B1 protein is expressed in red blood cells (11,16,17) and in nonfenestrated endothelial cells that are characteristic of descending vasa recta, especially in those that are external to collecting duct clusters (18).
Figure 2.

Urea transporters along the nephron. The cartoon and histology show the urea transporters (UT-A1/UT-A3, UT-A2, and UT-B1) along the nephron. UT-B1 is found chiefly in the vasa recta, UT-A2 is found in the thin descending limb of the loop of Henle, and UT-A1 (apical) and UT-A3 (basolateral) are found in the inner medullary collecting duct. Modified from reference 12, with permission.
Figure 3.

The four renal UT-A protein isoforms. UT-A1 is the largest protein containing 12 transmembrane helices. Helices 6 and 7 are connected by a large intracellular loop that recent studies have shown is crucial to the functional properties of UT-A1 (1). UT-A3 is the N-terminal half of UT-A1, whereas UT-A2 is the C-terminal half of UT-A1. UT-A4 is the N-terminal quarter of UT-A1 spliced to the C-terminal quarter. Modified from reference 13, with permission.
Urea Handling along the Nephron
Urea is filtered across the glomerulus and enters the proximal tubule. The concentration of urea in the ultrafiltrate is similar to plasma, so the amount of urea entering the proximal tubule is controlled by the GFR. In general, 30%–50% of the filtered load of urea is excreted. The urea concentration increases in the first 75% of the proximal convoluted tubule, where it reaches a value approximately 50% higher than plasma (11). This increase results from the removal of water, secondary to salt transport, and is maintained throughout the remainder of the proximal tubule. Urea transport across the proximal tubule is not regulated by vasopressin (also named antidiuretic hormone) but is increased with an increase in sodium transport.
There are two types of loops of Henle: long looped in the juxtamedullary nephrons and short looped in the cortical nephrons. The difference is that short-looped nephrons lack a thin ascending limb (Figure 4). All portions of short loops are permeable to urea, but the direction and magnitude of urea movement varies with the diuretic state of the animal (11). The urea concentration in the early distal tubule (at the end of the loop) can reach 7 times the plasma concentration in antidiuretic rats, higher than the concentration at the start of the loop. Therefore, the intervening segments support urea secretion under antidiuretic conditions. By contrast, during water diuresis, there is no difference in the proximal tubular movement of urea, whereas there is net reabsorption of urea in the short loops (11).
Figure 4.

Structure of the nephron. The cartoon depicts the cortex (top), outer medulla (middle), and inner medulla (bottom), showing the location of the various substructures of the nephron labeled as follows: 1, glomerulus; 2, proximal convoluted tubule; 3s and 3l, proximal straight tubule in the short-looped nephron (3s) and long looped nephron (3l); 4s and 4l, thin descending limb; 5, thin ascending limb; 6s and 6l, medullary thick ascending limb; 7, macula densa; 8, distal convoluted tubule; 9, cortical collecting duct; 10, outer medullary collecting duct; 11, initial inner medullary collecting duct; and 12, terminal inner medullary collecting duct. Modified from reference 11, with permission of the American Physiological Society.
Figure 5 summarizes urea permeabilities for the different nephron segments from rat kidney. The urea permeability of proximal convoluted tubules is higher than in proximal straight tubules. Thin descending limbs of short loops have a low urea permeability in the outer medulla, but there is a higher urea permeability in the long loops in the inner medulla. The increased intraluminal urea concentration in thin descending limbs results from a change in the urea:water ratio because of water loss. Although there are considerable differences in the absolute urea permeability values measured in different animals, it is generally agreed that urea is secreted into the lumen of thin limbs under antidiuretic conditions (11). In addition, the concentration of urea is increased by water reabsorption driven by the hypertonic medullary interstitium, which results from the movement of urea out of the IMCD.
Figure 5.

Measured urea permeabilities in the different nephron sections of a rat kidney. CCD, cortical collecting duct; DCT, distal convoluted tubule; IMCD, inner medullary collecting duct; mTAL, medullary thick ascending limb; OMCD, outer medullary collecting duct; PCT, proximal convoluted tubule; PST, proximal straight tubule; tAL, thin ascending limb; tDL, thin descending limb. Modified from reference 11, with permission of the American Physiological Society.
Urea concentration increases in thin ascending limbs (11) due to the gradient for urea secretion provided by urea reabsorption from the IMCD. The gradient decreases as thin ascending limbs ascend, and the driving force to move urea into the tubular lumen also decreases. The urea concentration reaches a level that is equi-osmolar with the surrounding interstitium by the beginning of the medullary thick ascending limb. In contrast with thin ascending limbs, thick ascending limbs have a lower urea permeability (11,16). However, there is an overall increase in urea concentration in the lumen from the beginning of the thick ascending limb to the distal convoluted tubule.
The distal convoluted tubule has a low urea permeability; however, some urea is reabsorbed in this segment so that the urea concentration decreases from approximately 110% of the filtered load to approximately 70% by the initial portion of the cortical collecting duct. Both the cortical and outer medullary collecting ducts have low urea permeabilities (11,16). By contrast, the IMCD has a high urea permeability, which is increased by vasopressin. There is extensive urea reabsorption from the IMCD lumen into the interstitium. The tubular fluid (urine) exiting the IMCD contains approximately 50% of the filtered load of urea.
Urine Concentrating Mechanism
Urea and urea transporters play key roles in the inner medullary processes for producing concentrated urine. Urea’s importance has been appreciated for nearly 8 decades, since Gamble et al. first described “an economy of water in renal function referable to urea” (19). Protein deprivation reduces maximal urine concentrating ability and is restored by urea infusion or correction of the protein malnutrition (11,16). Decreased maximal urine concentrating ability is present in several genetically engineered mice lacking different urea transporter(s), including UT-A1/A3, UT-A2, UT-B1, and UT-A2/B1 knockout mice (11,12,16). Thus, although the mechanism by which the inner medulla concentrates urine remains controversial, an effect derived from urea or urea transporters must play a role (11,16,17).
The most widely accepted mechanism for producing concentrated urine in the inner medulla is the passive mechanism hypothesis, proposed by Kokko and Rector (20) and Stephenson (21). The passive mechanism requires that the inner medullary interstitial urea concentration exceed the urea concentration in the lumen of the thin ascending limb. If an inadequate amount of urea is delivered to the deep inner medulla, urine concentrating ability is reduced because the chemical gradients necessary for passive NaCl reabsorption from the thin ascending limb cannot be established. The primary mechanism for urea delivery into the inner medullary interstitium is urea reabsorption from the terminal IMCD (22). Urea reabsorption is mediated by the UT-A1 and UT-A3 urea transporter proteins (11,16,17). Figure 2 shows the location of key urea transport proteins that are involved in urine concentration.
The UT-B1 urea transporter also plays an important role in urine concentration (11). UT-B1 protein is expressed in red blood cells and descending vasa recta (11). UT-B1 is the Kidd blood group antigen, a minor blood group antigen. People lacking UT-B1 are unable to concentrate their urine >800 mOsm/kg H2O, even after water deprivation and vasopressin administration (23). UT-B1 knockout mice also have a reduced maximal urine concentrating ability compared with wild-type mice (24). These data suggest that urea transport in red blood cells is important for efficient countercurrent exchange, which is necessary for maximal urinary concentration (25). As red blood cells descend into the medulla, they accumulate urea to stay in osmotic equilibrium with the medullary interstitium. As the red blood cells ascend in the ascending vasa recta, they need to lose urea. In the absence of UT-B1, the red blood cells are unable to lose urea quickly enough and take some of the urea out of the medulla and into the bloodstream, thereby reducing the efficiency of countercurrent exchange and urine concentrating ability (25).
Rapid Regulation of Urea Transporter Proteins
Vasopressin.
Vasopressin regulates both IMCD urea transporters UT-A1 and UT-A3. Vasopressin increases the phosphorylation and apical plasma membrane accumulation of UT-A1 and UT-A3 (14,26). Vasopressin phosphorylates serines 486 and 499 in UT-A1, and both must be mutated to eliminate vasopressin stimulation (27). Vasopressin increases urea transport, urea transporter phosphorylation, and apical plasma membrane accumulation through two cAMP-dependent pathways: protein kinase A and exchange protein activated by cAMP (28) (Figure 6). Genetically engineered mice lacking UT-A1 and UT-A3 have reduced urine concentrating ability, have reduced inner medullary interstitial urea content, and lack vasopressin-stimulated urea transport in their IMCDs (29).
Figure 6.

Urea transport across an IMCD cell. Vasopressin binds to the V2R, located on the basolateral plasma membrane, and activates the α subunit of the heterotrimeric G protein Gsα. Activation of the G protein stimulates AC to synthesize cAMP. The increase of intracellular cAMP stimulates several downstream proteins including PKA and Epac, which phosphorylate UT-A1 and increase its accumulation in the apical plasma membrane. Urea enters the IMCD cell through UT-A1 and exits on the basolateral plasma membrane via UT-A3. AC, adenylyl cyclase; Epac, exchange protein directly activated by cAMP; Gs, G protein stimulatory subunit; P, phosphate; PKA, protein kinase A; V2R, V2 vasopressin receptor. Modified from reference 13 with permission.
Hypertonicity.
Urea transport across the IMCD is regulated independently by hypertonicity (11,16,17). Urea permeability increases rapidly in perfused IMCDs when osmolality is increased, even in the absence of vasopressin (30,31). Vasopressin and hyperosmolality have an additive stimulatory effect on urea permeability (11,16,17). Hyperosmolality, similar to vasopressin, increases the phosphorylation and the plasma membrane accumulation of both UT-A1 and UT-A3 (14,26,32,33). However, hyperosmolality and vasopressin signal through different pathways: hyperosmolality via increases in protein kinase Cα and intracellular calcium, and vasopressin via increases in adenylyl cyclase (11,16,17). Hyperosmolality does not stimulate urea transport in protein kinase Cα knockout mice and they have a urine concentrating defect (31,34,35).
Long-Term Regulation of Urea Transporters
Vasopressin.
Vasopressin regulates the IMCD urea transporters in the long term through changes in protein abundance (11,16,17). Administering vasopressin for 2 weeks to rats that have a congenital lack of vasopressin, and, hence, central diabetes insipidus, increases UT-A1 protein abundance in the inner medulla (36). Suppressing endogenous vasopressin by water loading rats for 2 weeks decreases UT-A1 protein abundance (36). The increase in UT-A1 protein abundance after vasopressin administration matches the time course for the increase in inner medullary urea content after vasopressin administration to rats that have a congenital lack of vasopressin. UT-A3 protein expression is decreased in rats that are water loaded for 3 days and is increased in rats that are water restricted for 3 days. The effect of vasopressin on UT-B1 abundance is unclear because some studies show an increase and others show a decrease (11,16,17).
Low-Protein Diets.
Rats fed a low-protein diet for at least 2 weeks have a decrease in the fractional excretion of urea (37). This results, at least in part, from the functional expression of vasopressin-stimulated urea permeability in the initial IMCD, a segment in which it is not normally present, and an increase in UT-A1 protein abundance (11,16,17). The effect of a low-protein diet on the other urea transporters has not been studied.
Adrenal Steroids.
Glucocorticoids increase the fractional excretion of urea (38). Despite this increase, serum urea nitrogen (SUN) increases in patients given glucocorticoids. This indicates that the increase in urea excretion is insufficient to offset the increase in production in patients given glucocorticoids.
Adrenalectomy, which eliminates both glucocorticoids and mineralocorticoids, produces a urine concentrating defect, although the mechanism is unknown (11). Adrenalectomy increases UT-A1 protein abundance and urea permeability in rat terminal IMCDs (39). Administering dexamethasone to adrenalectomized rats decreases UT-A1 protein abundance and urea permeability (39). Both UT-A1 and UT-A3 protein abundances decrease in rats given dexamethasone (40). The decrease in urea transporters in dexamethasone-treated rats could explain the increase in the fractional excretion of urea because a reduction in urea transporter abundance could result in less urea being reabsorbed and, thus, more being excreted.
Administering mineralocorticoids to adrenalectomized rats also decreases UT-A1 protein abundance in the inner medulla (41). This decrease can be blocked by spironolactone, a mineralocorticoid receptor antagonist (41). Both mineralocorticoid and glucocorticoid hormones appear to work through their respective receptors because spironolactone does not block the decrease due to dexamethasone (41).
Acidosis.
Metabolic acidosis is a common complication of renal failure. Acidosis increases protein degradation and shifts the nitrogen and urea loads within the kidney (42). UT-A1 protein abundance increases in the inner medulla of acidotic rats, which may represent compensation for the loss of kidney concentrating ability (increase in urine volume and a decrease in urine osmolality) that occurs during acidosis (43).
Hypokalemia.
Prolonged hypokalemia can cause a decrease in urine concentrating ability (44). The abundance of UT-A1, UT-A3, and UT-B1 proteins in the inner medulla is reduced in rats fed a potassium-restricted diet (44,45). UT-A2 protein abundance was reduced in one study but increased in another (44,45). The reason for the different findings is unclear.
In summary, renal urea transport and urea transport proteins mediate a central role in the urine concentrating mechanism. Urine concentrating defects have been demonstrated in several urea transporter knockout mice (11,12,16). In many clinical conditions associated with altered urine concentrating ability or water homeostasis, changes in urea excretion and urea transporters may be contributory factors.
Ammonia
Physiologic Role for Ammonia
Kidneys mediate a central role in acid-base homeostasis through the combined functions of filtered bicarbonate reabsorption and new bicarbonate generation. Bicarbonate reabsorption is necessary for acid-base homeostasis, but it is not sufficient. New bicarbonate must be generated to replace the bicarbonate that buffered endogenous and exogenous acids. New bicarbonate generation involves urinary ammonia and titratable acid excretion. Ammonia excretion accounts for the majority of basal bicarbonate generation and changes in ammonia excretion are the primary response to acid-base disorders (Figure 7). Nitrogen excretion in the form of ammonia is approximately 10% of urea nitrogen excretion in basal conditions, but can increase 5- to 10-fold, enabling ammonia to have an important role in nitrogen balance.
Figure 7.

Responses of urinary ammonia and titratable acid excretion to exogenous acid loads. Normal humans were acid loaded, and changes in urinary ammonia and titratable acid excretion were determined on days 1, 3, and 5 of acid loading. Changes in urinary ammonia excretion are the quantitatively predominant response mechanism on each day, and continued to increase over the 5 days of the experiment. Titratable acid excretion is a minor component of the increase in net acid excretion, and peaks on day 1 of acid loading. Data calculated from reference 46.
Renal Ammonia Handling
Overview.
Renal ammonia metabolism differs in important ways from that of other renal solutes. Other renal solutes undergo net excretion, such that renal venous content is less than arterial content. Ammonia is fundamentally different. Almost all urinary ammonia is produced in the kidney (47), and renal venous ammonia exceeds arterial ammonia, meaning that the kidneys actually increase systemic ammonia. Ammonia undergoes a complex set of transport events in the kidney, which determines the proportion of ammonia generated that is excreted in the urine as ammonia nitrogen versus that which enters the renal capillaries and is transported to the systemic circulation through the renal veins.
Renal Ammoniagenesis.
Renal ammoniagenesis occurs primarily in the proximal tubule and glutamine is the primary substrate (48). In the proximal tubule, glutamine uptake occurs through the combination of the apical Na+-dependent neutral amino acid transporter-1, and the basolateral sodium-coupled neutral amino acid transporter-3 (SNAT3) (49). Changes in ammoniagenesis, such as during metabolic acidosis, are associated with changes in the expression of SNAT3, but not expression of apical Na+-dependent neutral amino acid transporter-1 (50). Ammoniagenesis primarily involves phosphate-dependent glutaminase, glutamate dehydrogenase, α-ketoglutarate dehydrogenase, and phosphoenolpyruvate carboxykinase (PEPCK) (47,51), and complete glutamine metabolism generates two NH4+ and two HCO3− ions per glutamine. The bicarbonate produced is then transported across the basolateral membrane via electrogenic sodium-coupled bicarbonate co-transporter, isoform 1A (NBCe-1A), and serves as “new bicarbonate” generated by the kidney.
Ammonia Transport Overview
Only approximately 50% of the ammonia produced is excreted in urine under basal conditions. The remaining ammonia enters the systemic circulation through the renal veins. Ammonia that enters the systemic circulation undergoes almost complete metabolism in the liver; the major metabolic pathway uses HCO3− as a substrate, and generates urea. Consequently, ammonia produced in the kidney, transported to the systemic circulation, and metabolized in the liver to urea has no net acid-base benefit.
The proportion of the ammonia produced that is excreted in the urine, as opposed to being transported into the systemic circulation, can be rapidly altered. This enables changes in urinary ammonia to exceed, at least acutely, changes in ammoniagenesis (52). In most chronic acid-base disturbances, changes in ammoniagenesis account for the majority of the changes in urinary ammonia content (47). Importantly, renal epithelial cell ammonia transport determines the proportion of ammonia excreted in the urine.
Ammonia Transport.
Ammonia produced in the proximal tubule is secreted preferentially into the luminal fluid (Figure 8). This appears to involve NH4+ secretion by the apical NHE3; there may also be a component of parallel H+ and NH3 secretion (53–55). Conditions associated with NHE3 activation, such as metabolic acidosis and hypokalemia, also increase ammonia secretion (54).
Figure 8.

Model of proximal ammonia transport. Glutamine serves as the primary metabolic substrate for ammoniagenesis. Proximal tubule glutamine uptake involves transport across the apical membrane, primarily via BoAT-1, and across the basolateral membrane by SNAT3. Complete metabolism of each glutamine results in generation of two NH4+ and two bicarbonate ions. Bicarbonate is transported across the basolateral membrane via NBCe-1A. Ammonium secretion across the apical membrane occurs primarily via NHE3-mediated Na+/NH4+ exchange, with a lesser contribution by parallel H+ and NH3 transport. BoAT-1, apical Na+-dependent neutral amino acid transporter-1; NBCe-1A, electrogenic sodium-bicarbonate cotransporter, isoform 1A; NHE3, sodium/hydrogen exchanger 3; SNAT3, sodium-coupled neutral amino acid transporter-3.
In the loop of Henle, ammonia reabsorption occurs, with the major transport site being the medullary thick ascending limb. Ammonia is reabsorbed in the form of NH4+ primarily via the apical, loop diuretic-sensitive transporter, NKCC2 (Figure 9). Although other NH4+ transporters are present, their quantitative contribution is much less. Ammonia is then transported across the basolateral membrane, largely via the basolateral sodium-hydrogen exchanger NHE4 (56). NH4+ transport across the apical membrane, because NH4+ is a weak acid, causes intracellular acidification (57) which can inhibit ammonia reabsorption; bicarbonate entry via the basolateral electroneutral sodium-bicarbonate cotransporter, isoform 1 (NBCn1) appears to buffer this intracellular acidification and enable continued ammonia reabsorption (58). The net result is an axial interstitial ammonia gradient, with the highest levels in the inner medulla, the intermediate levels in the outer medulla and the lowest levels in the renal cortex.
Figure 9.

Ammonia reabsorption by the thick ascending limb. Primary mechanism of apical ammonium absorption is via substitution of NH4+ for K+ and transport by the loop diuretic-sensitive, apical NKCC2 transporter. Cytoplasmic NH4+ is transported across the basolateral membrane either via Na+/NH4+ exchange mediated by NHE4 or via a bicarbonate shuttling mechanism involving NH3 transport. NBCn1, electroneutral sodium bicarbonate cotransporter, isoform 1; NHE4, sodium/hydrogen exchanger 4.
Ammonia is then secreted by the collecting duct (Figure 10). Collecting duct ammonia secretion involves parallel H+ and NH3 secretion (59). NH3 secretion appears to involve transport by the Rhesus glycoproteins Rhbg and Rhcg, ammonia-specific transporters expressed in the collecting duct (60–62). Basolateral Na+-K+-ATPase contributes to IMCD ammonia secretion through its ability to transport NH4+ (63). Apical H+ secretion involves both H+-ATPase and H+-K+-ATPase.
Figure 10.

Ammonia secretion by the collecting duct. Ammonia uptake across the basolateral membrane primarily involves either transporter-mediated uptake across the basolateral membrane by Rhbg or Rhcg, with a component of diffusive NH3 absorption. Cytosolic NH3 is transported across the apical membrane by a combination of Rhcg and diffusive transport. In the IMCD, but not the CCD, basolateral Na+-K+-ATPase also contributes to NH4+ uptake across the basolateral membrane. Cytosolic H+ is generated by a carbonic anhydrase II–mediated mechanism, and is secreted across the apical membrane via H+-ATPase and H+-K+-ATPase. Luminal H+ titrates luminal NH3, forming NH4+ and maintaining a low luminal NH3 concentration necessary for NH3 secretion. CAII, carbonic anhydrase isoform II; Rhbg, Rhesus B glycoprotein; Rhcg, Rhesus C glycoprotein.
An important recent addition to our understanding of ammonia transport is the identification that sulfatides (highly charged, anionic glycosphingolipids) are important for maintaining papillary ammonium concentration and for urinary ammonia excretion during metabolic acidosis (64). Their expression is highest in the inner medulla, intermediate in the outer medulla, and lowest in the cortex. They appear to bind NH4+ reversibly, facilitating development of the axial ammonia gradient and ammonia excretion. Figure 11 shows an integrated view of renal ammonia metabolism.
Figure 11.
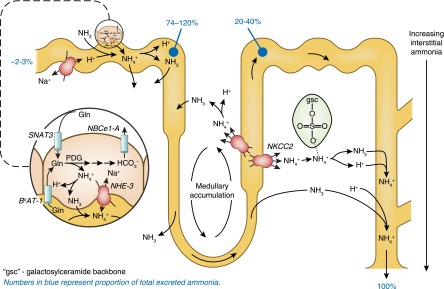
Integrated overview of renal ammonia metabolism. Renal ammoniagenesis occurs primarily in the proximal tubule, involving glutamine uptake by SNAT3 and BoAT-1, glutamine metabolism forming ammonium and bicarbonate, and apical NH4+ secretion involving NHE3 and parallel H+ and NH3 transport. Ammonia reabsorption in the thick ascending limb, involving apical NKCC2-mediated uptake results in medullary ammonia accumulation. Medullary sulfatides (highlighted in green) reversibly bind NH4+, contributing to medullary accumulation. Ammonia is secreted in the collecting duct via parallel H+ and NH3 secretion. The numbers in blue represent the proportion of total excreted ammonia. BoAT-1, apical Na+-dependent neutral amino acid transporter-1; gsc, galactosylceramide backbone; PDG, phosphate-dependent glutaminase.
Regulation of Ammonia Metabolism
Metabolic Acidosis.
The primary mechanism by which the kidneys increase net acid excretion in response to metabolic acidosis is through increased ammonia metabolism. Almost every component of ammonia metabolism is increased, including SNAT3, phosphate-dependent glutaminase, glutamate dehydrogenase, PEPCK, NKCC2, NHE4, Rhbg, and Rhcg (51). This integrated response increases renal glutamine uptake, ammoniagenesis, generation of new bicarbonate, and ammonia excretion in urine.
To understand the effect of ammonia metabolism on nitrogen balance, it is important to consider the metabolic source of the glutamine used for ammoniagenesis. Renal ammoniagenesis averages approximately 60–80 mmol/d in humans under basal conditions, and can increase, assuming renal ammonia excretion is approximately 50% of total ammonia production, to approximately 3–400 mmol/d. Because each glutamine metabolized generates two NH4+ molecules, approximately 150–200 mmol/d of glutamine is necessary to support maximal rates of ammoniagenesis. During metabolic acidosis, acidosis stimulates skeletal muscle protein degradation that, coupled with hepatic glutamine synthesis, increases extrarenal glutamine production. This enables unchanged plasma glutamine levels despite substantial increases in renal glutamine uptake (65).
This role of skeletal muscles in metabolic acidosis has important clinical significance. Metabolic acidosis decreases skeletal muscle mass and it increases ammonia nitrogen excretion, which can cause negative nitrogen balance (65). Correction of the metabolic acidosis associated with CKD improves nitrogen balance, plasma albumin, skeletal muscle size, and skeletal muscle strength (66,67).
Hypokalemia.
Hypokalemia is a second condition associated with altered renal ammonia metabolism. Indeed, the increased bicarbonate generation contributes to the metabolic alkalosis often seen with hypokalemia. In addition, in adults on an otherwise adequate, but low-protein, diet, hypokalemia-induced increases in ammonia excretion can cause negative nitrogen balance (68). In children with a low but otherwise adequate protein intake, hypokalemia reduces the total body nitrogen retention necessary for normal protein synthesis and impairs growth due to increased nitrogen excretion in the form of ammonia (68).
Glucocorticoid Hormones.
Glucocorticoid hormones regulate approximately 70% of basal and 50%–70% of acidosis-stimulated ammonia excretion (69,70). Their role appears to involve regulation of SNAT3, PEPCK, and NHE3 (71–74). In addition, glucocorticoids contribute to acidosis-induced skeletal muscle protein degradation (65), which by contributing to extrarenal glutamine production, enables maintenance of normal plasma glutamine levels (70). Thus, glucocorticoid hormones have an important role in nitrogen balance mediated, in part, through their effects on ammonia metabolism.
Protein Intake.
Dietary protein intake has important effects on renal ammonia metabolism. In general, high-protein diets, particularly if high in sulfur-containing amino acids, increase endogenous acid production, causing a parallel increase in ammonia excretion, whereas low-protein diets decrease ammonia excretion (75,76). Because ammonia nitrogen excretion changes parallel dietary nitrogen changes, net nitrogen balance does not change.
However, the clinician should remember that urinary ammonia averages only approximately 50% of total renal ammonia production, and that a similar amount enters the systemic circulation via the renal veins. Thus, after protein intake, increased renal vein ammonia content can increase plasma ammonia levels (77). In patients with impaired hepatic function, this can either precipitate or worsen hepatic encephalopathy. Similarly, the protein load from red cell breakdown resulting from gastrointestinal bleeding can increase renal ammoniagensis, leading to increased renal vein ammonia, which may contribute to development or worsening of hepatic encephalopathy (78).
Urea Production and Metabolism
Clinical Uses
Uremic symptoms are principally due to the accumulation of ions and toxic compounds in body fluids (79). Because protein-rich foods are the major source of these waste products, CKD can be considered a condition of protein intolerance. Indeed, it has been known since at least 1869 that restricting the amount of protein in the diet of patients with kidney diseases improves their uremic symptoms (80). More recently, we learned that dialysis efficacy is reflected in the removal of urea because changes in urea accumulation reflect changes in accumulated metabolic waste products. Again, this is not a new concept: The link between dietary protein and urea has been recognized since at least 1905, when Folin reported that urea excretion varies directly with different levels of dietary protein (81). These relationships were elegantly documented by Cottini et al. (Figure 12), who fed patients with CKD different amounts of protein (expressed on the abscissa as nitrogen intake because 16% of protein is nitrogen) (82). With low levels of dietary protein (e.g., approximately 12 g protein/d equivalent to approximately 2.5 g nitrogen), nitrogen balance was negative, indicating that this level of dietary protein causes progressive loss of protein stores. When the diet was raised >4 g nitrogen/d, nitrogen balance became positive, signifying that protein stores were being maintained. With progressively more dietary protein, nitrogen balance remained positive but changed minimally. Instead, when dietary protein was above the level required to maintain nitrogen balance and protein stores, it was used to make urea. Clearly, urea production reflects the level of protein in the diet and the risk of developing complications of uremia. In addition, a high-protein diet invariably contains excesses of salt, potassium, phosphates, and so forth (83). The clinical problems that arise from high-protein diets in patients with CKD were recently highlighted in reports concluding that increases in salt intake or serum phosphorus will block the beneficial influence of angiotensin-converting enzyme inhibitors to delay the progression of CKD (84,85).
Figure 12.

Urea excretion in adult humans with varying degrees of kidney malfunction fed milk, egg, or an amino acid mixture: assessment of nitrogen balance. Modified from reference 82, with permission.
Urea has special properties that can be used to evaluate the severity of uremia or the degree of compliance with prescribed changes in the diet. These properties include the following: (1) a very large capacity for hepatic urea production from amino acids, (2) urea is the major circulating pool of nitrogen and it crosses cell membranes readily so there is no gradient from intracellular to extracellular fluid under steady-state conditions, and (3) the volume of distribution of urea is the same as water (the urea space is estimated as 60% of body weight) (86–88).
One clinically useful calculation is the steady-state SUN (SSUN), which reflects the severity of uremia because it estimates the degree of accumulation of protein-derived waste products. The SSUN calculation is useful because uremic symptoms are unusual when SSUN is <70 mg/dl.
The requirements for the calculation are that the patient with CKD is in the steady state (i.e., his or her SUN and weight are stable) and urea clearance in liters per day is known. Using the equation below, the amount of dietary protein that will yield a SSUN of 70 mg/dl can be calculated as:
 |
The following steps are used to calculate the SSUN. First, the prescribed dietary protein in grams per day is converted into dietary nitrogen by multiplying the grams per day of dietary protein by 16%. Second, the nonurea nitrogen in grams of nitrogen excreted per day is calculated as the excretion of all forms of nitrogen except urea. This amount is approximated as 0.031 g nitrogen/kg per day multiplied by the nonedematous, ideal body weight (4,89). Third, the nonurea nitrogen is subtracted from the nitrogen intake to obtain the amount of urea nitrogen that must be excreted each day in the steady state. Finally, dividing the urea nitrogen excretion in grams per day by the urea clearance in liters per day yields the SSUN in grams per liter.
For example, consider a 70-kg adult with a urea clearance of 14.4 L/d (or 10 ml/min) who is eating 76 g protein/d. His SSUN (in grams per liter) is calculated from the following: 12.2 g/d dietary nitrogen−(0.031 g nitrogen/kg per day times 70 kg). The result is divided by the urea clearance in liters per day and multiplied by 100 to convert SSUN 0.69 g/L to 69 mg/dl.
This calculation arises from the demonstration that in the steady state, the production of urea is directly proportional to the daily protein intake (Figure 12). The only other assumption is that urea clearance is independent of the plasma urea concentration, which is reasonable for patients with CKD. The key concept is that steady-state concentrations of nitrogen-containing waste product produced during protein catabolism will increase in parallel to an increase in the SSUN (4,82,89). By varying the amount of dietary protein, changes in the diet can be integrated with different values of the SSUN. As shown in Table 1, similar concepts can be used to determine whether a patient is complying with the prescribed protein content of the diet (81,86,88).
Table 1.
Estimation of protein intake from urea metabolism
| A 60-year-old man with stage 5 CKD is admitted to the hospital for plastic surgery. He weighs 70 kg and has been taught to follow a diet containing 40 g protein/d (6.4 g nitrogen/d because protein is 16% nitrogen). He excretes 4 g urea nitrogen/d, but on day 2 his BUN rises from 50 to 60 mg/dl. |
| • The increase in BUN signifies accumulation of urea nitrogen in body water (70 kg x 0.6 L/kg x 0.1 g urea nitrogen/L = 4.2 g urea nitrogen/d). |
| • His NUN is 70 kg x 0.031 g nitrogen/kg per day = 2.17 g nitrogen/d. |
| • The total nitrogen excreted and accumulated is approximately 10 g/d (4 g urea nitrogen excreted/d +2.17 g NUN/d + 4.2 g urea nitrogen accumulated/d = 10.3 g nitrogen/d). |
| • Because his nitrogen excretion substantially exceeds the dietary nitrogen of 6.4 g/d, he requires a consultation with a nutrition/dietician and testing for gastrointestinal bleeding |
SUN, serum urea nitrogen; NUN, nonurea nitrogen excretion.
These examples emphasize that the net production of urea in patients with CKD (also known as the urea appearance rate) can be used to estimate protein intake (4,82,89). For dialysis patients, the same relationships have been labeled as “urea generation” or the “normalized protein catabolic rate” (nPCR). Obviously, the nPCR equals the net urea production rate or the urea appearance rate except that it is not expressed per kilogram of body weight. However, the designation nPCR is misleading because the rates of protein synthesis and “catabolism” are far greater than the protein catabolic rate: The nitrogen flux in protein synthesis and degradation amounts to 45–55 g nitrogen/d, equivalent to 280–350 g protein/d (1). The principle of conservation of mass, however, indicates the difference between whole-body protein synthesis and degradation does estimate waste nitrogen production.
Urea Nitrogen Reutilization
Discussion of urea metabolism would be incomplete without addressing urea degradation. It is calculated from the plasma disappearance of injected [14C]urea or [15N]urea (88,90) and averages about 3.6 g nitrogen/d in both normal individuals and patients with uremia. The 3.6 g nitrogen/d arises from degradation of urea by ureases of gastrointestinal bacteria thereby supplying ammonia directly to the liver (88). Because this source of nitrogen could be used to synthesize amino acids and ultimately protein, the degradation of urea has been intensively studied (91). The evidence negates the hypothesis that urea degradation is nutritionally important. First, the amount of urea degraded has been expressed as an extrarenal urea clearance by dividing the rate of urea degradation by the SSUN. In normal adults, the extrarenal urea clearance averages approximately 24 L/d; if this value were present in patients with CKD and a high SUN, the amount of ammonia derived from urea would be very high (79,88). However, the quantity of ammonia arising from urea in patients with CKD is not significantly different from that of normal individuals, indicating that the extrarenal clearance of urea in patients with CKD must be greatly reduced; the mechanism for this observation is unknown (88).
Results from other testing strategies lead to the conclusion that it is unlikely that urea degradation contributes a nutritionally important source of amino acids to synthesize protein. We fed patients with CKD a protein-restricted diet and measured the turnover of urea using [14C]urea. The results were compared with those obtained in a second experiment in which patients received neomycin/kanamycin as nonabsorbable antibiotics in order to inhibit bacteria that were degrading urea. In roughly half of the patients, antibiotic administration blocked urea degradation but there was no associated increase in urea appearance. This result means that ammonia arising from degradation is simply recycled into urea production and hence does not change urea appearance (90). We also addressed the hypothesis that removal of nitrogen released by urea degradation would suppress synthesis of amino acids and thereby worsen Bn. In this case, the hypothesis was rejected because inhibiting urea degradation with nonabsorbable antibiotics actually improved Bn (92). Finally, Varcoe et al. measured the turnover of urea and albumin simultaneously and concluded that the contribution of urea degradation to albumin synthesis was minimal (93).
The possibility that ammonia from urea degradation is used to synthesize amino acids was recently examined in hibernating bears (94). The authors noted that hibernating bears have very low values of SSUN (approximately 5–10 mg/dl) despite a decrease in GFR and they suggested that SSUN was low because urea was being used to synthesize amino acids. This finding would contribute to another oddity of hibernating bears, namely that their muscle mass and other stores of protein are relatively “spared” from degradation. Why the metabolism of hibernating bears might differ from that of patients with CKD is unknown and we applaud the investigators who gathered the information as experimenting on bears is quite tricky, even if they are hibernating.
Is Urea Toxic?
Because excess dietary protein produces uremic symptoms and because urea is the major source of circulating nitrogen, the potential for toxic responses to urea have been investigated using different experimental designs. Johnson et al. added urea to the dialysate of hemodialysis patients who were otherwise well dialyzed (95). Complications induced by the added urea were minimal until the SSUN was chronically >150–200 mg/dl. This led to gastrointestinal irritation. There was no investigation of ammonia or inhibitors of urea degradation so the effect of urea can only be considered an association. An indirect evaluation of both mice with CKD and cultured cells revealed that urea may stimulate the production of reactive oxygen species. Reddy et al. concluded that a high SUN not only increased reactive oxygen species but also caused insulin resistance (96). However, it is difficult to assign insulin resistance to a single factor considering that there are so many uremia-induced complex metabolic pathways (97,98). It will be interesting to evaluate whether the production of reactive oxygen species initiates similar events in patients with CKD.
Another potential role of urea in producing uremia-induced toxicity is through the development of protein carbamylation, which could disrupt the structure of a protein interfering with signaling pathways and so forth. Stim et al. reported that the rate of carbamylation of hemoglobin increased in parallel with the increase in SUN and that carbamylation was significantly higher in patients with ESRD compared with normal individuals (99). These responses were confirmed by Berg et al. (100) except that the carbamylated protein was albumin, rather than hemoglobin. Thus, carbamylation of several proteins can occur in uremic individuals but whether this produces toxic reactions has not been defined.
Finally, there are patient-based reports that cast doubt on the hypothesis that urea is a toxin. Hsu et al. studied a man and a woman from a family of patients who had chronic but unexplained azotemia. Results of the evaluation indicated that the high SUN arose from a autosomal dominant genetic defect in urea reabsorption (101). Kidney function of the two participants revealed subnormal urea clearances but otherwise normal values of inulin clearance, urea excretion, and responses of urea clearance to diuresis and antidiuresis plus normal sodium clearances. Although the mechanism for the familial azotemia was not identified, the report is relevant because the participants had no clinical or laboratory findings attributable to the increase in SUN despite years of values varying from 49 to 65 mg/dl and from 55 to 60 mg/dl, respectively. In another case study, Richards and Brown studied a woman with prolonged azotemia to examine the association between a high SUN and the development of uremic symptoms (102). The participant subsisted on a diet consisting primarily of fish and a protein powder, yielding urea nitrogen production rates of 40–50 g/d for years. Although the participant maintained a SUN of 50–80 mg/dl for years, she had normal values of hemoglobin, plasma creatinine, BP, and no weight loss. Together, these reports indicate that even a prolonged increase in the concentration of urea does not produce toxic reactions, at least in patients with normal kidney function.
Urea is the largest circulating pool of nitrogen and its production changes in parallel to the degradation of dietary and endogenous proteins. These facts and other properties of urea can be used to estimate the degree of uremia and the compliance with prescribed amounts protein in the diet. The available evidence in patients with CKD suggests that reutilization of ammonia derived from urea degradation for the synthesis of amino acids and proteins is minimal. Whether the evidence would be more persuasive under extreme conditions, such as in hibernating bears, is unknown. The ability of urea to create toxicity is unsettled but years of high SUN values do not produce toxic reactions in individuals with otherwise normal kidney function.
In conclusion, renal urea and ammonia metabolism mediate critical roles in nitrogen balance, urine concentration, and acid-base homeostasis. In this review, we evaluated critical processes involved in these homeostatic mechanisms. Abnormal urea and ammonia metabolism both result from and can lead to a wide variety of conditions, including methods for evaluating issues that are critical to caring for patients with impaired renal function.
Disclosures
None.
Acknowledgments
The preparation of this review was supported by funds from the National Institutes of Health (R37-DK037175 to W.E.M., R01-DK045788 to I.D.W., and R01-DK089828 and R21-DK091147 to J.M.S.) and the US Department of Veterans Affairs (1I01BX000818 to I.D.W.).
Footnotes
Published online ahead of print. Publication date available at www.cjasn.org.
References
- 1.Mitch WE, Goldberg AL: Mechanisms of muscle wasting. The role of the ubiquitin-proteasome pathway. N Engl J Med 335: 1897–1905, 1996 [DOI] [PubMed] [Google Scholar]
- 2.Lecker SH, Mitch WE: Proteolysis by the ubiquitin-proteasome system and kidney disease. J Am Soc Nephrol 22: 821–824, 2011 [DOI] [PubMed] [Google Scholar]
- 3.Franch HA, Mitch WE: Navigating between the Scylla and Charybdis of prescribing dietary protein for chronic kidney diseases. Annu Rev Nutr 29: 341–364, 2009 [DOI] [PubMed] [Google Scholar]
- 4.Maroni BJ, Steinman TI, Mitch WE: A method for estimating nitrogen intake of patients with chronic renal failure. Kidney Int 27: 58–65, 1985 [DOI] [PubMed] [Google Scholar]
- 5.Addis T: The ratio between the urea content of the urine and of the blood after the administration of large quantities of urea: An approximate index of the quantity of actively functioning kidney tissue. J Urol 1: 263–287, 1917 [Google Scholar]
- 6.Addis T, Lippman RW, Lew W, Poo LJ, Wong W: Effect of dietary protein consumption upon body growth and organ size in the rat. Am J Physiol 165: 491–496, 1951 [DOI] [PubMed] [Google Scholar]
- 7.Sitprija V, Suvanpha R: Low protein diet and chronic renal failure in Buddhist monks. Br Med J (Clin Res Ed) 287: 469–471, 1983 [DOI] [PMC free article] [PubMed] [Google Scholar]
- 8.Hostetter TH: Human renal response to meat meal. Am J Physiol 250: F613–F618, 1986 [DOI] [PubMed] [Google Scholar]
- 9.Moore LW, Byham-Gray LD, Scott Parrott J, Rigassio-Radler D, Mandayam S, Jones SL, Mitch WE, Osama Gaber A: The mean dietary protein intake at different stages of chronic kidney disease is higher than current guidelines. Kidney Int 83: 724–732, 2013 [DOI] [PubMed] [Google Scholar]
- 10.Bagnasco SM, Peng T, Janech MG, Karakashian A, Sands JM: Cloning and characterization of the human urea transporter UT-A1 and mapping of the human Slc14a2 gene. Am J Physiol Renal Physiol 281: F400–F406, 2001 [DOI] [PubMed] [Google Scholar]
- 11.Klein JD, Blount MA, Sands JM: Urea transport in the kidney. Compr Physiol 1: 699–729, 2011 [DOI] [PubMed] [Google Scholar]
- 12.Klein JD, Blount MA, Sands JM: Molecular mechanisms of urea transport in health and disease. Pflugers Arch 464: 561–572, 2012 [DOI] [PMC free article] [PubMed] [Google Scholar]
- 13.Blount MA, Klein JD, Sands JM: UT (Urea Transporter). In: Encyclopedia of Signaling Molecules, edited by Choi S, New York, Springer, 2012, pp 1945–1953 [Google Scholar]
- 14.Blount MA, Klein JD, Martin CF, Tchapyjnikov D, Sands JM: Forskolin stimulates phosphorylation and membrane accumulation of UT-A3. Am J Physiol Renal Physiol 293: F1308–F1313, 2007 [DOI] [PubMed] [Google Scholar]
- 15.Terris JM, Knepper MA, Wade JB: UT-A3: Localization and characterization of an additional urea transporter isoform in the IMCD. Am J Physiol Renal Physiol 280: F325–F332, 2001 [DOI] [PubMed] [Google Scholar]
- 16.Sands JM, Layton HE: The urine concentrating mechanism and urea transporters. In: Seldin and Giebisch's The Kidney: Physiology and Pathophysiology, edited by Alpern RJ, Caplan MJ, Moe OW, San Diego, Academic Press, 2013, pp 1463–1510 [Google Scholar]
- 17.Sands JM, Layton HE, Fenton RA: Urine concentration and dilution. In: Brenner and Rector's The Kidney, edited by Taal M, Chertow GM, Marsden PA, Skorecki K, Yu A, Brenner BM, Philadelphia, Elsevier, 2011, pp 326–352 [Google Scholar]
- 18.Pannabecker TL, Dantzler WH, Layton HE, Layton AT: Role of three-dimensional architecture in the urine concentrating mechanism of the rat renal inner medulla. Am J Physiol Renal Physiol 295: F1271–F1285, 2008 [DOI] [PMC free article] [PubMed] [Google Scholar]
- 19.Gamble JL, McKhann CF, Butler AM, Tuthill E: An economy of water in renal function referable to urea. Am J Physiol 109: 139–154, 1934 [Google Scholar]
- 20.Kokko JP, Rector FC, Jr: Countercurrent multiplication system without active transport in inner medulla. Kidney Int 2: 214–223, 1972 [DOI] [PubMed] [Google Scholar]
- 21.Stephenson JL: Concentration of urine in a central core model of the renal counterflow system. Kidney Int 2: 85–94, 1972 [DOI] [PubMed] [Google Scholar]
- 22.Sands JM, Knepper MA: Urea permeability of mammalian inner medullary collecting duct system and papillary surface epithelium. J Clin Invest 79: 138–147, 1987 [DOI] [PMC free article] [PubMed] [Google Scholar]
- 23.Sands JM, Gargus JJ, Fröhlich O, Gunn RB, Kokko JP: Urinary concentrating ability in patients with Jk(a-b-) blood type who lack carrier-mediated urea transport. J Am Soc Nephrol 2: 1689–1696, 1992 [DOI] [PubMed] [Google Scholar]
- 24.Yang B, Bankir L, Gillespie A, Epstein CJ, Verkman AS: Urea-selective concentrating defect in transgenic mice lacking urea transporter UT-B. J Biol Chem 277: 10633–10637, 2002 [DOI] [PubMed] [Google Scholar]
- 25.Macey RI: Transport of water and urea in red blood cells. Am J Physiol 246: C195–C203, 1984 [DOI] [PubMed] [Google Scholar]
- 26.Zhang C, Sands JM, Klein JD: Vasopressin rapidly increases phosphorylation of UT-A1 urea transporter in rat IMCDs through PKA. Am J Physiol Renal Physiol 282: F85–F90, 2002 [DOI] [PubMed] [Google Scholar]
- 27.Blount MA, Mistry AC, Fröhlich O, Price SR, Chen G, Sands JM, Klein JD: Phosphorylation of UT-A1 urea transporter at serines 486 and 499 is important for vasopressin-regulated activity and membrane accumulation. Am J Physiol Renal Physiol 295: F295–F299, 2008 [DOI] [PMC free article] [PubMed] [Google Scholar]
- 28.Wang Y, Klein JD, Blount MA, Martin CF, Kent KJ, Pech V, Wall SM, Sands JM: Epac regulates UT-A1 to increase urea transport in inner medullary collecting ducts. J Am Soc Nephrol 20: 2018–2024, 2009 [DOI] [PMC free article] [PubMed] [Google Scholar]
- 29.Fenton RA, Chou CL, Stewart GS, Smith CP, Knepper MA: Urinary concentrating defect in mice with selective deletion of phloretin-sensitive urea transporters in the renal collecting duct. Proc Natl Acad Sci U S A 101: 7469–7474, 2004 [DOI] [PMC free article] [PubMed] [Google Scholar]
- 30.Sands JM, Schrader DC: An independent effect of osmolality on urea transport in rat terminal inner medullary collecting ducts. J Clin Invest 88: 137–142, 1991 [DOI] [PMC free article] [PubMed] [Google Scholar]
- 31.Wang Y, Klein JD, Froehlich O, Sands JM: Role of protein kinase C-α in hypertonicity-stimulated urea permeability in mouse inner medullary collecting ducts. Am J Physiol Renal Physiol 304: F233–F238, 2013 [DOI] [PMC free article] [PubMed] [Google Scholar]
- 32.Blessing NW, Blount MA, Sands JM, Martin CF, Klein JD: Urea transporters UT-A1 and UT-A3 accumulate in the plasma membrane in response to increased hypertonicity. Am J Physiol Renal Physiol 295: F1336–F1341, 2008 [DOI] [PMC free article] [PubMed] [Google Scholar]
- 33.Klein JD, Fröhlich O, Blount MA, Martin CF, Smith TD, Sands JM: Vasopressin increases plasma membrane accumulation of urea transporter UT-A1 in rat inner medullary collecting ducts. J Am Soc Nephrol 17: 2680–2686, 2006 [DOI] [PubMed] [Google Scholar]
- 34.Klein JD, Martin CF, Kent KJ, Sands JM: Protein kinase C-α mediates hypertonicity-stimulated increase in urea transporter phosphorylation in the inner medullary collecting duct. Am J Physiol Renal Physiol 302: F1098–F1103, 2012 [DOI] [PMC free article] [PubMed] [Google Scholar]
- 35.Yao L, Huang DY, Pfaff IL, Nie X, Leitges M, Vallon V: Evidence for a role of protein kinase C-alpha in urine concentration. Am J Physiol Renal Physiol 287: F299–F304, 2004 [DOI] [PubMed] [Google Scholar]
- 36.Kim D, Sands JM, Klein JD: Role of vasopressin in diabetes mellitus-induced changes in medullary transport proteins involved in urine concentration in Brattleboro rats. Am J Physiol Renal Physiol 286: F760–F766, 2004 [DOI] [PubMed] [Google Scholar]
- 37.Peil AE, Stolte H, Schmidt-Nielsen B: Uncoupling of glomerular and tubular regulations of urea excretion in rat. Am J Physiol 258: F1666–F1674, 1990 [DOI] [PubMed] [Google Scholar]
- 38.Knepper MA, Danielson RA, Saidel GM, Johnston KH: Effects of dietary protein restriction and glucocorticoid administration on urea excretion in rats. Kidney Int 8: 303–315, 1975 [DOI] [PubMed] [Google Scholar]
- 39.Naruse M, Klein JD, Ashkar ZM, Jacobs JD, Sands JM: Glucocorticoids downregulate the vasopressin-regulated urea transporter in rat terminal inner medullary collecting ducts. J Am Soc Nephrol 8: 517–523, 1997 [DOI] [PubMed] [Google Scholar]
- 40.Li C, Wang W, Summer SN, Falk S, Schrier RW: Downregulation of UT-A1/UT-A3 is associated with urinary concentrating defect in glucocorticoid-excess state. J Am Soc Nephrol 19: 1975–1981, 2008 [DOI] [PMC free article] [PubMed] [Google Scholar]
- 41.Gertner RA, Klein JD, Bailey JL, Kim DU, Luo XH, Bagnasco SM, Sands JM: Aldosterone decreases UT-A1 urea transporter expression via the mineralocorticoid receptor. J Am Soc Nephrol 15: 558–565, 2004 [DOI] [PubMed] [Google Scholar]
- 42.Bailey JL, Mitch WE: Twice-told tales of metabolic acidosis, glucocorticoids, and protein wasting: What do results from rats tell us about patients with kidney disease? Semin Dial 13: 227–231, 2000 [DOI] [PubMed] [Google Scholar]
- 43.Klein JD, Rouillard P, Roberts BR, Sands JM: Acidosis mediates the upregulation of UT-A protein in livers from uremic rats. J Am Soc Nephrol 13: 581–587, 2002 [DOI] [PubMed] [Google Scholar]
- 44.Jung JY, Madsen KM, Han KH, Yang CW, Knepper MA, Sands JM, Kim J: Expression of urea transporters in potassium-depleted mouse kidney. Am J Physiol Renal Physiol 285: F1210–F1224, 2003 [DOI] [PubMed] [Google Scholar]
- 45.Jeon US, Han KH, Park SH, Lee SD, Sheen MR, Jung JY, Kim WY, Sands JM, Kim J, Kwon HM: Downregulation of renal TonEBP in hypokalemic rats. Am J Physiol Renal Physiol 293: F408–F415, 2007 [DOI] [PubMed] [Google Scholar]
- 46.Elkinton JR, Huth EJ, Webster GD, Jr, McCance RA: The renal excretion of hydrogen ion in renal tubular acidosis. I. quantitative assessment of the response to ammonium chloride as an acid load. Am J Med 29: 554–575, 1960 [DOI] [PubMed] [Google Scholar]
- 47.Weiner ID, Verlander JW: Renal ammonia metabolism and transport. Compr Physiol 3: 201–220, 2013 [DOI] [PMC free article] [PubMed] [Google Scholar]
- 48.Van Slyke DD, Phillips RA, Hamilton PB, Archibard RM, Futcher PH, Miller A: Glutamine as source material of urinary ammonia. J Biol Chem 150: 481–482, 1943 [Google Scholar]
- 49.Solbu TT, Boulland JL, Zahid W, Lyamouri Bredahl MK, Amiry-Moghaddam M, Storm-Mathisen J, Roberg BA, Chaudhry FA: Induction and targeting of the glutamine transporter SN1 to the basolateral membranes of cortical kidney tubule cells during chronic metabolic acidosis suggest a role in pH regulation. J Am Soc Nephrol 16: 869–877, 2005 [DOI] [PubMed] [Google Scholar]
- 50.Moret C, Dave MH, Schulz N, Jiang JX, Verrey F, Wagner CA: Regulation of renal amino acid transporters during metabolic acidosis. Am J Physiol Renal Physiol 292: F555–F566, 2007 [DOI] [PubMed] [Google Scholar]
- 51.Curthoys NP, Moe OW: Proximal tubule function and response to acidosis [published online ahead of print May 1, 2014]. Clin J Am Soc Nephrol 10.2215/CJN.10391012 [DOI] [PMC free article] [PubMed] [Google Scholar]
- 52.Tannen RL: Ammonia and acid-base homeostasis. Med Clin North Am 67: 781–798, 1983 [DOI] [PubMed] [Google Scholar]
- 53.Weiner ID, Hamm LL: Molecular mechanisms of renal ammonia transport. Annu Rev Physiol 69: 317–340, 2007 [DOI] [PMC free article] [PubMed] [Google Scholar]
- 54.Nagami GT: Ammonia production and secretion by isolated perfused proximal tubule segments. Miner Electrolyte Metab 16: 259–263, 1990 [PubMed] [Google Scholar]
- 55.Hamm LL, Simon EE: Roles and mechanisms of urinary buffer excretion. Am J Physiol 253: F595–F605, 1987 [DOI] [PubMed] [Google Scholar]
- 56.Bourgeois S, Meer LV, Wootla B, Bloch-Faure M, Chambrey R, Shull GE, Gawenis LR, Houillier P: NHE4 is critical for the renal handling of ammonia in rodents. J Clin Invest 120: 1895–1904, 2010 [DOI] [PMC free article] [PubMed] [Google Scholar]
- 57.Kikeri D, Sun A, Zeidel ML, Hebert SC: Cell membranes impermeable to NH3. Nature 339: 478–480, 1989 [DOI] [PubMed] [Google Scholar]
- 58.Lee S, Lee HJ, Yang HS, Thornell IM, Bevensee MO, Choi I: Sodium-bicarbonate cotransporter NBCn1 in the kidney medullary thick ascending limb cell line is upregulated under acidic conditions and enhances ammonium transport. Exp Physiol 95: 926–937, 2010 [DOI] [PMC free article] [PubMed] [Google Scholar]
- 59.DuBose TD, Jr, Good DW, Hamm LL, Wall SM: Ammonium transport in the kidney: New physiological concepts and their clinical implications. J Am Soc Nephrol 1: 1193–1203, 1991 [DOI] [PubMed] [Google Scholar]
- 60.Biver S, Belge H, Bourgeois S, Van Vooren P, Nowik M, Scohy S, Houillier P, Szpirer J, Szpirer C, Wagner CA, Devuyst O, Marini AM: A role for Rhesus factor Rhcg in renal ammonium excretion and male fertility. Nature 456: 339–343, 2008 [DOI] [PubMed] [Google Scholar]
- 61.Bishop JM, Verlander JW, Lee HW, Nelson RD, Weiner AJ, Handlogten ME, Weiner ID: Role of the Rhesus glycoprotein, Rh B glycoprotein, in renal ammonia excretion. Am J Physiol Renal Physiol 299: F1065–F1077, 2010 [DOI] [PMC free article] [PubMed] [Google Scholar]
- 62.Lee HW, Verlander JW, Bishop JM, Igarashi P, Handlogten ME, Weiner ID: Collecting duct-specific Rh C glycoprotein deletion alters basal and acidosis-stimulated renal ammonia excretion. Am J Physiol Renal Physiol 296: F1364–F1375, 2009 [DOI] [PMC free article] [PubMed] [Google Scholar]
- 63.Wall SM: Ammonium transport and the role of the Na,K-ATPase. Miner Electrolyte Metab 22: 311–317, 1996 [PubMed] [Google Scholar]
- 64.Stettner P, Bourgeois S, Marsching C, Traykova-Brauch M, Porubsky S, Nordström V, Hopf C, Koesters R, Sandhoff R, Wiegandt H, Wagner CA, Gröne HJ, Jennemann R: Sulfatides are required for renal adaptation to chronic metabolic acidosis. Proc Natl Acad Sci U S A 110: 9998–10003, 2013 [DOI] [PMC free article] [PubMed] [Google Scholar]
- 65.May RC, Kelly RA, Mitch WE: Metabolic acidosis stimulates protein degradation in rat muscle by a glucocorticoid-dependent mechanism. J Clin Invest 77: 614–621, 1986 [DOI] [PMC free article] [PubMed] [Google Scholar]
- 66.de Brito-Ashurst I, Varagunam M, Raftery MJ, Yaqoob MM: Bicarbonate supplementation slows progression of CKD and improves nutritional status. J Am Soc Nephrol 20: 2075–2084, 2009 [DOI] [PMC free article] [PubMed] [Google Scholar]
- 67.Abramowitz MK, Melamed ML, Bauer C, Raff AC, Hostetter TH: Effects of oral sodium bicarbonate in patients with CKD. Clin J Am Soc Nephrol 8: 714–720, 2013 [DOI] [PMC free article] [PubMed] [Google Scholar]
- 68.Knochel JP: Diuretic-induced hypokalemia. Am J Med 77: 18–27, 1984 [DOI] [PubMed] [Google Scholar]
- 69.Hulter HN, Ilnicki LP, Harbottle JA, Sebastian A: Impaired renal H+ secretion and NH3 production in mineralocorticoid-deficient glucocorticoid-replete dogs. Am J Physiol 232: F136–F146, 1977 [DOI] [PubMed] [Google Scholar]
- 70.Welbourne TC, Givens G, Joshi S: Renal ammoniagenic response to chronic acid loading: Role of glucocorticoids. Am J Physiol 254: F134–F138, 1988 [DOI] [PubMed] [Google Scholar]
- 71.Karinch AM, Lin CM, Meng Q, Pan M, Souba WW: Glucocorticoids have a role in renal cortical expression of the SNAT3 glutamine transporter during chronic metabolic acidosis. Am J Physiol Renal Physiol 292: F448–F455, 2007 [DOI] [PubMed] [Google Scholar]
- 72.Cassuto H, Olswang Y, Heinemann S, Sabbagh K, Hanson RW, Reshef L: The transcriptional regulation of phosphoenolpyruvate carboxykinase gene in the kidney requires the HNF-1 binding site of the gene. Gene 318: 177–184, 2003 [DOI] [PubMed] [Google Scholar]
- 73.Wang D, Sun H, Lang F, Yun CC: Activation of NHE3 by dexamethasone requires phosphorylation of NHE3 at Ser663 by SGK1. Am J Physiol Cell Physiol 289: C802–C810, 2005 [DOI] [PMC free article] [PubMed] [Google Scholar]
- 74.Bobulescu IA, Dwarakanath V, Zou L, Zhang J, Baum M, Moe OW: Glucocorticoids acutely increase cell surface Na+/H+ exchanger-3 (NHE3) by activation of NHE3 exocytosis. Am J Physiol Renal Physiol 289: F685–F691, 2005 [DOI] [PMC free article] [PubMed] [Google Scholar]
- 75.Remer T, Manz F: Estimation of the renal net acid excretion by adults consuming diets containing variable amounts of protein. Am J Clin Nutr 59: 1356–1361, 1994 [DOI] [PubMed] [Google Scholar]
- 76.Busque SM, Wagner CA: Potassium restriction, high protein intake, and metabolic acidosis increase expression of the glutamine transporter SNAT3 (Slc38a3) in mouse kidney. Am J Physiol Renal Physiol 297: F440–F450, 2009 [DOI] [PubMed] [Google Scholar]
- 77.Welters CF, Deutz NE, Dejong CH, Soeters PB: Enhanced renal vein ammonia efflux after a protein meal in the pig. J Hepatol 31: 489–496, 1999 [DOI] [PubMed] [Google Scholar]
- 78.Olde Damink SW, Jalan R, Deutz NE, Redhead DN, Dejong CH, Hynd P, Jalan RA, Hayes PC, Soeters PB: The kidney plays a major role in the hyperammonemia seen after simulated or actual GI bleeding in patients with cirrhosis. Hepatology 37: 1277–1285, 2003 [DOI] [PubMed] [Google Scholar]
- 79.Mitch WE, Fouque D: Dietary approaches to kidney disease. In: Brenner and Rector's The Kidney, edited by Brenner BM, Philadelphia, Elsevier, 2012, pp 2170–2204 [Google Scholar]
- 80.Beale LS: Kidney Diseases, Urinary Deposits and Calculous Disorders; Their Nature and Treatment, Philadelphia, Lindsay and Blakiston, 1869 [PMC free article] [PubMed] [Google Scholar]
- 81.Folin O: Laws governing the clinical composition of urine. Am J Physiol 13: 67–115, 1905 [Google Scholar]
- 82.Cottini EP, Gallina DL, Dominguez JM: Urea excretion in adult humans with varying degrees of kidney malfunction fed milk, egg or an amino acid mixture: Assessment of nitrogen balance. J Nutr 103: 11–19, 1973 [DOI] [PubMed] [Google Scholar]
- 83.Mitch WE, Remuzzi G: Diets for patients with chronic kidney disease, still worth prescribing. J Am Soc Nephrol 15: 234–237, 2004 [DOI] [PubMed] [Google Scholar]
- 84.Vegter S, Perna A, Postma MJ, Navis G, Remuzzi G, Ruggenenti P: Sodium intake, ACE inhibition, and progression to ESRD. J Am Soc Nephrol 23: 165–173, 2012 [DOI] [PMC free article] [PubMed] [Google Scholar]
- 85.Zoccali C, Ruggenenti P, Perna A, Leonardis D, Tripepi R, Tripepi G, Mallamaci F, Remuzzi G; REIN Study Group: Phosphate may promote CKD progression and attenuate renoprotective effect of ACE inhibition. J Am Soc Nephrol 22: 1923–1930, 2011 [DOI] [PMC free article] [PubMed] [Google Scholar]
- 86.Rafoth RJ, Onstad GR: Urea synthesis after oral protein ingestion in man. J Clin Invest 56: 1170–1174, 1975 [DOI] [PMC free article] [PubMed] [Google Scholar]
- 87.Mitch WE, Wilcox CS: Disorders of body fluids, sodium and potassium in chronic renal failure. Am J Med 72: 536–550, 1982 [DOI] [PubMed] [Google Scholar]
- 88.Walser M: Determinants of ureagenesis, with particular reference to renal failure. Kidney Int 17: 709–721, 1980 [DOI] [PubMed] [Google Scholar]
- 89.Masud T, Manatunga A, Cotsonis G, Mitch WE: The precision of estimating protein intake of patients with chronic renal failure. Kidney Int 62: 1750–1756, 2002 [DOI] [PubMed] [Google Scholar]
- 90.Mitch WE, Lietman PS, Walser M: Effects of oral neomycin and kanamycin in chronic uremic patients: I. Urea metabolism. Kidney Int 11: 116–122, 1977 [DOI] [PubMed] [Google Scholar]
- 91.Richards P, Metcalfe-Gibson A, Ward EE, Wrong O, Houghton BJ: Utilisation of ammonia nitrogen for protein synthesis in man, and the effect of protein restriction and uraemia. Lancet 2: 845–849, 1967 [DOI] [PubMed] [Google Scholar]
- 92.Mitch WE, Walser M: Effects of oral neomycin and kanamycin in chronic uremic patients: II. Nitrogen balance. Kidney Int 11: 123–127, 1977 [DOI] [PubMed] [Google Scholar]
- 93.Varcoe R, Halliday D, Carson ER, Richards P, Tavill AS: Efficiency of utilization of urea nitrogen for albumin synthesis by chronically uraemic and normal man. Clin Sci Mol Med 48: 379–390, 1975 [DOI] [PubMed] [Google Scholar]
- 94.Stenvinkel P, Jani AH, Johnson RJ: Hibernating bears (Ursidae): Metabolic magicians of definite interest for the nephrologist. Kidney Int 83: 207–212, 2013 [DOI] [PubMed] [Google Scholar]
- 95.Johnson WJ, Hagge WW, Wagoner RD, Dinapoli RP, Rosevear JW: Effects of urea loading in patients with far-advanced renal failure. Mayo Clin Proc 47: 21–29, 1972 [PubMed] [Google Scholar]
- 96.Reddy ST, Wang CY, Sakhaee K, Brinkley L, Pak CY: Effect of low-carbohydrate high-protein diets on acid-base balance, stone-forming propensity, and calcium metabolism. Am J Kidney Dis 40: 265–274, 2002 [DOI] [PubMed] [Google Scholar]
- 97.Thomas SS, Dong Y, Zhang L, Mitch WE: Signal regulatory protein-α interacts with the insulin receptor contributing to muscle wasting in chronic kidney disease. Kidney Int 84: 308–316, 2013 [DOI] [PMC free article] [PubMed] [Google Scholar]
- 98.Zhang L, Pan J, Dong Y, Tweardy DJ, Dong Y, Garibotto G, Mitch WE: Stat3 activation links a C/EBPδ to myostatin pathway to stimulate loss of muscle mass. Cell Metab 18: 368–379, 2013 [DOI] [PMC free article] [PubMed] [Google Scholar]
- 99.Stim J, Shaykh M, Anwar F, Ansari A, Arruda JAL, Dunea G: Factors determining hemoglobin carbamylation in renal failure. Kidney Int 48: 1605–1610, 1995 [DOI] [PubMed] [Google Scholar]
- 100.Berg AH, Drechsler C, Wenger J, Buccafusca R, Hod T, Kalim S, Ramma W, Parikh SM, Steen H, Friedman DJ, Danziger J, Wanner C, Thadhani R, Karumanchi SA: Carbamylation of serum albumin as a risk factor for mortality in patients with kidney failure. Sci Transl Med 5: 175ra29, 2013 [DOI] [PMC free article] [PubMed] [Google Scholar]
- 101.Hsu CH, Kurtz TW, Massari PU, Ponze SA, Chang BS: Familial azotemia. Impaired urea excretion despite normal renal function. N Engl J Med 298: 117–121, 1978 [DOI] [PubMed] [Google Scholar]
- 102.Richards P, Brown CL: Urea metabolism in an azotaemic woman with normal renal function. Lancet 2: 207–209, 1975 [DOI] [PubMed] [Google Scholar]