

Abstract
Pulse wave velocity (PWV) is the most important index of arterial stiffness. It is conventionally estimated by non-invasively measuring central and peripheral blood pressure (BP) and/or velocity (BV) waveforms and then detecting the foot-to-foot time delay between the waveforms wherein wave reflection is presumed absent. We developed techniques for improved estimation of PWV from the same waveforms. The techniques effectively estimate PWV from the entire waveforms, rather than just their feet, by mathematically eliminating the reflected wave via an arterial tube-load model. In this way, the techniques may be more robust to artifact while revealing the true PWV in absence of wave reflection. We applied the techniques to estimate aortic PWV from simultaneously and sequentially measured central and peripheral BP waveforms and simultaneously measured central BV and peripheral BP waveforms from 17 anesthetized animals during diverse interventions that perturbed BP widely. Since BP is the major acute determinant of aortic PWV, especially under anesthesia wherein vasomotor tone changes are minimal, we evaluated the techniques in terms of the ability of their PWV estimates to track the acute BP changes in each subject. Overall, the PWV estimates of the techniques tracked the BP changes better than those of the conventional technique (e.g., diastolic BP root-mean-squared-errors of 3.4 vs. 5.2 mmHg for the simultaneous BP waveforms and 7.0 vs. 12.2 mmHg for the BV and BP waveforms (p < 0.02)). With further testing, the arterial tube-load model-based PWV estimation techniques may afford more accurate arterial stiffness monitoring in hypertensive and other patients.
Index Terms: arterial stiffness, blood pressure, blood velocity, pulse transit time, pulse wave velocity, transfer function
I. INTRODUCTION
Pulse wave velocity (PWV) is the speed of energy wave transmission in the arteries. According to the Bramwell-Hill equation, PWV varies inversely with the square root of arterial compliance [1]. PWV indeed increases as the arteries stiffen with aging and disease [2][3][4]. PWV in the aorta is now the most important index of arterial stiffness for two reasons [5]. Firstly, it is an independent predictor of all-cause mortality and cardiovascular events in hypertensive and other patients [5][6]. Secondly, while direct measurement of arterial compliance involves nontrivial tracking of changes in vessel area and BP, PWV is easier to measure [5][7].
PWV is most easily determined as the ratio of the distance and pulse transit time (PTT) between central and peripheral arterial sites. Conventionally, PTT is estimated by measuring blood pressure (BP) or velocity (BV) waveforms at these sites with non-invasive tonometers or Doppler ultrasound probes and then detecting the foot-to-foot time delay between the waveforms. This foot-to-foot detection technique is also applicable to sequential measurements of the waveforms via a simultaneously measured ECG (i.e., ECG gating).
The foot-to-foot detection technique may be explained as follows. BP and BV waveforms arise as the superposition of transmitted and reflected waves. As a result, as shown in Fig. 1a [8], they vary in shape throughout the arterial tree. If wave reflection were absent, a pair of BP (or BV) waveforms would mainly differ by just a time delay equal to PTT, whereas a pair of BP and BV waveforms would likewise differ by the time delay as well as a scale factor (equal to the arterial area times the characteristic impedance) [8]. Hence, the premise of this technique is that interference from the reflected wave is negligible during late diastole and early systole.
Fig. 1.
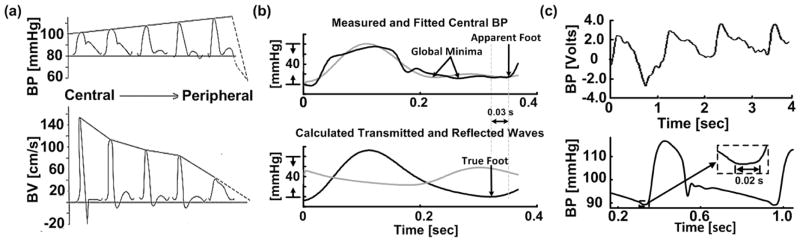
The conventional foot-to-foot detection technique for pulse transit time (PTT) estimation is prone to error due to wave reflection interference and waveform artifact. (a) Blood pressure and velocity (BP and BV) waveforms arise as the sum of transmitted and reflected waves. As a result, these waveforms vary in shape throughout the arterial tree. Hence, the premise of the technique is that wave reflection interference is negligible at the waveform feet. Adapted from [8]. (b) Measured and fitted central BP waveforms (upper) and calculated transmitted and reflected waves in the central aorta (lower) during tachycardia. The reflected wave (gray) is actually prominent near the waveform feet such that the apparent (central BP) foot deviates from the true (transmitted wave) foot. (c) Detection of the foot is often difficult due to non-invasive waveform artifact (upper) [13] and can be subjective even for invasive waveforms (lower) [12]. Just a 0.01 sec error in foot detection can result in a pulse wave velocity (PWV) error of ~15% of the entire PWV range [13][14].
However, wave reflection interference around the waveform feet can become nontrivial with changes in heart rate (HR) [9]. For example, during tachycardia, the time delay between the forward and backward waves in the central aorta is a large fraction of the cardiac cycle length. Hence, as shown in Fig. 1b, the backward wave may be prominent near the central BP waveform foot. Further, the relative magnitude of wave reflection increases with peripheral resistance [8][10]. Just as important, since the technique restricts its analysis to one pair of waveform samples per cardiac cycle, it is not robust to motion and other artifact often present in the non-invasive waveforms, as shown in Fig. 1c [11]. In fact, detection of the foot can be subjective even for invasive waveforms during normal conditions (Fig. 1c) [12].
Even seemingly small detection errors caused by wave reflection interference and/or artifact can result in serious PWV errors. For example, using average adult values of 0.5 m and 0.06 s for the distance and PTT between carotid (central) and femoral (peripheral) arteries [13][14], just a 0.01 s error in foot detection, which is not uncommon (Fig. 1c), yields a PWV error of about 1.4 m/s. This error magnitude is of concern, as the physiologic range of PWV is, for the most part, only from about 6 to 16 m/s [13]. Indeed, a 1 m/s change in PWV has been shown to increase the risk of mortality by 39% and to yield an adjusted relative risk for mortality of 0.71 in end-stage renal disease patients [15][16].
Hence, while the conventional technique does yield PWV estimates with predictive value, it also produces errors that carry clinical consequences. Three examples follow.
First, PWV and BP often show positive correlation. In fact, PWV is frequently advocated as a way to achieve continuous, non-invasive, and cuff-less BP monitoring [17][18][19][20]. The mechanism is well known. Increases in BP cause decreases in arterial compliance, as slack collagen fibers become stiffer. The arterial compliance decreases, in turn, cause increases in PWV as per the Bramwell-Hill equation. While changes in vasomotor tone could also acutely modulate arterial compliance, this effect is less of a factor in large arteries wherein smooth muscle is relatively sparse [21]. However, plots of BP versus PWV typically show excessive scatter about the line of best fit even under general anesthesia wherein changes in vasomotor tone are minimal [17]. As shown herein, this scatter can be reduced with improved analysis techniques.
Second, arterial elastic modulus, which is another more difficult-to-measure index of arterial stiffness, does not change by increasing HR [22]. Yet, PWV was shown to increase with atrial pacing-induced increases in HR despite no change in BP or other relevant variables [23]. This finding, which suggests the need for a HR correction of PWV for risk stratification [23], must be due to error in estimating PWV [24] caused by progressive wave reflection interference (Fig. 1b).
Third, several studies that have compared PWV to arterial compliance and other more difficult-to-measure indices of arterial stiffness have shown that PWV is of inferior clinical value. In one study, arterial compliance discriminated the severity of coronary artery disease, which is strongly associated with large artery stiffness, better than PWV [25]. In another study, arterial elastic modulus discriminated arterial stiffness patients from healthy subjects better than PWV (p < 0.0001 vs. p = 0.004) [26]. In a third exemplary study, arterial elastic modulus afforded a greater odds ratio for predicting all-cause mortality in end-stage renal disease patients than PWV (9.2 vs. 5.4) [15][27]. Hence, improving the accuracy of estimating PWV could enhance its predictive value.
In this study, we conceived techniques for improved PWV estimation from central and peripheral BP and/or BV waveforms. These techniques effectively estimate PWV from the entire waveforms, rather than just their feet, by mathematically eliminating the reflected wave via an arterial tube-load model. In this way, the techniques may be robust to artifact while revealing the true PWV (i.e., PWV in absence of wave reflection). Further, they may be applied to sequential waveform measurements via a simultaneously measured ECG. We tested these techniques in terms of the ability of their PWV estimates to track large changes in BP in anesthetized animals. Our results show superior BP-PWV correlation than the conventional technique. Preliminary versions of this study have been reported in abbreviated form [28][29].
II. ARTERIAL TUBE-LOAD MODEL-BASED PWV ESTIMATION TECHNIQUES
The techniques are illustrated in Figs. 2 and 3 and are implemented in four steps. First, arterial transmission and reflection are represented with a tube-load model that has been shown to have excellent predictive value in other applications (see Discussion section) [30][31][32][33]. Second, the transfer function coupling measured central and peripheral BP and/or BV waveforms is defined in terms of the unknown model parameters. The parameters represent the true PTT, peripheral resistance and compliance, and possibly the characteristic impedance times the arterial area. Third, all parameters are estimated by finding the transfer function, which when applied to one of the waveforms, optimally fits the other. Fourth, PWV is calculated from the PTT estimate. Below, we describe the techniques and a way to augment the computational speed in implementing them.
Fig. 2.

Arterial tube-load model-based technique for estimating PWV from simultaneously measured central and peripheral BP and/or BV waveforms. See text for details.
Fig. 3.

Arterial tube-load model-based technique for estimating PWV from sequentially measured central and peripheral BP and/or BV waveforms. Here, x(t) and y(t) are any of the input-output pairs in Fig. 2b.
A. PWV Estimation from Simultaneous Measurements
The arterial tree is modeled as m parallel, uniform tubes with terminal loads, as shown in Fig. 2a. The ith tube (i = 1, …, m) represents the wave travel path between the central aorta and the ith peripheral artery. Each tube is frictionless and thus has constant characteristic impedance
| (1) |
where Li, Ai, and Ci are large artery length, area, and compliance while ρ is the blood density, and allows waves to travel along the tube with constant PTT
| (2) |
[30][31][34]. The ith load represents the arterial bed distal to the ith peripheral artery. Each load has frequency-dependent impedance [Zi(ω)] characterized by peripheral resistance [ri] and compliance [ci] while matching Zci at high frequency [30][31][34].
This model may be explained as follows. Cardiac ejection initiates pressure and velocity waves that travel from left to right along a tube. These forward waves move without distortion and are proportional to each other (via a characteristic impedance time arterial area scale factor). The waves are reflected in the opposite direction at the terminal load with relative magnitude and phase based on frequency according to the wave reflection coefficient
| (3) |
The backward pressure and velocity waves likewise travel along the tube without distortion and are proportional to each other. The actual BP (or BV) waveform at any point on the tube may thus be expressed as the sum (or difference) of the forward and backward pressure (or velocity) waves after time shifting to account for the wave travel time (as determined with PTT). In this way, the model mimics the progressive distortion that experimental BP and BV waveforms undergo with increasing distance from the heart (see Fig. 1a). Also, from these expressions, transfer functions relating a pair of BP and/or BV waveforms at any points on the tube may be defined d in terms of the model parameters.
In particular, the transfer functions relating a peripheral BP or BV waveform [ppi(t) or upi(t)] to a central BP or BV waveform [pc(t) or uc(t)] may be defined in terms of Tdi, rici, Zcici, and possibly AiZci, as shown in Fig. 2b. (The central waveform is regarded as the output here to increase computational speed, as described below.) These three or four parameters are estimated by finding the transfer function, which when applied to the former waveform, best fits the latter waveform in the least squares sense. This optimization is achieved via a numerical search, as described below. PWV is then computed from the Tdi estimate and the distance between the two arterial measurement sites [Li], as shown in Fig. 2c. (Note that only the parameters characterizing a single tube and load are relevant; however, the parallel tube-load model is shown in Fig. 2a to better indicate the physical meaning of the relevant tube and load.)
B. PWV Estimation from Sequential Measurements
An ECG is simultaneously obtained during sequential measurements of the central and peripheral waveforms [x(t) and y(t), which represent any of the input-output pairs shown in Fig. 2b]. Then, an impulse train [rx(t)] is formed from the segment of the ECG obtained during the x(t) measurement by placing unit impulses at the R-wave locations, as shown in Fig. 3a [35]. (Note that the R-wave is generally straightforward to detect due to its relatively high frequency characteristic, and effective R-wave detection techniques are available [36].) Next, an impulse response [hx(t)] is identified, which when convolved with rx(t), best fits x(t) in the least squares sense, as indicated in Fig. 3b [35]. This optimization is achieved in closed-form via autoregressive exogenous input (ARX) identification [37]. Next, this analysis is repeated for the y(t) measurement to yield an impulse response relating ry(t) to y(t) [hy(t)], as shown in Fig. 3ab. The impulse responses hx(t) and hy(t) represent x(t) and y(t) in response to the same cardiac excitation (i.e., a single, average cardiac contraction). Consequently and finally, the appropriate technique in Fig. 2b is applied to hx(t) and hy(t) (instead of x(t) and y(t)), as indicated in Fig. 3cd.
C. Implementation to Augment Computational Speed
The three or four unknown model parameters (i.e., Tdi, rici, Zcici, and possibly AiZci) of the transfer functions in Fig. 2b are estimated by searching over a physical range of candidate parameter sets. That is, the output is predicted by applying the transfer function to the input for each candidate set of parameters. The parameter set that yields the minimum mean squared error between the predicted and measured output is then selected as the final estimate. This numerical search generally produces the optimal solution but is computationally expensive. Its speed is augmented as follows.
Firstly, the number of candidate parameter sets is reduced. More specifically, since large artery characteristic impedance is often much smaller than peripheral resistance [8], the following constraint is employed: 0 < Zcici < rici. Further, the Tdi parameter is confined to be within a range established by the foot-to-foot detection technique.
Secondly, the number of search dimensions is reduced when AiZci is an unknown parameter. In particular, if the other three parameters were known, AiZci or its reciprocal is a linear parameter in the transfer function. Hence, for ea ach candidate Tdi, rici, and Zcici, this remaining parameter is computed in closed-form via the linear least squares solution.
Thirdly, the number of transfer function applications (i.e., convolutions) is reduced. The idea is to apply the transfer function in parts according to how it was derived (i.e., by adding or subtracting forward and backward waves after time shifting to account for their wave travel time). More specifically, first, the forward wave at the terminal load is computed by applying the transfer function 1/(1+Γi(ω)) to the peripheral input for each candidate rici and Zcici. The key point here is that this transfer function is not parameterized by Tdi. Then, the backward wave at the terminal load is computed by either subtracting the forward wave from the measured peripheral BP input or subtracting the measured peripheral BV input from the forward wave. Next, the forward wave is advanced in time and the backward wave is delayed in time, both by Tdi, for each candidate Tdi. Then, the time shifted waves are either added to predict the central BP output (exactly or to within an AiZci scale factor) or subtracted to predict the central BV output (exactly or to within a 1/AiZci scale factor). In this way, the transfer function applications are performed only over a two-dimensional space (defined by rici and Zcici) rather than a three-dimensional space (defined by Tdi, rici, and Zcici).
Finally, the speed in executing the search is increased by parallel computation. That is, the mean squared error between the predicted and measured output is computed for multiple candidate parameter sets at a time using multiple processors.
III. TECHNIQUE EVALUATION
We applied the new and conventional techniques to invasive BP and BV waveforms from animals during wide changes to BP. We evaluated and compared the techniques in terms of the ability of their PWV estimates to track BP in each subject. We provide details below.
A. Experimental Data
We collected data from six healthy adult beagles (10–12 kg) under an experimental protocol approved by the Michigan State University All-University Committee on Animal Use and Care. For each dog, we induced and maintained general anesthesia using an intravenous injection of propofol (2.2– 6.6 mg/kg) and an inhaled mixture of oxygen and isoflurane (1.5–2.5%). We inserted a micromanometer-tipped catheter (Millar Instruments) percutaneously into a femoral artery for a peripheral BP waveform. We likewise inserted a similar catheter into the opposite femoral artery and used fluoroscopic guidance (GE) to position it in the aorta for a central BP waveform. We placed a catheter in a cephalic vein for drug and fluid infusions as well as other instruments to address different specific aims. We interfaced all analog transducer outputs to a personal computer via a data acquisition system (DataQ Instruments). We then recorded the measurements at a sampling rate of 500 Hz during a baseline period and infusions of dobutamine, phenylephrine, and nitroprusside in three of the dogs and esmolol and saline in the remaining dogs. We used several infusion rates for each intervention and allowed recovery periods between the interventions.
We also studied two datasets previously collected from healthy animals under general anesthesia. The data collection procedures were approved by institutional animal care committees and are described in detail elsewhere [32][38]. One dataset included central (ascending aorta) and peripheral (femoral artery) BP waveforms via micromanometer-tipped catheters, along with surface ECGs, from six dogs (10–12 kg adult beagles) during a baseline period and hemodynamic drug infusions, blood volume changes, and cardiac pacing. The other dataset consisted of a central (ascending aorta) blood flow waveform via an ultrasonic flow probe and a peripheral (femoral artery) BP waveform via a fluid-filled catheter from five swine (30–34 kg) before and after the infusion of hemodynamic drugs and blood volume changes. The waveforms were available at a sampling rate of >250 Hz.
Importantly, isoflurane was used to achieve a deep plane of anesthesia in all 17 animals. Isoflurane is a potent vasodilator and severely blunts cardiovascular reflexes [39]. Indeed, the animals were hypotensive at baseline, and there was little HR response to the vasoactive drug infusions and blood volume changes. So, both basal vasomotor tone and changes in vasomotor tone were minimal. As a result, the acute BP changes served as a particularly useful reference for PWV estimates in this study. However, there was one exception in the dog in which low rate cardiac pacing was performed. As the pacing rate was decreased to 25 bpm, severe hypotension ensued. Under this dire situation, peripheral resistance, which was measured using a femoral artery blood flow probe that happened to be placed in this particular dog [32], increased reflexively perhaps due to a central ischemic response. We therefore excluded the data during the low rate cardiac pacing, which was last intervention performed in this dog.
B. Data Analysis
With these data, we were able to assess the new techniques as applied to (a) simultaneous central and peripheral BP waveforms, (b) sequential central and peripheral BP waveforms, and (c) simultaneous central BV and peripheral BP waveforms. We obtained the central BV waveform by dividing the central blood flow waveform by the nominal aortic cross-sectional area of the swine.
For the simultaneous measurements, we applied the techniques to estimate PWV for each beat of the waveforms. We then averaged the PWV estimates over 15-sec intervals.
For the sequential measurements, we applied the technique to 15-sec intervals of the waveforms to obtain a PWV estimate. For the ARX identification step, we set the autoregressive and moving average orders to the number of samples between the R-wave and the peak of the BP waveform. We determined this order empirically. For the tube-load model parameter estimation step, we used one beat length of the impulse responses, as they should eventually converge to the same exponential diastolic decay [38].
For comparison, we applied the foot-to-foot detection technique to estimate average PWV over 15-sec intervals from the same waveform pairs. We specifically implemented all of the automatic foot detection methods in [40][41] including a recently proposed diastole-patching method [42] and settled on the tangent line intersection method, as it performed best overall. (Note that the diastole-patching method performed similarly to this method as applied to the BP waveforms but is not applicable to BP and BV waveforms [42].)
We evaluated the PWV estimates of each technique in terms of their ability to track diastolic and mean BP in particular. In theory, the PWV estimates of the conventional technique should track diastolic BP best by virtue of being derived from the waveform feet, whereas the PWV estimates of the new techniques should correlate best with mean BP by virtue of arising from all waveform samples. First, we measured the average diastolic and mean BP over 15-sec intervals. Then, we found the line of best fit between the PWV estimates of a technique and one of the measured BP parameters for each subject. (Note that use of higher order polynomials did not materially improve the fit.) We used the resulting correlation coefficient between the PWV estimates and measured BP parameters as one evaluation metric. Next, we predicted each BP parameter from the corresponding PWV estimate and best-fit-line. Finally, we computed the root-mean-squared-error (RMSE) between the predicted and measured BP parameters for another evaluation metric. (Note that we used the same data for determining the line of best fit and computing the RMSE, as our goal was to establish the ability of the PWV estimates to track the BP parameters rather than the capacity of the best fit line to predict BP parameters from PWV estimates. Further, we employed this procedure for all techniques to obtain a fair comparison.)
We statistically compared the correlation coefficients and RMSEs of the techniques. We specifically applied paired t-tests to compare the subject average metrics after log transformation to make the data more normally distributed.
IV. RESULTS
Table I shows the mean and standard deviation for diastolic and mean BP in each subject. The average standard deviation was 16±8 mmHg, so BP usually changed appreciably in each subject. If the BP changes were trivial, then a meaningful assessment of the techniques could not have been obtained in terms of tracking BP in each subject.
TABLE I.
Subject-by-Subject Blood Pressure (BP) Statistics.
| Dog | 1 | 2 | 3 | 4 | 5 | 6 | 7 | 8 | 9 | 10 | 11 | 12 | Average |
|---|---|---|---|---|---|---|---|---|---|---|---|---|---|
| Diastolic BP [mmHg] | 77±29* | 63±7 | 71±20 | 60±7 | 74±20 | 74±27 | 63±16 | 76±14 | 69±15 | 59±8 | 55±3 | 61±5 | 67±14 |
| Mean BP [mmHg] | 99±37 | 87±11 | 92±25 | 79±7 | 99±27 | 92±32 | 82±20 | 99±17 | 90±19 | 79±9 | 74±5 | 81±6 | 87±18 |
|
| |||||||||||||
| Pig | 1 | 2 | 3 | 4 | 5 | Average | |||||||
|
| |||||||||||||
| Diastolic BP [mmHg] | 48±15 | 66±18 | 64±12 | 62±16 | 56±16 | 59±15 | |||||||
| Mean BP [mmHg] | 59±18 | 85±21 | 85±16 | 81±20 | 73±20 | 77±19 | |||||||
Mean ± Standard Deviation
Fig. 1b shows a sample of the measured and fitted central BP waveforms and estimated forward and backward waves in the central aorta from simultaneous central and peripheral BP waveforms from a dog during high rate cardiac pacing. The foot of the measured waveform is ambiguous (e.g., there are multiple local minima). The forward and backward waves, which are buttressed by the agreement between the fitted and measured waveforms, indicate that wave reflection is the main cause of the ambiguity. That is, the backward wave is prominent during late diastole and early systole. As a result, the foot of the central BP waveforms, relative to the foot of the forward wave (i.e., the true foot), is to the left (when defined as the global minimum) or right (when defined as the initial, steep BP rise). This example suggests that the arterial tube-load model-based techniques can mitigate wave reflection interference.
Fig. 4 illustrates sample plots of mean BP versus the PWV estimates from simultaneous and sequential central and peripheral BP waveforms from Dog 3, while Fig. 5 shows sample plots of mean BP versus the PWV estimates from simultaneous central BV and peripheral BP waveforms from Pig 2. The arterial tube-load model-based techniques and the foot-to-foot detection technique showed the expected positive correlation between MAP and PWV. However, the new techniques exhibited noticeably reduced scatter about the line of best fit compared to the conventional technique. Note that this latter technique performed about the same for simultaneous and sequential measurements.
Fig. 4.
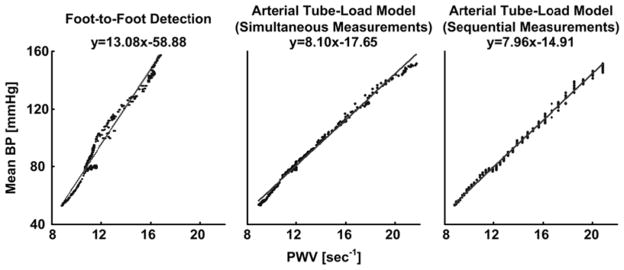
Sample plots of mean BP versus PWV estimates from simultaneously and sequentially measured central and peripheral BP waveforms from Dog 3. A value of unity was used here and elsewhere for the length component of the PWV estimates, as it has no impact on the correlation between BP and PWV within a subject. Line and equation indicates line of best fit. (Note that the PWV estimates are clustered for the sequential measurements due to waveform sampling and that this clustering is masked for the simultaneous measurements due to averaging the PWV estimates.)
Fig. 5.
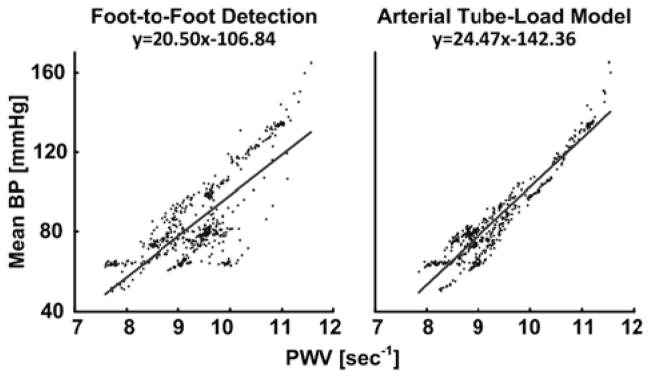
Sample plots of mean BP versus PWV estimates from simultaneously measured central BV and peripheral BP waveforms from Pig 2.
Tables II – IV illustrate the quantitative results for each subject. For the simultaneous central and peripheral BP waveforms from dogs, the arterial tube-load model-based technique was able to reduce the average of the RMSEs by 35% and increase the average of the correlation coefficients by 11% relative to the foot-to-foot detection technique. These differences were all statistically significant. For the sequential central and peripheral BP waveforms from dogs, the new technique was able to decrease the average of the RMSEs by 30% and increase the average of the correlation coefficients by 4% compared to the conventional technique. These differences were statistically significant only for diastolic BP. Further, the RMSEs and correlation coefficients of the new techniques were not significantly different for simultaneous and sequential measurements (not shown in Tables). For the simultaneous central BV and peripheral BP waveforms from swine, the new technique was able to decrease the average of the RMSEs by 38% and increase the average of the correlation coefficients by 43% relative to the conventional technique. These differences were all statistically significant. Hence, the arterial tube-load model-based paradigm afforded superior improvement in the pigs. The likely reason is that the swine waveforms were contaminated by a greater amount of measurement artifact. That is, these waveforms were measured with an aortic flow probe, which yielded noticeable noise that obfuscated the central BV foot detection as shown in Fig 6, and a low fidelity BP catheter, whereas all of the canine waveforms were obtained with high fidelity BP catheters. These results suggest that the new techniques can mitigate waveform artifact.
TABLE II.
Subject-by-Subject Results for Simultaneous Central and Peripheral BP Waveforms from Dogs.
| RMSE [mmHg] | Dog | 1 | 2 | 3 | 4 | 5 | 6 | 7 | 8 | 9 | 10 | 11 | 12 | Average |
|---|---|---|---|---|---|---|---|---|---|---|---|---|---|---|
| Diastolic BP | Foot-to-Foot Detection | 5.3 | 3.5 | 4.9 | 5.9 | 8.5 | 12 | 4.1 | 2.4 | 6.5 | 2.6 | 2.2 | 4.3 | 5.2 |
| Arterial Tube-Load Model | 5.2 | 2 | 2.4 | 4.3 | 3.8 | 5.1 | 3.8 | 3.3 | 4.6 | 2.4 | 1.4 | 2.2 | 3.4* | |
| Mean BP | Foot-to-Foot Detection | 5.6 | 4.7 | 5.3 | 4.0 | 8.7 | 14.1 | 4.3 | 2.6 | 8.3 | 3.2 | 3.2 | 5.3 | 5.8 |
| Arterial Tube-Load Model | 4.1 | 3.8 | 2 | 3.4 | 7.2 | 5.4 | 3.1 | 3.3 | 5.1 | 2.9 | 2.1 | 3.3 | 3.8* |
| Correlation [unitless] | Dog | 1 | 2 | 3 | 4 | 5 | 6 | 7 | 8 | 9 | 10 | 11 | 12 | Average |
|---|---|---|---|---|---|---|---|---|---|---|---|---|---|---|
| Diastolic BP | Foot-to-Foot Detection | 0.983 | 0.877 | 0.968 | 0.438 | 0.903 | 0.897 | 0.959 | 0.981 | 0.904 | 0.94 | 0.757 | 0.321 | 0.827 |
| Arterial Tube-Load Model | 0.984 | 0.945 | 0.993 | 0.763 | 0.982 | 0.982 | 0.972 | 0.969 | 0.955 | 0.947 | 0.899 | 0.877 | 0.939** | |
| Mean BP | Foot-to-Foot Detection | 0.988 | 0.911 | 0.977 | 0.842 | 0.948 | 0.900 | 0.970 | 0.987 | 0.896 | 0.932 | 0.732 | 0.295 | 0.865 |
| Arterial Tube-Load Model | 0.994 | 0.943 | 0.997 | 0.891 | 0.962 | 0.986 | 0.987 | 0.981 | 0.963 | 0.943 | 0.888 | 0.802 | 0.945*** |
RMSE is root-mean-squared-error;
p<0.02;
p<0.05;
p<0.1
Table IV.
Subject-by-Subject Results for Simultaneous Central BV and Peripheral BP Waveforms from Swine.
| RMSE [mmHg] | Pig | 1 | 2 | 3 | 4 | 5 | Average |
|---|---|---|---|---|---|---|---|
| Diastolic BP | Foot-to-Foot Detection | 9.2 | 13 | 10.3 | 10.5 | 13.1 | 12.2 |
| Arterial Tube-Load Model | 7.7 | 6.5 | 4.5 | 10.3 | 6.0 | 7.0* | |
| Mean BP | Foot-to-Foot Detection | 11.1 | 14.5 | 11.9 | 18.9 | 12.2 | 13.7 |
| Arterial Tube-Load Model | 9.8 | 7.1 | 6.1 | 13.4 | 8.8 | 9.0* |
| Correlation [unitless] | Pig | 1 | 2 | 3 | 4 | 5 | Average |
|---|---|---|---|---|---|---|---|
| Diastolic BP | Foot-to-Foot Detection | 0.777 | 0.687 | 0.521 | 0.311 | 0.588 | 0.577 |
| Arterial Tube-Load Model | 0.853 | 0.931 | 0.927 | 0.774 | 0.928 | 0.883* | |
| Mean BP | Foot-to-Foot Detection | 0.8 | 0.732 | 0.647 | 0.306 | 0.761 | 0.649 |
| Arterial Tube-Load Model | 0.845 | 0.944 | 0.921 | 0.738 | 0.883 | 0.866** |
See Table II caption.
Fig. 6.
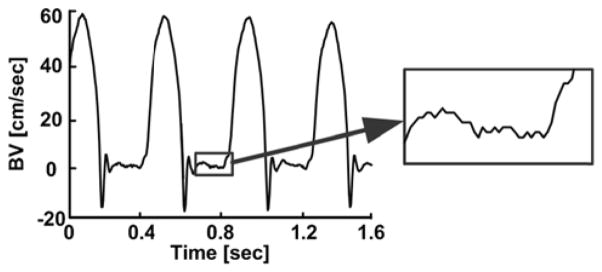
Typical noise level in central BV waveform measurement from a pig.
Finally, the computational speed of the arterial tube-load model-based techniques was about 20% faster than real time when executed in MATLAB on a desktop computer with eight 2.5 GHz processors. In other words, the average PWV estimate over a 15-sec interval of the waveforms could be obtained in about 12 sec on this platform. The speed of the techniques using just one processor would be about five times slower than real time but may likely be enhanced to at least real time via another programming language.
V. DISCUSSION
A. Summary
We have proposed techniques for improved estimation of PWV, which has emerged as the most important index of arterial stiffness, from central and peripheral BP and/or BV waveforms. The idea is to estimate PWV from the entire waveforms, rather than just their feet, by mathematically eliminating the reflected wave via an arterial tube-load model. Hence, these techniques may be more robust to waveform artifact and more closely indicate the true PWV than the conventional foot-to-foot detection technique. Further, the new techniques are applicable to simultaneously or sequentially measured waveforms and can estimate PWV within or near real-time.
It is not easy to measure the true PWV in absence of wave reflection, so we did not evaluate the techniques against direct reference measurements. However, BP is the major acute determinant of aortic PWV [21], especially under general anesthesia wherein vasomotor tone changes are usually minimal. Hence, we indirectly tested the techniques using BP changes as a reference. We specifically applied the techniques to estimate aortic PWV from simultaneously and sequentially measured central and peripheral BP waveforms and simultaneously measured central BV and peripheral BP waveforms from 17 anesthetized animals during diverse acute interventions that often perturbed BP widely (see Table I).
Overall, the techniques tracked the BP changes in each subject better than the foot-to-foot-detection technique (see Tables II – IV). This improvement was greater in magnitude in terms of RMSE (about 35% on average) than correlation coefficient (about 20% on average) and reached statistical significant in most cases. The improvement may have been attained by mitigation of both artifact and wave reflection.
Although the waveforms here were obtained with invasive sensors and thus generally of high quality, the central BV waveforms from the swine still showed a noticeable level of noise (see Fig. 6). The relative performance of the new techniques was best when applied to these waveforms (see Tables II – IV), thereby indicating their artifact mitigation capability. We expect that these techniques will be able to offer greater improvements in PWV estimation accuracy over the conventional technique when applied to patient waveforms, which are obtained with non-invasive sensors and thus often show much more artifact.
During high rate cardiac pacing, the estimated backward wave was prominent near the central BP waveform foot (see Fig. 1b). As a result, this apparent foot was at a significantly different location than the “true” foot of the estimated forward wave (see Fig. 1b), thereby suggesting wave reflection interference mitigation capability of the new techniques.
B. Extension of Techniques for Local PWV Estimation
According to the Waterhammer equation [8], PWV is also sometimes determined as the characteristic impedance times the arterial area divided by the blood density. The numerator term is estimated by measuring central BP and BV waveforms and then finding the slope of the line that best relates the initial systolic samples of the waveforms [43]. This technique estimates local PWV unlike the foot-to-foot detection technique, which estimates regional PWV. However, the early systolic BV-BP slope technique can similarly be compromised by wave reflection interference and waveform artifact.
The arterial tube-load model-based techniques were designed to obtain an artifact robust estimate of the true regional PWV from central and peripheral BP and/or BV waveforms. However, they can potentially be extended to likewise yield an artifact robust estimate of the true local PWV from central BV and BP waveforms as follows.
The arterial tree is modeled as a single uniform tube with terminal load, as shown in Fig. 7a. The tube represents the wave travel path along a segment of the aorta and likewise has constant characteristic impedance
Fig. 7.

Potential arterial tube-load model-based technique for estimating local (rather than regional) PWV from simultaneously measured central BV and BP waveforms. This technique could also be extended to simultaneous measurements as indicated in Fig. 3.
| (4) |
where L0, A0, and C0 are aortic segment length, area, and compliance and allows waves to travel with constant PTT
| (5) |
The load represents the remainder of the arterial tree and similarly has frequency-dependent impedance [Z0(ω)] characterized by the total peripheral resistance [r0] and compliance [c0] and Zc0. According to this model, the transfer function relating a central BV waveform [uc(t)] to a central BP waveform [pc(t)] may be defined in terms of Td0, r0c0, Zc0c0, and A0Zc0, as shown in Fig. 7b. These four parameters are estimated analogously to the regional PWV estimation techniques. Local PWV is then computed from the A0Zc0 estimate and the nominal ρ value, as shown in Fig. 7c.
However, this extended technique obviously needs to be tested. Note that it may likewise be amenable to sequential waveform measurements (see Fig. 3).
C. Relationship to Previous Techniques
Related techniques have been proposed in the literature. We compare and contrast the arterial tube-load model-based techniques here with several previous techniques.
Techniques have been proposed to estimate regional PWV from central and peripheral waveforms using a black-box, rather than physical model-based, transfer function [44][45]. In particular, an impulse response is identified that optimally couples the central waveform to the peripheral waveform. Then, PTT is determined as the time delay of the impulse response. Hence, these techniques may likewise be robust to artifact and reveal the true PWV. A significant advantage of the techniques is that they are applicable to arbitrary waveforms (e.g., pulse oximeter and impedance waveforms) rather than being limited to BP and BV waveforms. On the other hand, the arterial tube-load model-based techniques here extract PTT not just from the time delay of the transfer function but also from its shape (see Tdi parameter in the transfer functions of Fig. 2b) and could thus be more accurate.
Arterial tube-load model-based techniques have been proposed to estimate regional PWV from only peripheral BP waveforms. One technique models multiple peripheral BP waveforms as outputs to the common central BP waveform input [30]. The transfer functions that couple the common input to each output is defined in terms of the parameters of an arterial tube-load model. These parameters, which represent PTT to each peripheral artery and other arterial properties, are then estimated from two or more peripheral BP waveforms via multi-channel blind system identification. Another technique defines the transfer function relating a peripheral BP waveform to the central BP waveform in terms of the arterial tube-load model parameters (see Fig. 2a) [33]. PTT and the other model parameters are then estimated from one peripheral BP waveform and a one-time PTT measurement by exploiting the fact that central BV is negligible during diastole. A third technique uses the same model-based transfer function and estimates its parameters from one peripheral BP waveform by assuming that the central BP waveform obeys certain smoothness constraints [31]. These techniques have reduced measurement requirements and are thus more convenient than the techniques here as well as the conventional techniques. However, for the same reason, the previous techniques should yield markedly less accurate PWV estimates. For example, the PTT estimates even from multiple peripheral BP waveforms are unable to indicate the absolute PTT value [30].
Finally, an arterial tube-load model-based technique has been proposed to estimate forward and backward waves from central and peripheral BP waveforms [32]. In particular, the PTT model parameter is first estimated via the foot-to-foot detection technique. Then, with PTT known, both the order and parameters of the load are estimated in closed-form. While this technique is similar to the techniques here, it obviously does not offer an improved PWV estimate.
D. Contributions
As just indicated, the unique idea here is to enhance PWV estimation accuracy by combining the arterial tube-load model with standard measurements that are being made in practice. Some other contributions of this study are: (a) defining an ECG gating approach to be able to apply arterial tube-load model-based PWV estimation techniques to sequential measurements; (b) developing ways to augment the speed of these techniques; (c) demonstrating that the techniques can indeed improve the accuracy of regional PWV estimates from BP and/or BV waveforms and simultaneous or sequential measurements; and (d) proposing to improve the estimation of local PWV from standard measurements via an arterial tube-load model-based technique.
E. Limitations
Some limitations of this study are as follows. Firstly, the arterial tube-load model employed here (see Figs. 2 and 7) ignores elastic and geometric tapering and, to a large extent, branching [46]. The model thus assumes that the main reflection sites are at the small arteries. While other reflection sites may also be important in actuality [47][48], the arterioles may indeed often constitute the dominant wave reflection site [49]. One reason is that this site is where the arterial radius changes most abruptly [46]. As a result, the model is usually able to predict experimental BP and BV waveforms quite well [46]. Further, this simplicity affords a small number of parameters that can be uniquely estimated, but with some bias, from limited measurements. Note that the foot-to-foot detection technique may likewise be subject to similar assumptions. Secondly, while the arterial tube-load model-based techniques for regional PWV estimation (see Fig. 2) may offer a means to improve the accuracy of PTT, they do not address the distance between the measurement sites that is also needed to compute PWV. Hence, the distance measurement component of regional PWV estimation remains problematic [50]. Note that this component is important for comparisons amongst patients but has little value in tracking arterial stiffness changes within a patient. Finally, BP is surely not an ideal reference for assessing the aortic PWV estimates in general. However, the acute BP changes likely sufficed as a reference in this study because vasomotor tone generally has little impact on the large, elastic arteries [21], especially under general anesthesia, and other mechanisms for arterial compliance changes occur very slowly over time (e.g., aging, disease). If BP were a poor reference here, it is unlikely that the new techniques would consistently track the BP changes better than the conventional technique.
F. Conclusions
In sum, we have proposed and evaluated arterial tube-load model-based techniques for estimating PWV from a pair of hemodynamic waveforms. Our results indicate that these techniques (a) can improve PWV estimation accuracy by mitigating waveform artifact and wave reflection interference and (b) are applicable to simultaneously or sequentially measured central and peripheral BP and/or BV waveforms.
Future efforts are needed to bring these techniques to practice. Most importantly, since humans may show different wave reflection patterns than animals, human testing is mandatory. For example, the techniques should be evaluated in patients in terms of both accuracy and predictive value relative to the conventional techniques. It would also be worthwhile to refine the new techniques, especially by exploring more accurate arterial models. If subsequent studies prove successful, then these techniques may be employed for more faithful monitoring of arterial stiffness in hypertensive, end-stage renal disease, diabetic, and geriatric patients. A more immediate application could be to use the techniques as a short-term surrogate outcome of clinical trials for determining the efficacy of therapies aimed at reducing arterial stiffness.
Table III.
Subject-by-Subject Results for Sequential Central and Peripheral BP Waveforms from Dogs.
| RMSE [mmHg] | Dog | 1 | 2 | 3 | 4 | 5 | 6 | Average |
|---|---|---|---|---|---|---|---|---|
| Diastolic BP | Foot-to-Foot Detection | 5.3 | 3.5 | 4.9 | 5.9 | 8.5 | 12.0 | 6.7 |
| Arterial Tube-Load Model | 4.9 | 2.7 | 2.2 | 5.4 | 4.2 | 6.8 | 4.4** | |
| Mean BP | Foot-to-Foot Detection | 5.6 | 4.7 | 5.3 | 4.0 | 8.7 | 14.1 | 7.1 |
| Arterial Tube-Load Model | 4.2 | 4.2 | 1.8 | 4.0 | 10.1 | 7.5 | 5.3 |
| Correlation [unitless] | Dog | 1 | 2 | 3 | 4 | 5 | 6 | Average |
|---|---|---|---|---|---|---|---|---|
| Diastolic BP | Foot-to-Foot Detection | 0.983 | 0.877 | 0.968 | 0.438 | 0.903 | 0.897 | 0.844 |
| Arterial Tube-Load Model | 0.986 | 0.926 | 0.994 | 0.57 | 0.977 | 0.968 | 0.903** | |
| Mean BP | Foot-to-Foot Detection | 0.988 | 0.911 | 0.977 | 0.842 | 0.948 | 0.900 | 0.928 |
| Arterial Tube-Load Model | 0.993 | 0.931 | 0.997 | 0.836 | 0.928 | 0.972 | 0.943 |
See Table II caption.
Acknowledgments
This work was supported by a NIH grant [1 R03 AG041361], a National Science Foundation CAREER Grant [0643477], a Michigan Universities Commercialization Initiative Grant, and the Telemedicine and Advanced Technology Research Center (TATRC) at the U.S. Army Medical Research and Materiel Command (USAMRMC) through award W81XWH-10-2-0124.
Retia Medical, LLC (East Lansing, MI, USA) is developing technology involving the tube-load model upon which the techniques herein are based. MG is a paid intern for Retia Medical; NBO has received a research grant from Retia Medical; and RM is a paid consultant for, and has equity interests in, Retia Medical.
Biographies

Mingwu Gao received the BS degree in Electrical Engineering with Chu Kochen Honors College at Zhejiang University of China in 2007 and MS degree in Electrical Engineering at Ohio State University, Columbus Ohio, in 2009. He completed a summer internship in Real Time Embedded System Lab at GE Global Research, Niskayuna NY in 2012. He is currently a PhD student with the department of Electrical and Computer Engineering at Michigan State University, East Lansing MI and an intern at Retia Medical LLC. His research interests include biomedical signal processing, patient monitoring, hemodynamic modeling and system identification.

Guanqun Zhang received the B.S. degree in electrical engineering from Fudan University, Shanghai, China, in 2007 and the Ph.D. degree in electrical engineering from Michigan State University, East Lansing, Michigan, in 2012. He is currently a Senior Scientist in Sotera Wireless, Inc., San Diego, California. His research interests include vital signs monitoring, hemodynamic system modeling and cardiovascular signal processing.

N. Bari Olivier received the D.V.M. degree in veterinary medicine from Louisiana State University, Baton Rouge, LA, in 1981, and the Ph.D. degree in physiology from Michigan State University, East Lansing, MI, in 1990. Since then he has been at the faculty of the Department of Small Animal Clinical Sciences, College of Veterinary Medicine, Michigan State University, where he is currently an Associate Professor and Chief of clinical cardiology. His research interests include cardiovascular physiology and biomedical engineering, with a specific interest in cardiac electrophysiology as it pertains to arrhythmias.

Ramakrishna Mukkamala (M′02) received the B.S.E. degree in Biomedical/Electrical Engineering from Duke University, Durham, NC, in 1993 and the S.M. and Ph.D. degrees in Electrical Engineering and Computer Science from the Massachusetts Institute of Technology, Cambridge, MA, in 1995 and 2000, respectively. He was a Postdoctoral Fellow/Research Engineer at the Harvard-MIT Division of Health Sciences and Technology, Cambridge, MA, from 2000 to 2002. Since then, he has been on the faculty of the Department of Electrical and Computer Engineering at Michigan State University, East Lansing, MI, where he is currently a Professor. His research interests include biomedical signal processing and identification, modeling of physiologic systems, cardiovascular physiology, and patient monitoring. Dr. Mukkamala was a recipient of an AHA Scientist Development Grant in 2005, an NSF CAREER Award in 2007, and an MSU Teacher-Scholar Aw ward in 2008.
Footnotes
GZ declares no conflicts of interests.
Contributor Information
Mingwu Gao, Email: gaomingw@msu.edu, Department of Electrical and Computer Engineering, Michigan State University, East Lansing, MI 48824 USA.
Guanqun Zhang, Email: guanqun.zhang@soterawireless.com, Department of Electrical and Computer Engineering, Michigan State University, East Lansing, MI 48824 USA. He is now with Sotera Wireless, San Diego, CA 92121 USA.
N. Bari Olivier, Email: olivier@cvm.msu.edu, Department of Small Animal Clinical Sciences, Michigan State University, East Lansing, MI 48824 USA.
Ramakrishna Mukkamala, Email: rama@egr.msu.edu, Department of Electrical and Computer Engineering, Michigan State University, East Lansing, MI 48824 USA (phone: 517-353-3120; fax: 517-353-1980;).
References
- 1.Bramwell JC, Hill AV. The velocity of the pulse wave in man. Proceedings of the Royal Society of London Series B-Containing Papers of a Biological Character. 1922;93(652):298–306. [Google Scholar]
- 2.Ferrari AU, Radaelli A, Centola M. Invited review: Aging and the cardiovascular system. Journal of Applied Physiology. 2003;95(6):2591–2597. doi: 10.1152/japplphysiol.00601.2003. [DOI] [PubMed] [Google Scholar]
- 3.Hirata K, Kawakami M, O’Rourke MF. Pulse wave analysis and pulse wave velocity - A review of blood pressure interpretation 100 years after Korotkov. Circulation Journal. 2006;70(10):1231–1239. doi: 10.1253/circj.70.1231. [DOI] [PubMed] [Google Scholar]
- 4.Lee HY, Oh BH. Aging and Arterial Stiffness. Circulation Journal. 2010;74(11):2257–2262. doi: 10.1253/circj.cj-10-0910. [DOI] [PubMed] [Google Scholar]
- 5.Mancia G, Fagard R, Narkiewicz K, Redon J. 2013 ESH/ESC guidelines for the management of arterial hypertension: the Task Force for the Management of Arterial Hypertension of the European Society of Hypertension (ESH) and of the European Society of Cardiology (ESC) European Heart Journal. 2013 Jul;34(28):2159–219. doi: 10.1093/eurheartj/eht151. [DOI] [PubMed] [Google Scholar]
- 6.Vlachopoulos C, Aznaouridis K, Stefanadis C. Prediction of Cardiovascular Events and All-Cause Mortality With Arterial Stiffness A Systematic Review and Meta-Analysis. Journal of the American College of Cardiology. 2010;55(13):1318–1327. doi: 10.1016/j.jacc.2009.10.061. [DOI] [PubMed] [Google Scholar]
- 7.Boutouyrie P, Laurent S, Briet M. Importance of arterial stiffness as cardiovascular risk factor for future development of new type of drugs. Fundamental & Clinical Pharmacology. 2008;22(3):241–246. doi: 10.1111/j.1472-8206.2008.00584.x. [DOI] [PubMed] [Google Scholar]
- 8.Nichols WW, O’Rourke MF. McDonal’s Blood Flow in Arteries. 5. Hodder Arnold, a member of the Hodder Headline Group; 2005. [Google Scholar]
- 9.Noordergraaf A. Circulatory System Dynamics. New York: Academic Press; 1978. [Google Scholar]
- 10.Söderström S, Nyberg G, O’Rourke MF, Sellgren J, Pontén J, Soderstrom S, Ponten J. Can a clinically useful aortic pressure wave be derived from a radial pressure wave? British Journal of Anaesthesia. 2002 Apr;88(4):481–488. doi: 10.1093/bja/88.4.481. [DOI] [PubMed] [Google Scholar]
- 11.Sola J, Rimoldii SF, Allemann Y. Ambulatory monitoring of the cardiovascular system: the role of Pulse Wave Velocity. New Developments in Biomedical Engineering. 2010:391–424. [Google Scholar]
- 12.Milnor W. Hemodynamics. Baltimore: Williams & Wilkins; 1982. [Google Scholar]
- 13.Boutouyrie P, Laurent S, Briet M. Determinants of pulse wave velocity in healthy people and in the presence of cardiovascular risk factors: ‘establishing normal and reference values’. European Heart Journal. 2010 Oct;31(19):2338–50. doi: 10.1093/eurheartj/ehq165. [DOI] [PMC free article] [PubMed] [Google Scholar]
- 14.Sugawara J, Hayashi K, Yokoi Y, Yanaka H. Carotid-Femoral Pulse Wave Velocity: Impact of Different Arterial Path Length Measurements. Artery Research. 2010;4(1):27–31. doi: 10.1016/j.artres.2009.11.001. [DOI] [PMC free article] [PubMed] [Google Scholar]
- 15.Blacher J, Guerin aP, Pannier B, Marchais SJ, Safar ME, London GM. Impact of Aortic Stiffness on Survival in End-Stage Renal Disease. Circulation. 1999 May;99(18):2434–2439. doi: 10.1161/01.cir.99.18.2434. [DOI] [PubMed] [Google Scholar]
- 16.Guerin AP, Blacher J, Pannier B, Marchais SJ, Safar ME, London GM. Impact of Aortic Stiffness Attenuation on Survival of Patients in End-Stage Renal Failure. Circulation. 2001 Feb;103(7):987–992. doi: 10.1161/01.cir.103.7.987. [DOI] [PubMed] [Google Scholar]
- 17.Pruett JD, Bourland JD, Geddes LA. Measurement of Pulse-Wave Velocity Using a Beat-Sampling Technique. Annals of Biomedical Engineering. 1988;16(4):341–347. doi: 10.1007/BF02364622. [DOI] [PubMed] [Google Scholar]
- 18.Proença M, Falhi a, Ferrario D, Grossenbacher O, Porchet J, Krauss J, Sola J. Continuous non-occlusive blood pressure monitoring at the sternum. Biomedizinische Technik Biomedical engineering. 2012 Aug;57:2–5. doi: 10.1515/bmt-2013-4126. [DOI] [PubMed] [Google Scholar]
- 19.Gesche H, Grosskurth D, Küchler G, Patzak A. Continuous blood pressure measurement by using the pulse transit time: comparison to a cuff-based method. European journal of applied physiology. 2012 Jan;112(1):309–15. doi: 10.1007/s00421-011-1983-3. [DOI] [PubMed] [Google Scholar]
- 20.Choi Y, Zhang Q, Ko S. Noninvasive cuffless blood pressure estimation using pulse transit time and Hilbert–Huang transform. Computers & Electrical Engineering. 2013 Jan;39(1):103–111. [Google Scholar]
- 21.Burton AC. Relation of Structure to Function of the Tissues of the Wall of Blood Vessels. Physiological Reviews. 1954;34(4):619–642. doi: 10.1152/physrev.1954.34.4.619. [DOI] [PubMed] [Google Scholar]
- 22.Bergel DH. The Dynamic Elastic Properties of the Arterial Wall. Journal of Physiology. 1961:458–469. doi: 10.1113/jphysiol.1961.sp006687. [DOI] [PMC free article] [PubMed] [Google Scholar]
- 23.Lantelme P, Mestre C, Lievre M, Gressard A, Milon H. Heart Rate: An Important Confounder of Pulse Wave Velocity Assessment. Hypertension. 2002 Jun;39(6):1083–1087. doi: 10.1161/01.hyp.0000019132.41066.95. [DOI] [PubMed] [Google Scholar]
- 24.Hayward CS, Avolio AP, O’Rourke MF. Arterial Pulse Wave Velocity and Heart Rate. Hypertension. 2002 Oct;40(6):8e–9. doi: 10.1161/01.hyp.0000038734.25997.a9. [DOI] [PubMed] [Google Scholar]
- 25.Waddell TK, Dart AM, Medley TL, Cameron JD, Kingwell BA. Carotid pressure is a better predictor of coronary artery disease severity than brachial pressure. Hypertension. 2001;38(4):927–931. doi: 10.1161/hy1001.096107. [DOI] [PubMed] [Google Scholar]
- 26.Yu WC, Chuang SY, Lin YP, Chen CH. Brachial-ankle vs carotid-femoral pulse wave velocity as a dterminant of cardiovascular structure and function. Journal of Human Hypertension. 2008 Jan;22(1):24–31. doi: 10.1038/sj.jhh.1002259. [DOI] [PubMed] [Google Scholar]
- 27.Blacher J, Pannier B, Guerin aP, Marchais SJ, Safar ME, London GM. Carotid Arterial Stiffness as a Predictor of Cardiovascular and All-Cause Mortality in End-Stage Renal Disease. Hypertension. 1998 Sep;32(3):570–574. doi: 10.1161/01.hyp.32.3.570. [DOI] [PubMed] [Google Scholar]
- 28.Zhang G, Gao M, Mukkamala R. Robust, beat-to-beat estimation of the true pulse transit time from central and peripheral blood pressure or flow waveforms using an arterial tube-load model. 2011 Annual International Conference of the IEEE Engineering in Medicine and Biology Society; 2011. pp. 4291–4294. [DOI] [PubMed] [Google Scholar]
- 29.Xu D, Zhang G, Olivier N, Mukkamala R. Monitoring aortic stiffness in the presence of measurement artifact based on an arterial tube model. IEEE Engineering in Medicine and Biology Society Conference; Jan, 2010. pp. 3453–6. [DOI] [PubMed] [Google Scholar]
- 30.Hahn JO, Reisner AT, Asada HH. Estimation of pulse transit time using two diametric blood pressure waveform measurements. Medical Engineering & Physics. 2010 Sep;32(7):753–9. doi: 10.1016/j.medengphy.2010.04.017. [DOI] [PubMed] [Google Scholar]
- 31.Hahn J-O, Reisner AT, Jaffer Fa, Asada HH. Subject-specific estimation of central aortic blood pressure using an individualized transfer function: a preliminary feasibility study. IEEE Transactions on Information Technology in Biomedicine. 2012 Mar;16(2):212–20. doi: 10.1109/TITB.2011.2177668. [DOI] [PubMed] [Google Scholar]
- 32.Swamy G, Olivier NB, Mukkamala R. Calculation of forward and backward arterial waves by analysis of two pressure waveforms. IEEE Transactions on Bio-medical Engineering. 2010 Dec;57(12):2833–9. doi: 10.1109/TBME.2010.2073467. [DOI] [PubMed] [Google Scholar]
- 33.Swamy G, Xu D, Olivier NB, Mukkamala R. An adaptive transfer function for deriving the aortic pressure waveform from a peripheral artery pressure waveform. American Journal of physiology. 2009 Nov;297(5):H1956–63. doi: 10.1152/ajpheart.00155.2009. [DOI] [PubMed] [Google Scholar]
- 34.Sugimachi M, Shishido T, Miyatake K, Sunagawa K. A new model-based method of reconstructing central aortic pressure from peripheral arterial pressure. Japan Journal of Physiology. 2001;51:217–222. doi: 10.2170/jjphysiol.51.217. [DOI] [PubMed] [Google Scholar]
- 35.Mullen TJ, Appel ML, Mukkamala R, Mathias JM, Cohen RJ. System identification of closed-loop cardiovascular control: effects of posture and autonomic blockade. American Journal of Physiology. 1997;272:H448–461. doi: 10.1152/ajpheart.1997.272.1.H448. [DOI] [PubMed] [Google Scholar]
- 36.Pan J, Tompkins WJ. A real-time QRS detection algorithm. IEEE Transactions on Bio-medical Engineering. 1985 Mar;32(3):230–6. doi: 10.1109/TBME.1985.325532. [DOI] [PubMed] [Google Scholar]
- 37.Ljung L. System Identification: Theory for the User. Englewood Cliffs: Prentice Hall; 1987. [Google Scholar]
- 38.Mukkamala R, Reisner AT, Hojman HM, Mark RG, Cohen RJ. Continuous cardiac output monitoring by peripheral blood pressure waveform analysis. IEEE Transactions on Bio-medical Engineering Biomed Eng. 2006;53:459–467. doi: 10.1109/TBME.2005.869780. [DOI] [PubMed] [Google Scholar]
- 39.Ross D. Animal Models in Cardiovascular Research. 3. Dordrecht; New York: Springer; 2009. pp. 135pp. 137–138. [Google Scholar]
- 40.Chiu YC, Arand PW, Shroff SG, Feldman T, Carroll JD. Determination of Pulse-Wave Velocities with Computerized Algorithms. American Heart Journal. 1991;121(5):1460–1470. doi: 10.1016/0002-8703(91)90153-9. [DOI] [PubMed] [Google Scholar]
- 41.Hermeling E, Reesink KD, Reneman RS, Hoeks APG. Measurements of local pulse wave velocity: effect of signal processing on precision. Ultrasound in Med & Biol. 2007;33(5):774–781. doi: 10.1016/j.ultrasmedbio.2006.11.018. [DOI] [PubMed] [Google Scholar]
- 42.Vardoulis O, Papaioannou TG, Stergiopulos N. Validation of a novel and existing algorithms for the estimation of pulse transit time: advancing the accuracy in pulse wave velocity measurement. American journal of physiology Heart and circulatory physiology. 2013 Jun;304(11):H1558–67. doi: 10.1152/ajpheart.00963.2012. [DOI] [PubMed] [Google Scholar]
- 43.Parker KH. An introduction to wave intensity analysis. Medical & Biological Engineering & Computing. 2009;47(2):175–188. doi: 10.1007/s11517-009-0439-y. [DOI] [PubMed] [Google Scholar]
- 44.Latson TW, Hunter WC, Katoh N, Sagawa K. Effect of Nitroglycerin on Aortic Impedance, Diameter, and Pulse-Wave Velocity. Circulation Research. 1988 May;62(5):884–890. doi: 10.1161/01.res.62.5.884. [DOI] [PubMed] [Google Scholar]
- 45.Xu RM, Ryan DKL, Rickards CA, Zhang G, Convertino VA. Improved pulse transit time estimation by system identification analysis of proximal and distal arterial waveforms. American Journal of Physiology. 2011:1389–1395. doi: 10.1152/ajpheart.00443.2011. [DOI] [PubMed] [Google Scholar]
- 46.Zhang G, Hahn JO, Mukkamala R. Tube-load model parameter estimation for monitoring arterial hemodynamics. Frontiers in Physiology. 2011 Jan;2(November):72. doi: 10.3389/fphys.2011.00072. [DOI] [PMC free article] [PubMed] [Google Scholar]
- 47.Khir AW, Parker KH. Wave intensity in the ascending aorta: effects of arterial occlusion. Journal of Biomechanics. 2005 Apr;38(4):647–55. doi: 10.1016/j.jbiomech.2004.05.039. [DOI] [PubMed] [Google Scholar]
- 48.Segers P, Verdonck P. Role of tapering in aortic wave reflection : hydraulic and mathematical model study. Journal of Biomechanics. 2000;33:299–306. doi: 10.1016/s0021-9290(99)00180-3. [DOI] [PubMed] [Google Scholar]
- 49.Orourke MF, Yaginuma T. Wave Reflections and the Arterial Pulse. Archives off Internal Medicine. 1984;144(2):366–371. [PubMed] [Google Scholar]
- 50.Weber T, Ammer M, Rammer M, Adji A, O’Rourke MF, Wassertheurer S, Rosenkranz S, Eber B. Noninvasive determination of carotid-femoral pulse wave velocity depends critically on assessment of travel distance: a comparison with invasive measurement. Journal of Hypertension. 2009 Aug;27(8):1624–30. doi: 10.1097/HJH.0b013e32832cb04e. [DOI] [PubMed] [Google Scholar]