

Summary
Objective
Hippocampal atrophy in temporal lobe epilepsy (TLE) can indicate mesial temporal sclerosis and predict surgical success. Yet many TLE patients do not have significant atrophy (MRI-negative), presenting a diagnostic challenge. We used a new variant of high-dimensional large deformation mapping to assess whether patients with apparently normal hippocampi have local shape changes that mirror those of patients with significant hippocampal atrophy.
Methods
Forty-seven unilateral TLE patients and thirty-two controls underwent structural brain MRI. High-dimensional large deformation mapping provided hippocampal surface and volume estimates for each participant, dividing patients into low vs. high hippocampal atrophy groups. A vertex-level generalized linear model compared local shape changes between groups.
Results
Low atrophy TLE patients (MRI-negative) had significant local hippocampal shape changes compared to controls, similar to those in the contralateral hippocampus of high atrophy patients. These changes primarily involved the subicular and hilar/dentate regions, instead of the classically affected CA1 region. Disease duration instead covaried with lateral hippocampal atrophy, colocalizing with the CA1 subfield.
Significance
These findings show that “MRI-negative” TLE patients have regions of hippocampal atrophy that cluster medially, sparing the lateral regions (CA1) involved in high atrophy patients, suggesting an overall effect of temporal lobe seizures manifesting as bilateral medial hippocampal atrophy, and a more selective effect of hippocampal seizures leading to disease-proportional CA1 atrophy, potentially reflecting epileptogenesis.
Keywords: Morphometry, Hippocampal Subfields, Subiculum, Structural MRI
Introduction
Medication-resistant temporal lobe epilepsy (TLE) has been associated with a spectrum of changes in hippocampal shape. Hippocampal atrophy can be a marker of mesial temporal sclerosis 1 and a predictor of surgical success 2, with some studies 3, but not all 4, finding a rough correlation with disease duration. However a significant number of patients with medial temporal lobe seizures do not show significant global hippocampal atrophy 5 (referred to as “MRI-negative”) and represent a diagnostic challenge with regards to seizure localization and operative outcome, motivating a search for changes at a smaller scale. In patients with significant atrophy local changes cluster around the lateral hippocampus, roughly within the CA1 subfield 6,7. Some local shape changes have been attributed to increased folding and malrotation in patients with dual pathology 6,8–11. In general, however, local changes in hippocampal shape in TLE remain incompletely characterized, especially in MRI-negative patients. Additionally, few past studies have assessed changes at the subfield level.
Hippocampal volume estimates initially relied on voxel-based morphometric methods, which can suffer from partial volume effects and other limitations 12. To minimize this, techniques based on estimating the hippocampal shape evolved that rely on a combination of manual and automated methods to derive individual hippocampal surface estimates 13. The individual surface is then registered to either a group surface or a template, followed by computation of some type of displacement measure at each vertex in relation to the group surface or template 14,15. Yet this displacement measure often not only captures local shape changes but also includes confounds such as changes in position (mirroring) between the individual surface and the template, though some investigators have minimized this by using non-linear methods 15,16. A method invariant to position changes and registration artifacts would thus be attractive.
Here we used a technique combining MRI-based large-deformation high-dimensional mapping (HDM-LD)14 with local assessment of surface contraction/expansion, which is rotation/translation invariant, to estimate local hippocampal subfield changes in TLE patients with and without global hippocampal atrophy. The primary goal of our study was to determine whether patients with low global hippocampal atrophy (MRI-negative) have local surface changes at the subfield level that distinguish them from healthy controls and patients with high hippocampal atrophy (MRI-positive).
Methods
Participants
Forty-seven consecutively selected unilateral TLE patients (30 left onset, 17 right onset) confirmed with video-EEG and thirty-two age, gender and handedness matched healthy controls were studied. All cases had history of focal seizures consistent with TLE, including arrested activity, impairment of consciousness, automatisms and postictal confusion 17. Patients with space-occupying lesions or history of neurosurgical procedures were excluded. Controls had no history of CNS disease, significant head trauma or alcohol abuse. The study was approved by the institutional review board at Washington University.
The key goal was to assess local surface changes in TLE patients without significant global hippocampal atrophy compared to patients with significant atrophy and healthy controls. LOW and HIGH atrophy group assignments were made based on the hippocampal volume ipsilateral to the seizure focus, with the explicit purpose of minimizing global hippocampal volume differences between the LOW atrophy group and controls. Patients with ipsilateral hippocampal volumes within one standard deviation of the control mean were assigned to the LOW atrophy group, while patients with ipsilateral hippocampal volumes more than one standard deviation smaller than the control mean were assigned to the HIGH atrophy group.
Imaging
A T1-weighted magnetization-prepared spoiled gradient echo sequence was acquired on a Siemens MAGNETOM Trio 3T scanner (0.43×0.43×0.9 mm voxel, TR 1570 ms, TE 3.29 ms, TI 800 ms, flip angle 15 deg, FOV 416×512). Large deformation high dimensional mapping (HDM-LD) provided individual hippocampal surface estimates using established techniques 18. This began with initial manual placement of landmarks defining the anterior-most and posterior-most extents of the hippocampus, yielding an anterior-posterior axis. An automated algorithm subsequently generated five equidistant oblique planes perpendicular to the axis. Four landmarks were then manually placed using the MR image to indicate the superior, medial, inferior and lateral extent of the hippocampus in each oblique plane (Figure 1A). Of note, the medial landmark in each oblique plane was placed to include the prosubiculum, i.e. no attempt was made to separate prosubiculum and subiculum, which is notoriously difficult if not impossible to do reliably with a 3T T1-weighted MRI image. After automated computation of a surface estimate using diffeomorphic deformation a visual check of the accuracy of the hippocampal border estimate was performed (Figure 1B).
Figure 1.
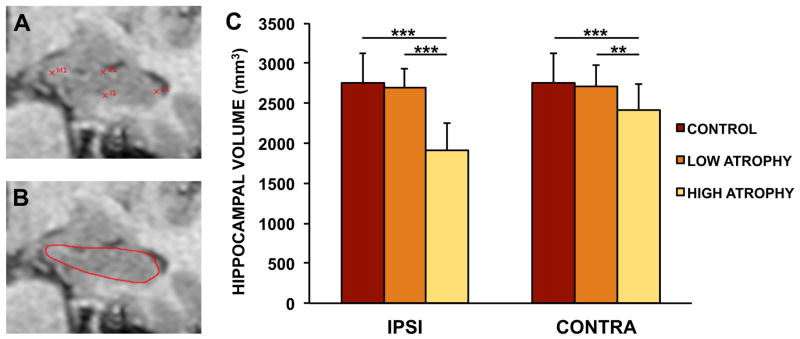
Hippocampal surface estimation method and volume findings. A. Example of sample landmarks placed at the medial (M1), lateral (L1), superior (S1) and inferior (I1) borders of an individual hippocampal cross-section. B. Derived hippocampal border after diffeomorphic deformation. C. Hippocampal volume estimates across experimental groups. Note the significantly smaller hippocampi (both ipsilateral and to a lesser extent contralateral) in the HIGH atrophy group, vs. the absence of a significant difference between the LOW atrophy and the control group. Legend: ***: p <.0001, **: p <.001, Welch t test; IPSI: ipsilateral to seizure focus; CONTRA: contralateral to seizure focus.
A surface expansion/contraction measure was then calculated vertexwise for each individual surface by computing the change in average distance from neighboring vertices compared to the control template surface. This measure maximizes local surface change contributions and is invariant to surface rotation/translation, i.e. it is independent of successful registration of the individual surface to the template surface. Surface-based multiple comparison correction was applied using a cluster-based empiric noise estimation of suprathreshold clusters, as previously described 19.
Analysis
Individual hippocampal volumes were analyzed with ANOVA (ipsilateral vs. contralateral volume as dependent variables, group (control, LOW, HIGH) as an independent factor, and subjects as random effects) followed by relevant two-tailed two-sample unequal variance t-tests. Vertex-level surface deformation estimates were entered into a generalized linear model with contrasts comparing TLE patients to controls, as well as TLE patient subgroups (LEFT vs. RIGHT TLE, HIGH vs. LOW global hippocampal atrophy) to each other. Expansion/contraction within specific hippocampal subregions was analyzed with ANOVA (expansion/contraction coefficient as the dependent variable, group (control, LOW, HIGH), laterality (ipsilateral vs. contralateral) and subregion as independent factors, and subjects as random effects) followed by relevant t-tests. In some analyses patients were collapsed across left and right TLE groups. A manual segmentation subdividing the hippocampus into CA1, subiculum and CA2-4/dentate subregions provided subregional surface change estimates.
Results
Forty-seven TLE patients (30 left TLE, 17 right TLE; 17/30 male/female; seven left-handed; mean disease duration = 18.3 years, range: 2–65) and thirty-two controls (12/20 male/female, four left-handed) were studied. There was no age difference between TLE patients (mean age = 44.0, range: 19–74) and controls (mean age = 41.4, range: 18–65; Welch t-test: t = 0.82, d.f. 65.4, p = 0.42) or between left TLE (mean age = 44.6, range: 19–74) and right TLE patients (mean age = 42.9, range: 23–69; Welch t-test: t = 0.40, d.f. = 35.5, p = 0.69). Furthermore, there was no age difference between LOW atrophy (n = 24, mean age = 45.9, range: 23–69) and HIGH atrophy patients (n = 23, mean age = 42.0, range: 19–74; Welch t-test: t = 1.00, d.f. = 43.4, p = 0.33).
Mean age of epilepsy onset was 25.7 years (range: birth-59 years) and mean seizure frequency was 6.5 per month (range: 2.5–9), with 34 patients (72%) having history of generalized seizures. In terms of provoking factors, 7 (15%) patients had history of febrile seizures, 5 (11%) had history of head trauma with loss or alteration of consciousness and 1 (2%) had history of encephalitis. In terms of changes noted by visual inspection, none of the patients showed dual pathology taken to mean presence of a secondary lesion (e.g. cortical malformation in addition to MTS). Bilateral hippocampal atrophy was instead common, with 11 of the 23 patients in the HIGH group showing a significantly smaller (>1 SD smaller than controls) contralateral hippocampal volume. While presence of malrotation was not quantitatively assessed, each individual hippocampus was verified to have good surface estimation by visual assessment, including hippocampi that showed malrotation qualitatively.
Twenty-three patients ultimately underwent epilepsy surgery (17 selective amygdalo-hippocampectomy, 6 temporal lobectomy). In terms of surgical outcome, 17 (74%) were Engel Class I, 3 (13%) were Engel Class II, 2 (9%) were Engel Class III, and 1 (4%) were Engel Class IV. Pathology showed changes consistent with mesial temporal sclerosis (neuronal loss involving the CA1 subfield and astrocytosis) in 20 patients (87%). Two patients (9%) showed gliosis and changes suggestive of heterotopia, and one patient (4%) only showed gliosis without neuronal loss. In all cases of MTS where the amount of tissue recovered allowed subfield identification, the CA1 subfield showed cell loss; in 11 patients (55% of MTS cases) the CA4 subfield also showed cell loss, but none showed exclusive CA4 involvement.
As expected given our group assignments, there was a significant effect of group in the global hippocampal volume ipsilateral to the seizure focus (F = 19.3, d.f. 1, p = 0.000035) as well as a smaller but significant effect of group in the contralateral hippocampus (F = 5.22, d.f. 1, p = 0.025). On post-hoc t tests, this effect was shown to be carried by the significantly smaller volume in the HIGH atrophy group compared to the control and the LOW atrophy group (Welch t-test; ipsilateral HIGH atrophy vs. control: t = 8.87, d.f. 48.6, p = 9.7 × 10⁻¹²; contralateral HIGH atrophy vs. control: t = 3.54, d.f. 50.5, p = 0.00088; ipsilateral HIGH atrophy vs. LOW atrophy: t = −9.22, d.f. 38.0, p = 3.1 × 10⁻¹¹; contralateral HIGH atrophy vs. LOW atrophy: t = −3.46, d.f. 42.0, p = 0.0013). Conversely, the LOW atrophy group did not show significantly different volumes from the control group (Welch t-test; ipsilateral LOW atrophy vs. control: t = 0.76, d.f. 52.9, p = 0.45; contralateral LOW atrophy vs. control: t = 0.41, d.f. 53.9, p = 0.69).
In similar fashion, the hippocampal asymmetry index (defined as the absolute value of the difference between hippocampal volumes divided by the sum of the volumes) was significantly greater in the HIGH group (0.123) than in the LOW group (0.032, Welch t-test: t = 4.39, d.f. 24.8, p = 0.0002). Conversely the asymmetry index in the LOW group was not significantly different than in controls (0.024, Welch t-test: t = 1.35, d.f. 37.1, p = 0.18). In summary our group assignments yielded a LOW atrophy group with global hippocampal volumes indistinguishable from the control group, while the HIGH atrophy group showed significant global hippocampal atrophy ipsilaterally and to a lesser extent contralaterally to the seizure focus (Figure 1C).
MRI-negative TLE patients have local medial hippocampal atrophy
We investigated local hippocampal surface changes by computing local surface contraction/expansion in individual hippocampi and comparing them with a vertexwise generalized linear model. In this analysis we collapsed patients across left and right TLE into hippocampi ipsilateral or contralateral to the seizure focus, contrasting patients with HIGH and LOW atrophy to controls. In the HIGH atrophy group, the majority of the hippocampus ipsilateral to the seizure focus had local surface contraction compared to controls (Figure 2). The contralateral hippocampus in the HIGH atrophy group instead showed a more limited pattern consisting of medial body and medial head atrophy, largely involving the subicular and dentate regions. In LOW atrophy patients the ipsilateral and contralateral hippocampi were indistinguishable in terms of local changes, mirroring the changes in the contralateral hippocampus of HIGH atrophy patients. Local surface expansion was also noted in the LOW atrophy group in the bilateral dorsal hippocampal heads. Local surface contraction in MRI-negative patients (for which the global hippocampal volume was statistically indistinguishable from normal) thus generally matched that of MRI-positive patients in the hippocampus contralateral to the seizure focus.
Figure 2.

Regions of significant hippocampal surface contraction (blue/teal) or expansion (orange/red) in the HIGH and LOW atrophy groups compared to controls (p <.05, after multiple comparison correction). Local surface contraction (blue) was maximal in the HIGH atrophy group in the hippocampus ipsilateral (I) to the seizure focus. However the contralateral hippocampus (C) in the HIGH atrophy group and both hippocampi in the LOW atrophy group also showed significant contraction in the medial hippocampal body and head (roughly corresponding to the subiculum and dentate gyrus regions). Also note the local surface expansion (orange/red) in the dorsal hippocampal head in the LOW atrophy group.
To highlight differences between the LOW and HIGH atrophy groups, an analysis was performed using a model comparing the two groups directly, excluding the healthy control group (Figure 3). This yielded the key difference between the two groups: significantly increased atrophy in the lateral and anterior dorsal hippocampus (roughly coinciding with the CA1 subfield distribution and much more prominent in the hippocampus ipsilateral to seizure onset), in the HIGH atrophy group compared to the LOW atrophy group.
Figure 3.
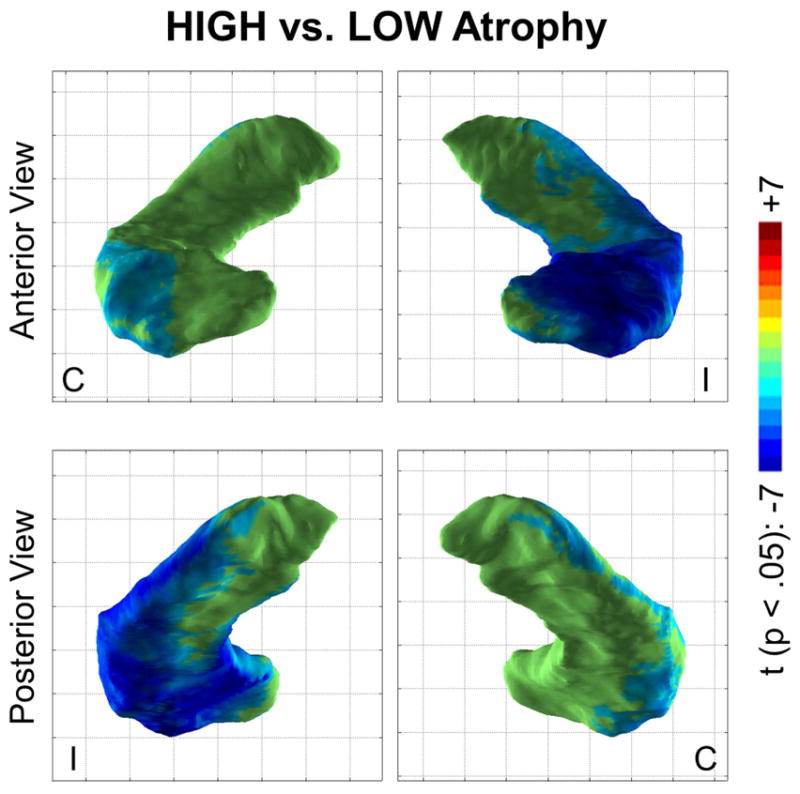
Regions of significant hippocampal surface contraction (blue/teal) or expansion (orange/red) in the HIGH atrophy group compared to the LOW atrophy group (p <.05, after multiple comparison correction). The lateral and anterior dorsal aspects of the hippocampus ipsilateral (I) to the seizure focus showed significant contraction in the HIGH group compared to the LOW group. A similar but much less prominent effect was seen in the contralateral hippocampus (C).
Local changes in MRI-negative patients are similar for left and right TLE
To assess whether the changes observed in the ipsilateral/contralateral analysis were affected byt the hemisphere of seizure onset, we performed a second analysis separating the groups into left vs. right TLE (Figure 4). The widespread surface contraction observed in the hippocampus ipsilateral to the seizure onset was again observed in both left and right TLE HIGH atrophy groups. Medial surface contraction in the contralateral hippocampus in the HIGH atrophy group was also seen in both left TLE and right TLE. Furthermore, both left and right TLE LOW atrophy groups showed medial hippocampal surface contraction, indicating that this is not a hemisphere-specific effect. In contrast, local surface expansion in the dorsal bilateral hippocampal heads was limited to the left TLE group, potentially reflecting group-specific variation.
Figure 4.

The medial local surface contraction noted in low atrophy patients in the ipsilateral/contralateral analysis is again seen when examining left TLE and right TLE groups separately, though the effect is much stronger for low atrophy left TLE (n = 16) than for low atrophy right TLE (n = 8), possibly due to the smaller group size. Color scale is identical to the prior figure.
Local changes in MRI-negative patients target the subiculum and dentate regions
We next assessed whether the observed medial hippocampal atrophy in LOW atrophy patients corresponds anatomically to the subicular (and dentate) regions. Using a manual segmentation subdividing the hippocampus into CA1, subiculum and CA2-4/dentate subregions we registered and transformed hippocampal subregional boundaries on the hippocampal template. We then computed the mean local contraction/expansion of each subregion for the three groups (HIGH and LOW atrophy and controls).
Significant main effects of group (F = 27.7, d.f. 2, p = 9.1 × 10⁻¹⁰), laterality (F = 42.7, d.f. 1, p = 2.0 × 10⁻¹⁰) and subregion (F = 43.0, d.f. 2, p <2 × 10⁻¹⁶) were observed, as well as interactions of group by laterality (F = 28.7, d.f. 2, p = 2.48 × 10⁻¹²) and of group by subfield (F = 29.5, d.f. 4, p <2 × 10⁻¹⁶). As shown in Figure 5, LOW atrophy patients had significant contraction in the subicular and dentate/CA2-4 regions compared to controls, particularly in the ipsilateral hippocampus (SUB: t = 4.23, p = 0.0001; DENT/CA2-4: t = 2.84, p = 0.0068). Interestingly, the CA1 subregion instead showed an expansion compared to controls in the LOW atrophy group, a weakly significant effect both ipsilaterally (t = −2.32, p = 0.024) and contralaterally (t = −2.21, p = 0.031), likely carried by the regions of dorsal hippocampal head expansion noted in Figures 2–3. In HIGH atrophy patients all subregions showed significant contraction compared to controls, more ipsilaterally than contralaterally.
Figure 5.

A. Borders of the CA1 (blue), subiculum (red) and dentate/CA2-4 (orange) subregions overlaid on the hippocampal template. B. Relative expansion (positive y axis) or contraction (negative y axis) for each group in each subregion for ipsilateral (top) and contralateral (bottom) hippocampi. For the patient groups asterisks indicate significant difference from controls (*: p<.05, ***: p<.0001).
The key finding of this analysis was therefore that MRI-negative TLE patients had significant subicular and dentate contraction without exhibiting CA1 contraction (showing in fact a weak expansion), in contrast with the significant contraction in all hippocampal subregions noted in MRI-positive patients.
Medial atrophy is a fixed effect, lateral atrophy covaries with disease duration
To explore which hippocampal regions are affected by TLE via an all-or-none effect and which show an effect proportional to disease duration, an analysis pooling all patients was conducted using a fixed effect of disease and a continuous covariate of disease duration (Figure 6). A strong main effect of disease manifested as atrophy in both medial and lateral locations, though slightly favoring medial regions. The addition of the disease duration covariate to the model also revealed a weak but significant effect of disease duration on the atrophy of the lateral aspect of the hippocampus ipsilateral to seizure onset, roughly colocalizing with the CA1 subfield.
Figure 6.

Main effect of disease and disease duration on local hippocampal shape. Regions of significant hippocampal surface contraction (blue/teal) or expansion (orange/red) (p <.05, after multiple comparison correction) are shown together with borders of the CA1, subiculum and dentate/CA2-4 subregions. Note the strong main effect of disease manifesting as significant surface contraction in both medial and lateral locations, as well as the weak effect of disease duration noted laterally.
Discussion
While classic TLE is characterized by mesial temporal sclerosis (MTS) 20, many patients with temporal lobe seizures have normal hippocampal volumes (MRI-negative). When atrophy is present, it is often a marker for MTS, with neuronal loss and gliosis in the CA1 (and CA3) subfields 21. Past studies of MRI-negative TLE have shown clinical and pathophysiologic differences from TLE associated with MTS. Carne et al. showed that MRI-negative patients have much more widespread hypometabolism and less frequent febrile seizures 5. Multiple studies have shown different regions of cortical atrophy in TLE patients with and without MRI evidence of MTS 22,23, suggesting that MRI-positive and MRI-negative TLE represent distinct syndromes.
The classic finding of CA1 atrophy seen with MTS incompletely captures the extent of histopathologic changes in patients with temporal lobe seizures. Intractable seizures do not inevitably cause neuronal loss 24 and some patients have no evidence of pathology 25. Conversely, up to a 60–80% reduction in cell density has been noted in the prosubicular and subicular regions 25. Others have noted excessive folding and convolutions in the CA1/subicular boundary region of patients with classical features of MTS 24, and the subiculum has been implicated as a generator of interictal spike activity 26. Importantly, this has been seen in both sclerotic and non-sclerotic hippocampi 27, interpreted as suggesting that CA1 pathology is not a requisite for hippocampal epileptogenicity, and that subicular neurons could assume the role of epileptogenic foci even in the presence of normal CA1 projections 28. Neuropathologic studies require either perioperative or post mortem tissue resection, leading to a potential selection bias; noninvasive identification of focal pathology is thus attractive, and could be applied to the broad population of patients with temporal lobe seizures and guide therapeutic options based on a more complete picture of the disease.
Here we used a modified version of the surface-based HDM-LD method that is invariant to surface registration artifacts to investigate differences between MRI-positive and MRI-negative TLE (HIGH and LOW atrophy groups respectively) by evaluating subregional changes in the hippocampus. There were four key findings: First, TLE LOW patients had significant subregional hippocampal shape changes compared to controls despite having normal hippocampal volumes, consisting of local medial hippocampal atrophy. Second, local shape changes in these patients were similar to those observed in the contralateral hippocampus in the TLE HIGH group. Third, local shape changes in the TLE LOW group primarily involved the subicular and hilar/dentate regions, instead of the CA1 region, which instead was significantly affected in the TLE HIGH group. Fourth, the CA1 region showed a significant effect of length of the disease, while the subicular and hilar/dentate regions did not.
Medial hippocampal atrophy in “MRI-negative” TLE: one end of a spectrum or a separate clinical entity?
If MRI-negative TLE patients represent the end of a continuum of progressively increasing hippocampal atrophy tied to increasing seizure burden, patients in the TLE LOW group should have local shapes changes qualitatively similar to those in the high atrophy group but of lesser intensity. Indeed, this was our expectation prior to conducting this study. Yet in the TLE LOW group we found significant atrophy in the subicular region, with no atrophy (or if anything an enlargement) of the CA1 region. However, when all patients were combined, the effect of disease duration was confined to the CA1 region. At least two potential explanations may account for this pattern. In one scenario, CA1 atrophy is a marker of neuronal loss, roughly dependent on disease duration, while subicular atrophy is an all-or-none indicator of hippocampal epileptogenic pathology 27, without progression over the course of the disease. However, our finding of similar medial atrophy in the contralateral hippocampus, which given our selection criteria should not have been epileptogenic, suggests an alternative: CA1 atrophy is a marker of primary hippocampal epileptogenesis, while subicular atrophy is a marker of indirect damage from temporal lobe seizures (i.e. “secondary epileptogenesis”)29. In this scenario patients with hippocampal seizures would have both subicular and CA1 atrophy, the latter commensurate to disease duration. Patients with seizures that originate outside the hippocampus (e.g. temporal neocortex) would have atrophy restricted to the subicular/medial hippocampus - an indirect effect akin to the waves of a distant storm washing on the shores of the subiculum in retrograde fashion. Indeed there is evidence that chemically induced status epilepticus in rats causes widespread damage that includes many extrahippocampal structures, including subiculum and parasubiculum 30,31.
Local atrophy and disease duration
Degree of CA1 neuronal loss has inconsistently been tied to duration of epilepsy histopathologically, with some investigators not finding such a relationship even with quantitative analysis 24,25 and others showing an effect 32. In our study we replicated prior findings of lateral hippocampal atrophy assessed via hippocampal surface modeling 6,14, and expanded its significance with the finding of a significant effect of disease duration on the local atrophy of the CA1 region, similar to that recently reported by Bernhardt and colleagues in a longitudinal cohort 33. Importantly, we saw no such effect in the subiculum and medial hippocampus, which instead showed a strong main effect of disease. Given the topologically restricted effect and inherently heterogeneous measure of “disease duration” it is not surprising that this relationship has been difficult to reveal pathologically. Within the context of histopathologic evidence tying hippocampal neuronal cell density to disease duration, our finding validates local atrophy calculated by our method as an indirect indicator of neuronal loss. Clearly “disease duration” by no means fully captures the severity or ebbs and flows of epilepsy over the course of a patient’s lifetime. Future studies employing more sophisticated quantitative measures of disease intensity and burden may reveal even stronger relationships with local hippocampal changes.
Regions of local expansion
In addition to the loci of atrophy, there were smaller regions of expansion, primarily in LOW atrophy patients, clustered dorsally in the bilateral hippocampal heads. Since our surface estimate does not rely on surface registration, this finding could not be simply attributed to registration artifact between patient and control surfaces; rather it represents actual surface deformity when comparing the two groups, with potential physiologic significance. There is evidence that certain hippocampal regions show hypertrophy after hippocampal seizures in rats 34. Seizure-induced dentate/hilar neurogenesis has also been repeatedly observed in kainate, pilocarpine and kindling animal models of epilepsy 35, with comparative changes in human hippocampi after epilepsy surgery 36. Regions of local hippocampal expansion have also been reported in animal models of traumatic epilepsy 37. Therefore, regions of surface expansion noted in this study may reflect pathophysiologic changes due to chronic temporal lobe seizures.
Technical considerations
MRI-based hippocampal segmentation has used landmark-based and fully automated approaches 38. The use of algorithms that account for subtle changes in hippocampal surface structure, including malrotation 39, is crucial for epilepsy. Here, we introduced a method of surface estimation that depends exclusively on local shape deformation and is invariant to registration artifact, minimizing the impact of this confound on our estimates. Our hippocampal surface comparison and subfield mapping techniques increase our ability to detect differences in subjects with MRI-positive and MRI negative TLE. However hippocampal subfield boundary estimation is notoriously challenging to achieve using MR images, which represents a potential weakness of this study, such that the subfield boundaries provided by our method should be considered to be representative of the general location of the subfields, not accouting for individual variability. Higher field strengths leading to higher image resolution than the one used in this study likely provide more reliable subfield segmentation 40. In this fashion, with improved future methods, hippocampal subfield surface modeling at the individual level could help better differentiate MRI positive and negative subjects, and be used in conjunction with other tests to confirm and refine the diagnosis of TLE. Given the importance of correlating structural MRI lesions with EEG findings to optimize epilepsy surgery outcome quantitative verification of hippocampal subfield surface changes may play a role in defining approaches for epilepsy surgery, as well as providing information about postoperative prognosis.
Conclusions
We found two patterns of local hippocampal surface change in TLE patients: one consisting of widespread local surface contraction, maximal in the CA1 region, characteristic of MRI-positive patients, and another with more localized medial bilateral changes, involving the subicular/hilar region, seen in MRI-negative patients. While the former pattern may reflect a direct effect of the pathologic process also involved in epileptogenesis, the latter may instead be indicative of seizure propagation to the medial temporal region. The local changes observed may have value in identifying patients with temporal lobe seizures with medial vs. neocortical onset, though correlation with pathologic findings and surgical outcome will be necessary to establish that link.
Acknowledgments
We thank Dr. Lei Wang of Northwestern University for valuable discussions and for providing the hippocampal subfield segmentation. This work was supported by the National Center for Advancing Translational Sciences (UL1TR000448, sub award KL2TR000450 to L.M.), and the Institute of Clinical and Translational Sciences at Washington University (UL1RR024992 to R.H.).
Footnotes
Disclosure of Conflicts of Interest
None of the authors has any conflict of interest to disclose. We confirm that we have read the Journal’s position on issues involved in ethical publication and affirm that this report is consistent with those guidelines.
References
- 1.Kuzniecky R, de la Sayette V, Ethier R, et al. Magnetic resonance imaging in temporal lobe epilepsy: pathological correlations. Ann Neurol. 1987;22:341–7. doi: 10.1002/ana.410220310. [DOI] [PubMed] [Google Scholar]
- 2.Jack C, Sharbrough F, Cascino G, et al. Magnetic resonance image–based hippocampal volumentry: Correlation with outcome after temporal lobectomy. Ann Neurol. 1992;31:138–146. doi: 10.1002/ana.410310204. [DOI] [PubMed] [Google Scholar]
- 3.Bernasconi N, Natsume J, Bernasconi A. Progression in temporal lobe epilepsy: differential atrophy in mesial temporal structures. Neurology. 2005;65:223–8. doi: 10.1212/01.wnl.0000169066.46912.fa. [DOI] [PubMed] [Google Scholar]
- 4.Keller SS, Wieshmann UC, Mackay CE, et al. Voxel based morphometry of grey matter abnormalities in patients with medically intractable temporal lobe epilepsy: effects of side of seizure onset and epilepsy duration. J Neurol Neurosurg Psychiatry. 2002;73:648–55. doi: 10.1136/jnnp.73.6.648. [DOI] [PMC free article] [PubMed] [Google Scholar]
- 5.Carne RP, O’Brien TJ, Kilpatrick CJ, et al. MRI-negative PET-positive temporal lobe epilepsy: a distinct surgically remediable syndrome. Brain. 2004;127:2276–85. doi: 10.1093/brain/awh257. [DOI] [PubMed] [Google Scholar]
- 6.Kim H, Mansi T, Bernasconi N. Disentangling hippocampal shape anomalies in epilepsy. Front Neurol. 2013;4:131. doi: 10.3389/fneur.2013.00131. [DOI] [PMC free article] [PubMed] [Google Scholar]
- 7.Van Paesschen W, Revesz T, Duncan JS, et al. Quantitative neuropathology and quantitative magnetic resonance imaging of the hippocampus in temporal lobe epilepsy. Ann Neurol. 1997;42:756–66. doi: 10.1002/ana.410420512. [DOI] [PubMed] [Google Scholar]
- 8.Ho SS, Kuzniecky RI, Gilliam F, et al. Temporal lobe developmental malformations and epilepsy: Dual pathology and bilateral hippocampal abnormalities. Neurology. 1998;50:748–754. doi: 10.1212/wnl.50.3.748. [DOI] [PubMed] [Google Scholar]
- 9.Voets NL, Bernhardt BC, Kim H, et al. Increased temporolimbic cortical folding complexity in temporal lobe epilepsy. Neurology. 2011;76:138–44. doi: 10.1212/WNL.0b013e318205d521. [DOI] [PMC free article] [PubMed] [Google Scholar]
- 10.Kim H, Chupin M, Colliot O, et al. Automatic hippocampal segmentation in temporal lobe epilepsy: impact of developmental abnormalities. Neuroimage. 2012;59:3178–86. doi: 10.1016/j.neuroimage.2011.11.040. [DOI] [PubMed] [Google Scholar]
- 11.Bernasconi N, Kinay D, Andermann F, et al. Analysis of shape and positioning of the hippocampal formation: an MRI study in patients with partial epilepsy and healthy controls. Brain. 2005;128:2442–52. doi: 10.1093/brain/awh599. [DOI] [PubMed] [Google Scholar]
- 12.Keller SS, Roberts N. Voxel-based morphometry of temporal lobe epilepsy: an introduction and review of the literature. Epilepsia. 2008;49:741–57. doi: 10.1111/j.1528-1167.2007.01485.x. [DOI] [PubMed] [Google Scholar]
- 13.Gardner R, Hogan RE. Three-dimensional deformation-based hippocampal surface anatomy, projected on MRI images. Clin Anat. 2005;18:481–7. doi: 10.1002/ca.20183. [DOI] [PubMed] [Google Scholar]
- 14.Hogan RE, Wang L, Bertrand ME, et al. MRI-based high-dimensional hippocampal mapping in mesial temporal lobe epilepsy. Brain. 2004;127:1731–1740. doi: 10.1093/brain/awh197. [DOI] [PubMed] [Google Scholar]
- 15.Kim H, Besson P, Colliot O, et al. Surface-based vector analysis using heat equation interpolation: a new approach to quantify local hippocampal volume changes. Med Image Comput Comput Assist Interv. 2008;11:1008–15. doi: 10.1007/978-3-540-85988-8_120. [DOI] [PubMed] [Google Scholar]
- 16.Styner M, Lieberman JA, Pantazis D, et al. Boundary and medial shape analysis of the hippocampus in schizophrenia. Med Image Anal. 2004;8:197–203. doi: 10.1016/j.media.2004.06.004. [DOI] [PubMed] [Google Scholar]
- 17.Wieser HG. Ictal manifestations of temporal lobe seizures. In: Smith D, Treiman D, Trimble M, editors. Advances in neurology. New York: Raven Press; 1991. pp. 301–15. [PubMed] [Google Scholar]
- 18.Hogan R, Mark K, Wang L, et al. Mesial temporal sclerosis and temporal lobe epilepsy: MR imaging deformation-based segmentation of the hippocampus in five patients. Radiology. 2000;216:291–297. doi: 10.1148/radiology.216.1.r00jl41291. [DOI] [PubMed] [Google Scholar]
- 19.Hogan RE, Moseley ED, Maccotta L. Hippocampal surface deformation accuracy in T-1 weighted volumetric MRI sequences in subjects with epilepsy. J Neuroimaging. 2014 doi: 10.1111/jon.12135. [DOI] [PMC free article] [PubMed] [Google Scholar]
- 20.Hogan RE. Mesial temporal sclerosis: clinicopathological correlations. Arch Neurol. 2001;58:1484–6. doi: 10.1001/archneur.58.9.1484. [DOI] [PubMed] [Google Scholar]
- 21.Thom M, Sisodiya SM, Beckett A, et al. Cytoarchitectural abnormalities in hippocampal sclerosis. J Neuropathol Exp Neurol. 2002;61:510–9. doi: 10.1093/jnen/61.6.510. [DOI] [PubMed] [Google Scholar]
- 22.Mueller SG, Laxer KD, Barakos J, et al. Widespread neocortical abnormalities in temporal lobe epilepsy with and without mesial sclerosis. Neuroimage. 2009;46:353–9. doi: 10.1016/j.neuroimage.2009.02.020. [DOI] [PMC free article] [PubMed] [Google Scholar]
- 23.Bernhardt BC, Bernasconi N, Concha L, et al. Cortical thickness analysis in temporal lobe epilepsy: reproducibility and relation to outcome. Neurology. 2010;74:1776–84. doi: 10.1212/WNL.0b013e3181e0f80a. [DOI] [PubMed] [Google Scholar]
- 24.Thom M, Zhou J, Martinian L, et al. Quantitative post-mortem study of the hippocampus in chronic epilepsy: seizures do not inevitably cause neuronal loss. Brain. 2005;128:1344–57. doi: 10.1093/brain/awh475. [DOI] [PubMed] [Google Scholar]
- 25.Babb TL, Brown WJ, Pretorius J, et al. Temporal lobe volumetric cell densities in temporal lobe epilepsy. Epilepsia. 1984;25:729–40. doi: 10.1111/j.1528-1157.1984.tb03484.x. [DOI] [PubMed] [Google Scholar]
- 26.Cohen I, Navarro V, Clemenceau S, et al. On the origin of interictal activity in human temporal lobe epilepsy in vitro. Science. 2002;298:1418–21. doi: 10.1126/science.1076510. [DOI] [PubMed] [Google Scholar]
- 27.Wozny C, Kivi A, Lehmann T-N, et al. Comment on “On the origin of interictal activity in human temporal lobe epilepsy in vitro”. Science. 2003;301:463. doi: 10.1126/science.1084237. author reply 463. [DOI] [PubMed] [Google Scholar]
- 28.Palma E, Amici M, Sobrero F, et al. Anomalous levels of Cl− transporters in the hippocampal subiculum from temporal lobe epilepsy patients make GABA excitatory. Proc Natl Acad Sci U S A. 2006;103:8465–8. doi: 10.1073/pnas.0602979103. [DOI] [PMC free article] [PubMed] [Google Scholar]
- 29.Sloviter RS. Hippocampal epileptogenesis in animal models of mesial temporal lobe epilepsy with hippocampal sclerosis: the importance of the “latent period” and other concepts. Epilepsia. 2008;49 (Suppl 9):85–92. doi: 10.1111/j.1528-1167.2008.01931.x. [DOI] [PubMed] [Google Scholar]
- 30.Scholl Ea, Dudek FE, Ekstrand JJ. Neuronal degeneration is observed in multiple regions outside the hippocampus after lithium pilocarpine-induced status epilepticus in the immature rat. Neuroscience. 2013;252:45–59. doi: 10.1016/j.neuroscience.2013.07.045. [DOI] [PMC free article] [PubMed] [Google Scholar]
- 31.Knopp A, Frahm C, Fidzinski P, et al. Loss of GABAergic neurons in the subiculum and its functional implications in temporal lobe epilepsy. Brain. 2008;131:1516–27. doi: 10.1093/brain/awn095. [DOI] [PubMed] [Google Scholar]
- 32.Fuerst D, Shah J, Kupsky WJ, et al. Volumetric MRI, pathological, and neuropsychological progression in hippocampal sclerosis. Neurology. 2001;57:184–188. doi: 10.1212/wnl.57.2.184. [DOI] [PubMed] [Google Scholar]
- 33.Bernhardt BC, Kim H, Bernasconi N. Patterns of subregional mesiotemporal disease progression in temporal lobe epilepsy. Neurology. 2013;81:1840–7. doi: 10.1212/01.wnl.0000436069.20513.92. [DOI] [PMC free article] [PubMed] [Google Scholar]
- 34.Bertram EH, Lothman EW, Lenn NJ. The hippocampus in experimental chronic epilepsy: a morphometric analysis. Ann Neurol. 1990;27:43–8. doi: 10.1002/ana.410270108. [DOI] [PubMed] [Google Scholar]
- 35.Parent JM. Adult neurogenesis in the intact and epileptic dentate gyrus. Prog Brain Res. 2007;163:529–40. doi: 10.1016/S0079-6123(07)63028-3. [DOI] [PubMed] [Google Scholar]
- 36.Parent JM, Elliott RC, Pleasure SJ, et al. Aberrant seizure-induced neurogenesis in experimental temporal lobe epilepsy. Ann Neurol. 2006;59:81–91. doi: 10.1002/ana.20699. [DOI] [PubMed] [Google Scholar]
- 37.Shultz SR, Cardamone L, Liu YR, et al. Can structural or functional changes following traumatic brain injury in the rat predict epileptic outcome? Epilepsia. 2013;54:1240–1250. doi: 10.1111/epi.12223. [DOI] [PMC free article] [PubMed] [Google Scholar]
- 38.Chupin M, Hammers a, Liu RSN, et al. Automatic segmentation of the hippocampus and the amygdala driven by hybrid constraints: method and validation. Neuroimage. 2009;46:749–61. doi: 10.1016/j.neuroimage.2009.02.013. [DOI] [PMC free article] [PubMed] [Google Scholar]
- 39.Kim H, Chupin M, Colliot O, et al. Automatic hippocampal segmentation in temporal lobe epilepsy: impact of developmental abnormalities. Neuroimage. 2012;59:3178–86. doi: 10.1016/j.neuroimage.2011.11.040. [DOI] [PubMed] [Google Scholar]
- 40.Theysohn JM, Kraff O, Maderwald S, et al. The human hippocampus at 7 T--in vivo MRI. Hippocampus. 2009;19:1–7. doi: 10.1002/hipo.20487. [DOI] [PubMed] [Google Scholar]