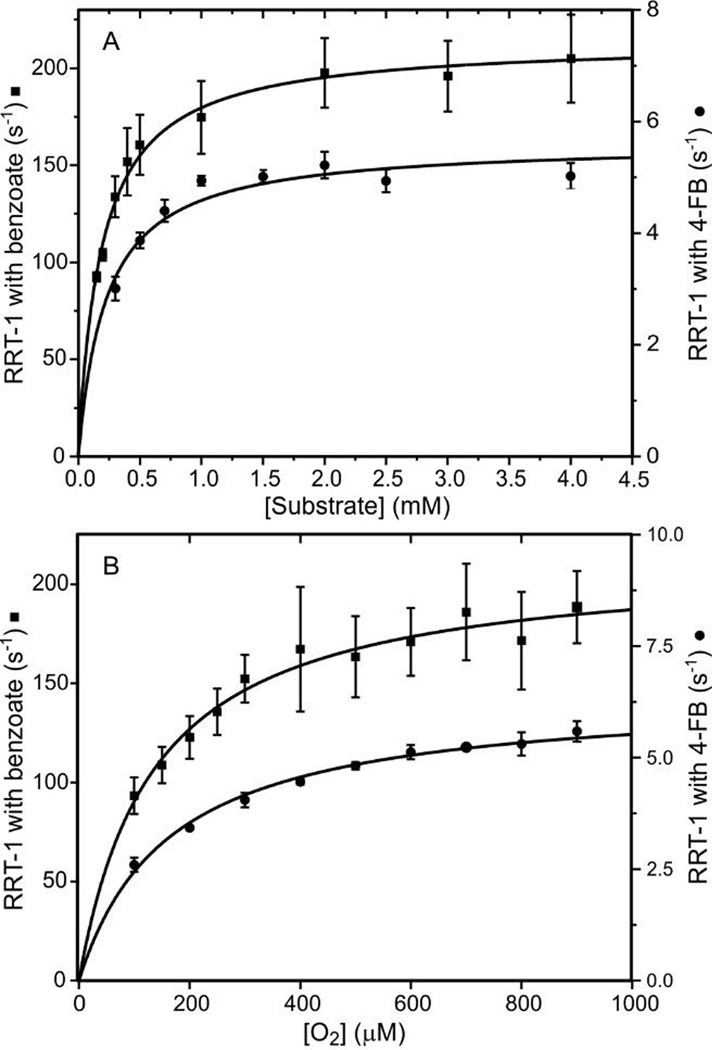
Figure 4.
Substrate and O2 concentration dependence of RRT-1 reveals a common subsequent slow step. Reduced BZDO (60 µM) was mixed 1:1 in a stopped-flow spectrophotometer with reaction buffer containing either (A) O2 (saturated solution at 4 °C ≈ 1.8 mM) and varied concentrations of benzoate or 4-FB, or (B) varied concentrations of O2 and benzoate (5 mM) or 4-FB (5 mM). RRT-1 from multiexponential fitting of stopped-flow traces (n ≥ 6 and 4 for the reaction of benzoate and 4FB, respectively) was plotted vs (A) substrate or (B) O2 concentration. Reported error of each point is one standard deviation of the mean. Kd and kforward values were determined by fitting the data to a hyperbolic function (solid curve) and are reported in Table 2.

