Abstract
This study assessed spatial context and the local impacts of putative factors on the proportion of prostate cancer diagnosed at late-stages in Florida during the period 2001–2007. A logistic regression was performed aspatially and by geographically-weighted regression (GWR) at the nodes of a 5 km spacing grid overlaid over Florida and using all the cancer cases within a radius of 125 km of each node. Variables associated significantly with high percentages of late-stage prostate cancer included having comorbidities, smoking, being Black and living in census tracts with farmhouses. Having private or public insurance, being married or diagnosed in a for-profit facility, as well as living in census tracts with high household income reduced significantly this likelihood. Geographically-weighted regression allowed the identification of areas where the local odds ratio is significantly different from the ratio estimated using aspatial regression (State-level). For example, the local odds ratios for the comorbidity covariates were significantly smaller than the State-level odds ratio in Tallahassee and Pensacola, while they were significantly larger in Palm Beach. This emphasizes the need for local strategies and cancer control interventions to reduce the percentage of prostate cancer diagnosed at late-stages and ultimately eliminate health disparities.
Introduction
Prostate cancer (PCa) is the most common solid malignancy and the second leading cause of cancer-related death for American men. It has been estimated that there will be 233,000 new cases and 29,480 deaths from this disease in the United States (US) in 2014 (American Cancer Society, 2014). The State of Florida ranks second, behind California, for both incidence (16,590 estimated new cases) and mortality (2,170 estimated deaths) from PCa in 2014 (American Cancer Society, 2014).
Difference in individual and contextual factors—including age, race, socioeconomic status (SES), comorbidity, geographic location, and access to health care, display striking disparities across geographic regions with respect to the incidence, mortality and percent of PCa diagnosed at late-stages. For instance, PCa incidence rates are approximately 70 percent higher for African Americans than for Caucasians and death rate are twice as high for African Americans as for any other racial/ethnic group (American Cancer Society, 2013). An important factor associated with high percentage of late-stage PCa is the presence and severity of comorbidity. Comorbidity is the co-occurrence of one or more diseases or disorders in an individual (Bartsch et al., 1992; Siu, Lau, Tam, & Shiu, 2002). Comorbidity reflects the aggregate effect of all clinical conditions a patient might have, excluding the disease of primary interest (Arcangeli, Smith, Ratliff, & Catalona, 1997). A growing body of evidence supports the association of PCa risk with farming, due to exposure to toxic chemicals, especially pesticides (Alavanja et al., 2003; Meyer, Coker, Sanderson, & Symanski, 2007; Settimi, Masina, Andrion, & Axelson, 2003). Geographical disparities in percent of late-stage PCa have been associated with poor access to primary health care, lack of health insurance and difference in coverage (Mandelblatt, Yabroff, & Kerner, 1999; Mullins, Blatt, Gbarayor, Yang, & Baquet, 2005; Roetzheim et al., 1999; Talcott et al., 2007).
Studies of geographic variations have made important contributions to our understanding of how geography, individual and contextual factors jointly shape the distribution of PCa incidence and percent of late-stage PCa. To our knowledge, no PCa studies have explicitly investigated spatial heterogeneity in individual and contextual factor differences across counties in the State of Florida.
The study of the correlation between health data and risk factors is traditionally performed using global or aspatial regression, with the implicit assumption that the impact of covariates is constant across the study area. This assumption is likely unrealistic for large states such as Florida that display substantial geographic variation in demographic, social, economic, and environmental conditions. To account for the non-stationarity of relationships in space, aspatial regression can be supplemented with geographically-weighted regression (GWR), whereby the regression model is fitted within local windows selected by the user so as to include enough observations. Each observation (i.e. prostate cancer case whose residence falls within that window) is weighted according to its proximity to the center of the window (Fotheringham, Brunsdon, & Charlton, 2003). Local regression coefficients and associated statistics (i.e. proportion of variance explained, odds ratio) can then be mapped to visualize how the explanatory power of covariates changes spatially (Cardozo, García-Palomares, & Gutiérrez, 2012; Mennis, 2006; Su, Xiao, & Zhang, 2012).
A study by Goovaerts introduced the first application of GWR to the analysis of health disparities, with a study of PCa mortality across the United States (Goovaerts, 2005). Wheeler & Tiefelsdorf used GWR to explore local relationships between bladder cancer mortality rates at the state economic area (a group of similar counties) level and two explanatory variables: population density (proxy for environmental and behavioral differences) and lung cancer mortality rates (proxy for the risk factor smoking) (Wheeler & Tiefelsdorf, 2005). The same year, Nakaya and colleagues developed a geographically weighted Poisson regression approach to conduct ecological regression (i.e. study of relationship between aggregated data) in space, with an application to the relationship between working-age death in the Tokyo metropolitan area and socio-economic factors (Nakaya, Fotheringham, Brunsdon, & Charlton, 2005). Since then, geographically-weighted regression has been increasingly applied to the analysis of local relationships between health outcomes and putative factors (Chen & Truong, 2012; Chen, Wu, Yang, & Su, 2010; Chi, Grigsby-Toussaint, Bradford, & Choi, 2013; Shoff, Chen, & Yang, 2014; Yang & Matthews, 2012). Most studies have however been conducted using aggregated health data, such as county-level rates, and application to PCa data has been sparse. This study aims to conduct regression analysis in a spatial context to assess the local impacts of individual and contextual factors on percent of late-stage PCa in Florida.
Materials and Methods
Data and data sources
The analysis was conducted on 39,374 cases aged 40 or older that were diagnosed with PCa in the State of Florida between 10/1/2001 and 12/31/2007. Data were obtained from four different sources and at three different spatial scales (individual, census tract, county). First, individual-level data were acquired from the Florida Cancer Data System (FCDS) housed at the University of Miami. The FCDS was established as the state central cancer registry in 1981, and is the largest single population-based cancer incidence registry in the nation (Florida Department of Health, 2014). The FCDS has been part of the Centers for Disease Control and Prevention National Program of Cancer Registries since 1996. The FCDS collects information on patient demographics, residence, prostate tumor characteristics and other data such as tobacco use and primary payer of health insurance.
Second, diagnoses data were obtained from the Florida Agency for Health Care and Administration (AHCA). AHCA maintains two databases (Hospital Patient Discharge Data and Ambulatory Outpatient Data) on all patient encounters within hospitals and freestanding ambulatory surgical and radiation therapy centers in Florida. Comorbidity was computed following the Elixhauser Index method (Elixhauser, Steiner, Harris, & Coffey, 1998) based on diagnoses information from AHCA. The study used a total of 45 conditions, including 29 from the Elixhauser Index plus 16 additional conditions based on clinical characteristics of the study population. The method used to come up with these conditions is explained in greater details in another publication (Xiao et al., 2013).
Third, data on socio-demographic and environmental characteristics were extracted at the census tract level from the U.S. Census Bureau (Census 2000, Summary File-3) public use files for the State of Florida.
Fourth, health provider information by county was obtained from the Florida Department of Health Division of Medical Quality Assurance to calculate provider to case ratios. Specifically, the number of primary health providers and urologists was divided by the number of prostate cancer diagnoses for each county during 2001–2007. This measure was used to capture provider availability.
Statistical Analysis
The relationship between percent of PCa diagnosed at late-stages and putative factors was modeled using logistic regression. The dependent variable is an indicator variable taking a value of 1 if the patient was diagnosed late, and zero otherwise. Covariates include age, race, marital status, smoking, type of health insurance (uninsured, public or private insurance) and facilities (for-profit and not-for-profit) where diagnosis was made, presence of no comorbidity, 1 to 2 comorbidities, more than 2 comorbidities, census-tract median household income and presence of farmhouse, year of diagnosis, county-level provider-to-case ratios.
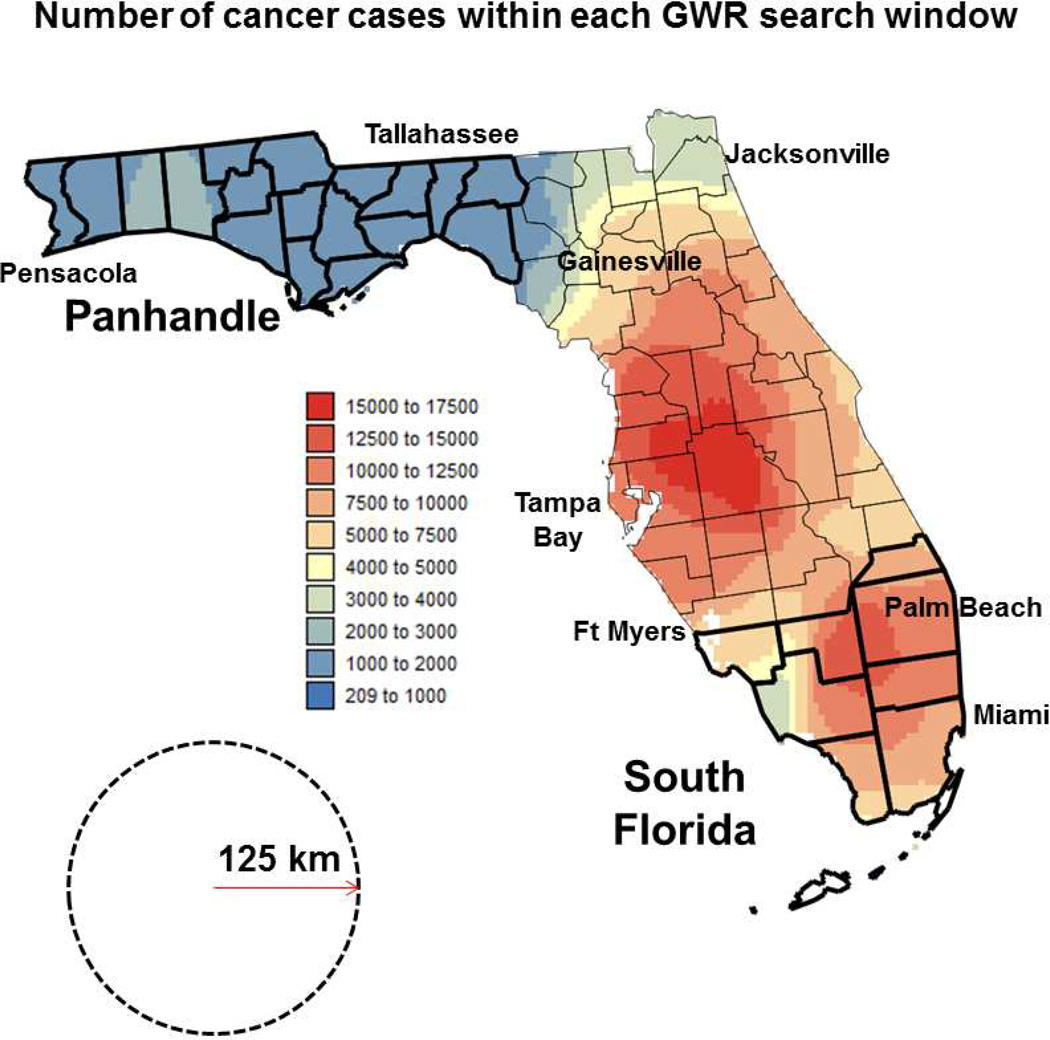
The regression model was fitted using two different methods: 1) the traditional approach that ignores the coordinates of the observations (aspatial regression), and 2) geographically-weighted regression (GWR) that fits a local regression model at the 5,970 nodes of a 5 km spacing grid overlaid over Florida and using all the cancer cases within a radius of 125 km of each node (Figure 1). A grid spacing of 5 km provided enough resolution to map local spatial patterns while keeping the number of regression models (5,970) low enough to be computationally feasible. Details of the procedure can be found in Fotheringham et al. (2003), Cardozo et al. (2012), Chen & Truong (2012), Chi et al. (2013), Su et al. (2012), Wang et al. (2013). In particular, a description of geographically-weighted logistic regression is provided by Rodrigues et al. (2014).
Fig. 1.
Map of the number of prostate cancer cases used for each of the GWR models. This isopleth map is overlaid with Florida county map and labels indicating main regions and cities cited in the discussion section. The black dashed circle represents the window of radius 125 km used for geographically-weighted regression. Counties demarcated by thick boundary lines are part of the Panhandle and South Florida regions.
The window size for GWR had to be large enough to include, for each grid node, all levels of each categorical covariate so that logistic regression could be performed. This condition was satisfied by a radius of 125km, which also ensured that at all but seven grid nodes a minimum of 1,000 observations was available for regression; see the spatial distribution of number of observations in Figure 1. The average and median numbers of cases within each window are 7,237 and 7,598, respectively. The use of a constant window size was preferred over a constant number of observations (e.g. using windows of variable size) to ensure that every pixel in a map represents an area of similar size, which facilitates their interpretation. Each observation in GWR (i.e., a PCa case whose residence falls within that window) was weighted as a function of its proximity to the center of the window. A bisquare adaptive weight function was preferred to the use of a fixed bandwidth because the latter tends to generate more extreme coefficients in GWR maps, which directly affects the visual pattern and may contribute to biased interpretation and misinformed policies (Cho, Lambert, Kim, & Jung, 2009). SpaceStat 4.0 software was used to fit both types of regression model (Jacquez, Goovaerts, Kaufmann, & Rommel, 2014).
For each covariate, an odds ratio (OR) and its 95% confidence interval [L, U] were computed at each node of coordinate ui = (xi,yi). Three maps were created for each continuous covariate (e.g. median household income) or each level for categorical variables (e.g. years of diagnosis, type of insurance and number of comorbidities), at the exception of the reference level (e.g. year 2007 for year of diagnosis):
A map of geographically-weighted means (e.g. local median income, local percentage of cases with a given type of insurance or diagnosed a given year).
A map of locations where the odds ratio is significantly lower than 1 (blue color), significantly higher than 1 (red color), and non-significantly different from 1 (white) at a α-level = 0.05. Because the test of significance is repeated for each of the 5,970 grid nodes, the p-values were corrected for multiple testing using the false discovery rate (FDR) approach which is less restrictive and more powerful than other approaches, such as the simple Bonferroni correction (Caldas de Castro & Singer, 2006).
- A map of locations where the local odds ratios OR(ui) are significantly lower or higher than the State-level odds ratio ORState computed using aspatial regression. Five situations are distinguished based on how the local odds ratios OR(ui) and their 95% confidence intervals [L(ui),U(ui)] relate to the State-level odds ratio ORState and confidence interval [LState,UState] computed by aspatial regression:
- U(ui) < LState: local odds ratio is significantly smaller than the State-level odds ratio (dark blue color)
- U(ui) < ORState: local odds ratio is significantly smaller than the State-level odds ratio if its uncertainty is ignored (light blue color)
- L(ui) < ORState < U(ui): local odds ratio is not significantly different from the State-level odds ratio (white color)
- L(ui) > ORState: local odds ratio is significantly larger than the State-level odds ratio if its uncertainty is ignored (yellow color)
- L(ui) > UState: local odds ratio is significantly larger than the State-level odds ratio (red color)
Results and Discussions
The results from aspatial logistic regression listed in Table 1 indicate that all variables, except age, year of diagnosis, and provider-to-case ratio, have odds ratios (OR) that are significantly different from one. Variables with increased likelihood of higher percentage of late-stage PCa included having 1 to 2 comorbidities (OR=1.698) and more than 2 comorbidities (OR=3.963), smoking (OR=1.283), being Black (OR=1.199) and living in census tracts with farmhouses (OR=1.124). Having private (OR=0.533) or public insurance (OR=0.470), being married (OR=0.787) or diagnosed in a for-profit facility (OR=0.886), as well as living in a census-tract with high income (OR=0.994) reduces significantly the likelihood of having a high percentage of late-stage PCa.
Table 1.
Results of aspatial logistic regression
| Variables | Parameter est. |
Std error |
P value | Odds ratio |
Odds ratio C.I. (95%) |
|---|---|---|---|---|---|
| Intercept | −1.307 | 0.134 | 0.00000* | - | - |
| Age | −0.002 | 0.002 | 0.46015 | 0.998 | 0.994–1.003 |
| Median household income | −0.006 | 0.001 | 0.00000* | 0.994 | 0.992–0.996 |
| Presence of farm house vs. None | 0.117 | 0.042 | 0.00474* | 1.124 | 1.037–1.220 |
| Provider to case ratios | −0.109 | 0.157 | 0.48948 | 0.897 | 0.659–1.221 |
| Current smoker vs. Noncurrent smoker | 0.249 | 0.040 | 0.00000* | 1.283 | 1.185–1.388 |
| Married vs. Unmarried | −0.239 | 0.037 | 0.00000* | 0.787 | 0.733–0.846 |
| Black vs. White | 0.182 | 0.046 | 0.00006* | 1.200 | 1.097–1.312 |
| Year of Diagnosis | |||||
| 2001 vs. 2007 | −0.038 | 0.087 | 0.66032 | 0.962 | 0.811–1.142 |
| 2002 vs. 2007 | −0.107 | 0.062 | 0.08500 | 0.899 | 0.796–1.015 |
| 2003 vs. 2007 | −0.084 | 0.065 | 0.19844 | 0.920 | 0.810–1.045 |
| 2004 vs. 2007 | 0.043 | 0.064 | 0.50322 | 1.043 | 0.921–1.182 |
| 2005 vs. 2007 | 0.038 | 0.063 | 0.54389 | 1.039 | 0.918–1.176 |
| 2006 vs. 2007 | 0.048 | 0.054 | 0.38213 | 1.048 | 0.943–1.165 |
| Private Insurance vs. Uninsured | −0.630 | 0.095 | 0.00000* | 0.533 | 0.442–0.642 |
| Public Insurance vs. Uninsured | −0.755 | 0.097 | 0.00000* | 0.470 | 0.389–0.568 |
| For-profit facilities vs. Not-for-profit | −0.121 | 0.036 | 0.00080* | 0.886 | 0.825–0.951 |
| Comorbidities | |||||
| 1–2 vs. No comorbidities | 0.529 | 0.0376 | 0.00000* | 1.698 | 1.577–1.828 |
| >2 vs. No comorbidities | 1.377 | 0.046 | 0.00000* | 3.963 | 3.619–4.339 |
Significant at 5% level
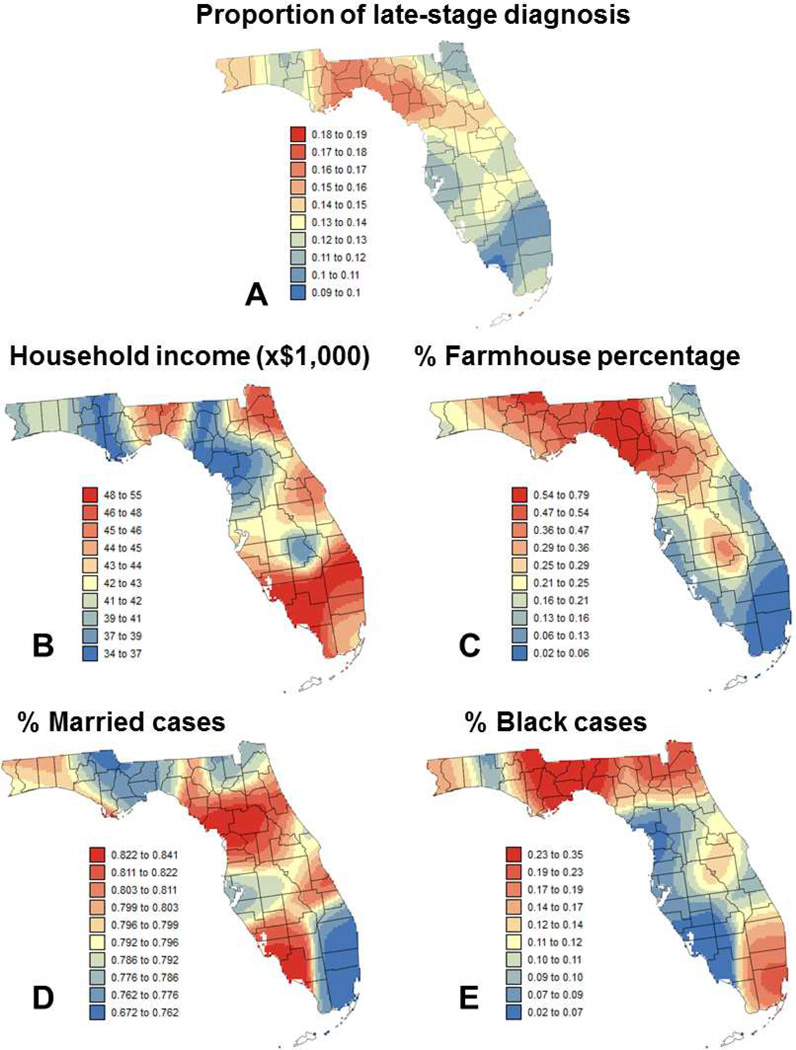
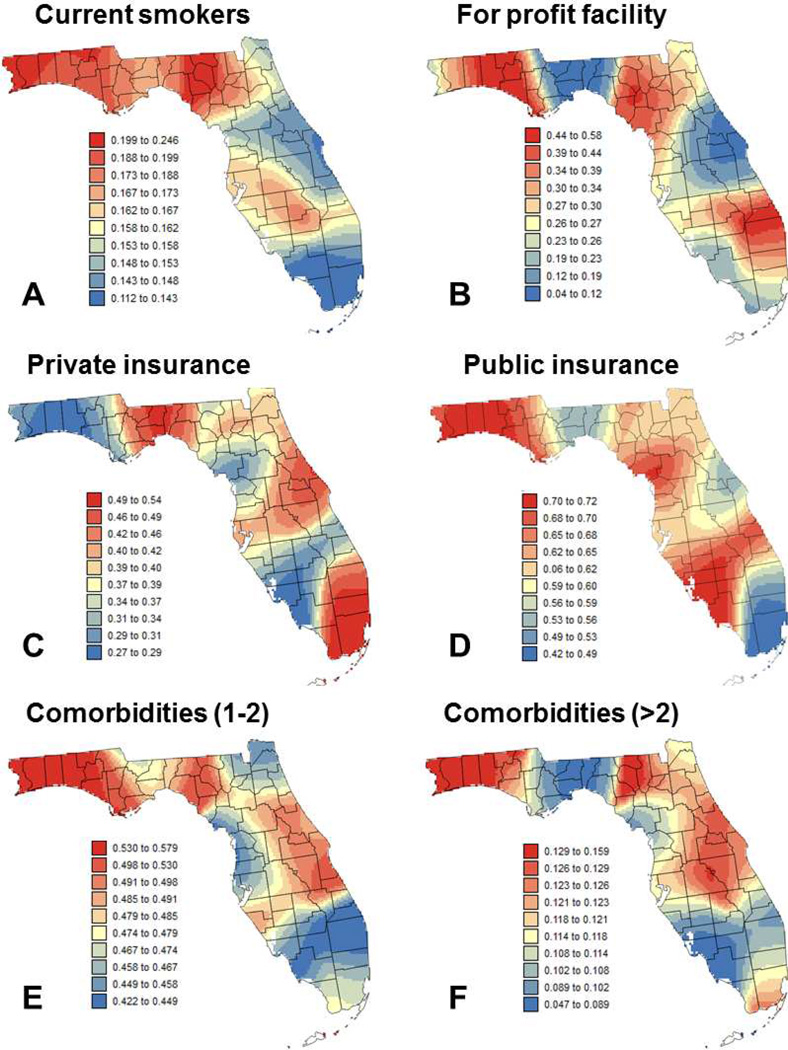
The second approach was to conduct the regression within local windows in order to investigate how the impact of the different covariates on the percent of late-stage PCa changes across Florida. The same covariates listed in Table 1 were used. The first step was to map the local (i.e. geographically-weighted) mean of the dependent variable (Figure 2A) and covariates (Figures 2B–E, Figure 3) across the State. Figure 2A indicates that high percentage of late stage PCa is more widespread in the Florida Panhandle (Northwestern part; see Figure 1), in particular in the Big Bend region. This confirms previous results obtained in a previous study for county-level rates aggregated over the period 1981–2007 for white males (Goovaerts & Xiao, 2011). Maps of covariates illustrate how socio-economic, demographic, behavioral and environmental conditions vary across Florida. For example, Florida Panhandle tends to be more rural, with lower income, higher proportion of smokers and Black males. The largest city in the Panhandle is Tallahassee, the state capital, and cases there are less likely to be diagnosed in for-profit facilities and to have more than two comorbidities, while being more likely to have private insurance. On the other hand, Southeast Florida (Miami, Palm Beach) is more urban with higher incomes, and higher proportions of private insurance and diagnosis in for-profit facilities. Cases there are also less likely to be current smokers, to be married, and to have more than two comorbidities.
Fig. 2.
Maps of: (A) local percentage of late-stage prostate cancer and local means of four putative factors: (B) median income, (C) percentage of farmhouse, (D) percentage of married males, and (E) percentage of Black males. Color scale for all four covariates corresponds to ten classes of equal frequency.
Fig. 3.
Maps of local means of six putative factors: (A) percentage of cases that are current smokers, (B) percentage of cases diagnosed at for-profit facilities, (C) percentage of patients with private insurance, (D) percentage of patients with public insurance, (E) percentage of patients with 1 to 2 comorbidities, and (F) percentage of patients with more than 2 comorbidities. Color scale for all six maps corresponds to ten classes of equal frequency.
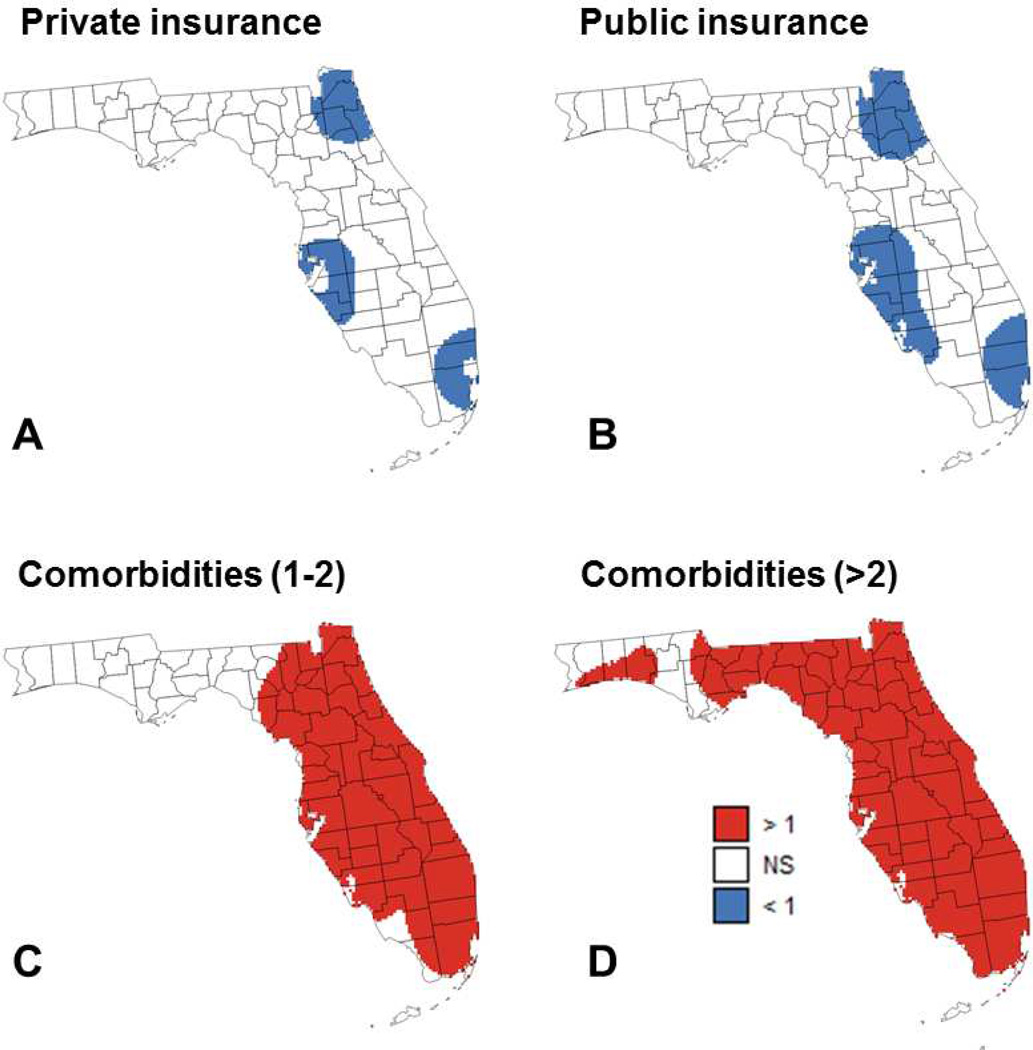
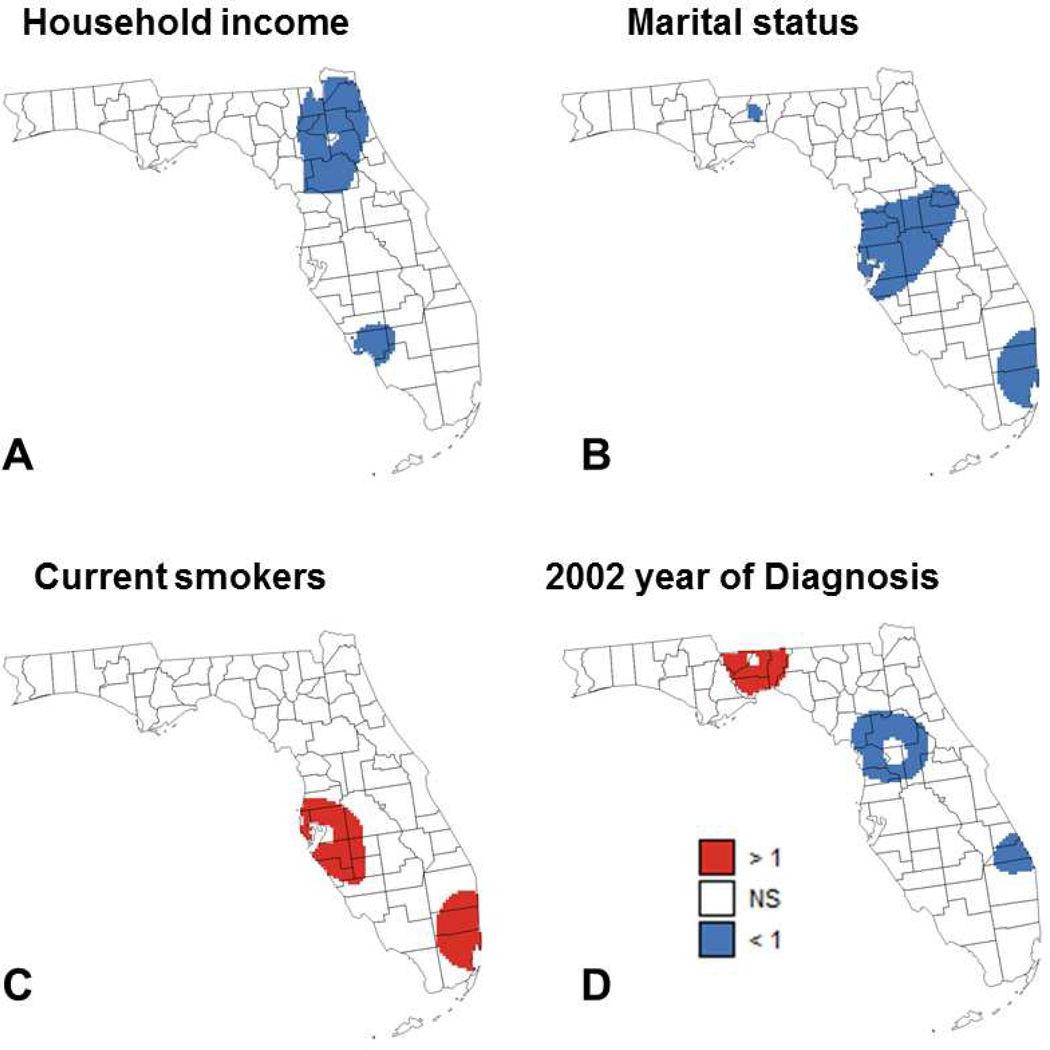
The results of geographically-weighted logistic regression are displayed in Figures 4 and 5 where blue and red pixels indicate which of the 5,970 grid nodes have local odds ratios that are significantly smaller or larger than 1, respectively. Covariates with non-significant results (e.g. race) are not mapped. For most covariates, the sign and proportion of significant local odds ratios agree with the sign and magnitude of global odds ratios listed in Table 1. For example, having private (OR=0.533) or public insurance (OR=0.470) leads to the largest proportion of local odds ratios that are significantly smaller than 1: 16.1% and 25.8%, respectively (Figure 4A&B). Similarly, having 1 to 2 comorbidities (OR=1.697) and more than 2 comorbidities (OR=3.963) leads to the largest proportion of local odds ratios that are significantly larger than 1: 71.9% and 90.0%, respectively (Figure 4C&D). Except for the presence of more than 2 comorbidities, all maps indicate geographical variations in results of regression model across Florida.
Fig. 4.
Maps of locations where the local odds ratio for different putative factors was significantly different from 1 (NS=non-significant): (A) percentage of patients with private insurance, (B) percentage of patients with public insurance, (C) percentage of patients with 1 to 2 comorbidities, and (D) percentage of patients with more than 2 comorbidities.
Fig. 5.
Maps of locations where the local odds ratio for different putative factors was significantly different from 1 (NS=non-significant): (A) median income, (B) percentage of married males, (C) percentage of cases that are current smokers, and (D) percentage of patients diagnosed in 2002 (reference year = 2007).
For the presence of 1 to 2 comorbidities (Figure 4C), the non-significance of the results in the Florida Panhandle is due to two factors: the lack of variability in that covariate (Figure 3E) and the smaller number of cases diagnosed in this region (Figure 1) which hampers the ability to detect significant effects. The same explanation holds true for several covariates that do not have any significant local odds ratio: percentage of farmhouse, and percentage of Black males. The large sample size also explains why the local odds ratios for the two insurance-based covariates (Figure 4A&B) are significant in three heavily populated regions: Palm Beach-Miami, Jacksonville, and Tampa Bay. Marital status and smoking (Figures 5B&C) have only significant odds ratios in two out of these three regions: Palm Beach-Miami and Tampa Bay. Median income (Figure 5A) is the only covariate that has significant odds ratios in the Ft Myers area, which includes a reasonably large number of cases diagnosed. The most interesting results are obtained for the 2002 year of diagnosis (Figure 5D) since: 1) this covariate was not identified as statistically significant in the aspatial logistic regression, 2) this is one of only three covariates (marital status and presence of more than 2 comorbidities are the other two) with significant odds ratios in the sparsely populated Panhandle region, and 3) this is the only covariate that displays both significantly smaller than 1 or larger than 1 local odds ratios. The existence of significantly larger local odds ratios in the Florida Panhandle indicates a significant drop in the percent of late-stage PCa from 2002 to 2007, which agrees with results reported by a previous study (Goovaerts, 2013). In other parts of Florida, this decline in percent of late-stage PCa occurred much earlier (early 1990s) when prostate-specific antigen (PSA) test became widely available. Goovaerts & Xiao also reported that the percentage of late-stage PCa started increasing around 2000 in metropolitan areas of Florida (Goovaerts & Xiao, 2011). This increase was significant for white males and could explain why the local odds ratio in 2002 was significantly smaller compared to the 2007 year of diagnosis, in particular in areas with predominantly white population.
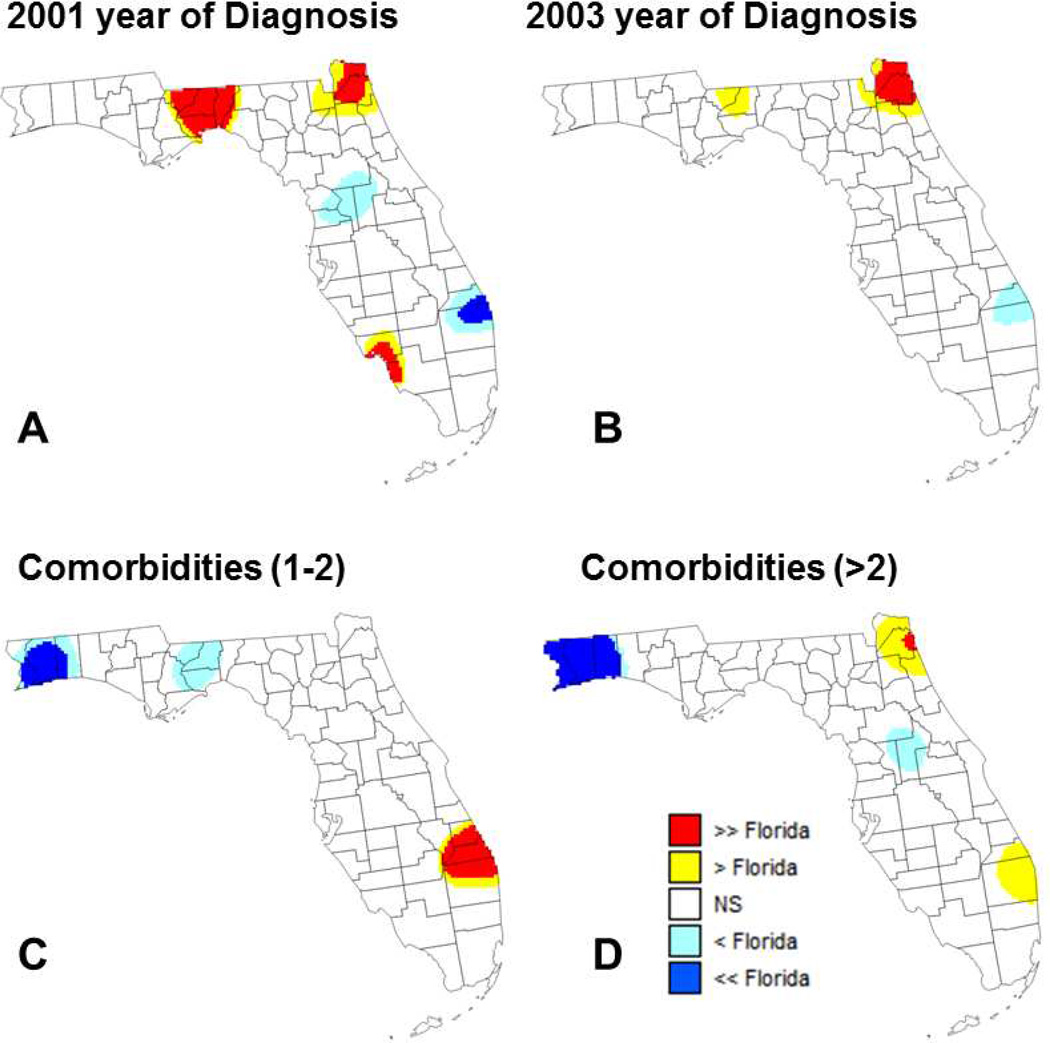
Comparison of results of aspatial and geographically-weighted regression provides additional insights about the spatial variability of relationship between percent of late-stage PCa and putative factors. In this approach detailed in the method section, the global odds ratios (ORState) listed in Table 1 are used as reference for local testing instead of a systematic unit rate (Figures 6 and 7). In other words, the null hypothesis “H0: Local odds ratio equals 1” is replaced by the more specific hypothesis “H0: Local odds ratio equals the State-level odds ratio”. This alternative approach highlights covariates that did not have local odds ratio significantly different from 1 (e.g. diagnosis at for-profit facilities or being diagnosed in 2001 or 2003) whereas other covariates with odds ratios significantly different from 1 (e.g. having private or public insurance) do not display significant differences from State-level results.
Fig. 6.
Maps of locations where the local odds ratio for different putative factors was significantly lower or higher than the state-level ratio estimated using aspatial regression (NS=non-significant): (A) percentage of patients diagnosed in 2001 (reference year = 2007), (B) percentage of patients diagnosed in 2003 (reference year = 2007), (C) percentage of patients with 1 to 2 comorbidities, and (D) percentage of patients with more than 2 comorbidities.
Fig. 7.
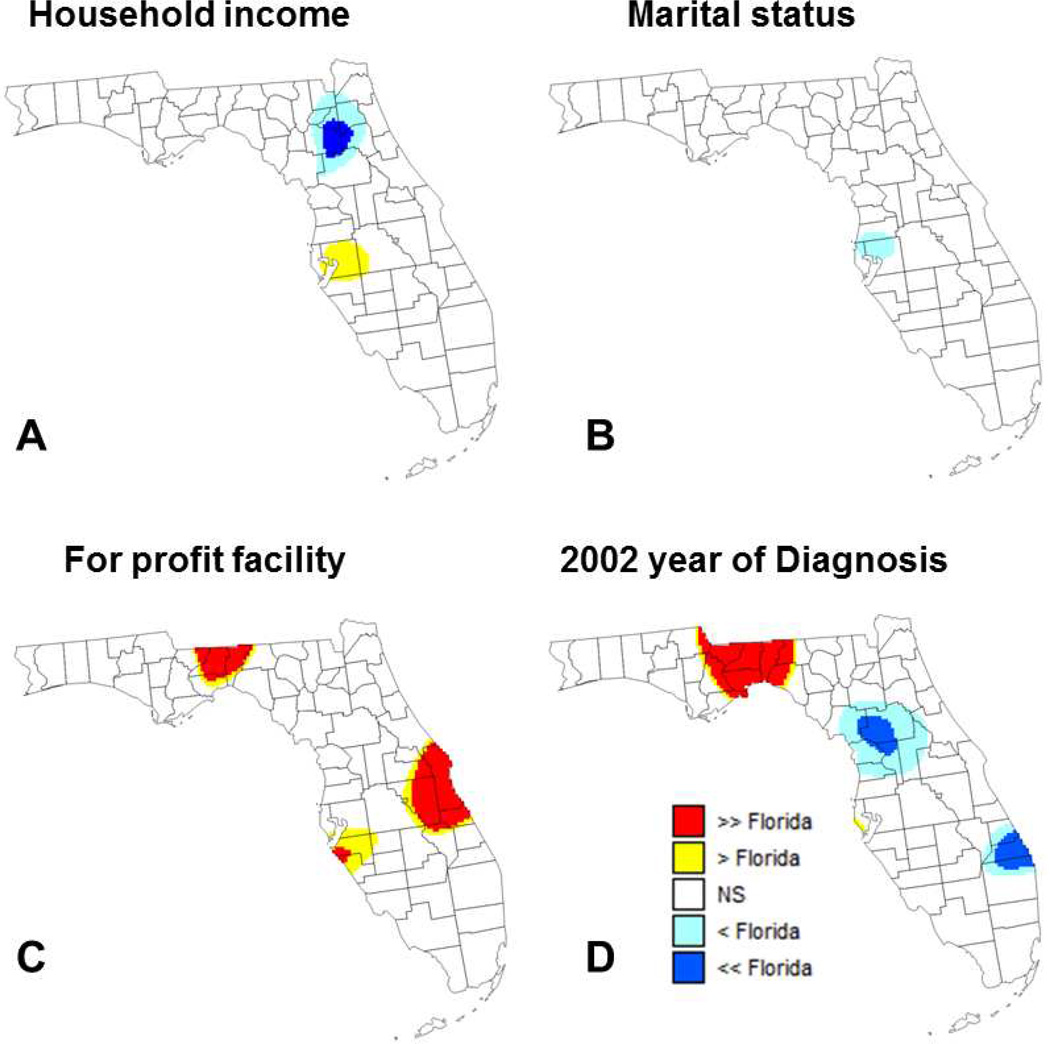
Maps of locations where the local odds ratio for different putative factors was significantly lower or higher than the state-level ratio estimated using aspatial regression (NS=non-significant): (A) median income, (B) percentage of married males, (C) percentage of cases diagnosed at for-profit facilities, and (D) percentage of patients diagnosed in 2002 (reference year = 2007).
The use of covariate-specific reference values reduces the frequency of significant results for several variables, most notably for the two comorbidity factors (Figure 6C&D). In these two maps, the local odds ratio are significantly lower than the State-level ratio in the Florida Panhandle where most odds ratio are not significantly different from 1, which is expected. On the other hand, in Southern Florida (i.e. Palm Beach) the local odds ratios significantly exceed both 1 and the State-level ratio. Because this area is characterized by one of the lowest percentage of late-stage PCa (10–11%, Figure 2A) and the smallest proportion of cases with 1 to 2 comorbidities (1st decile, Figure 3E), even a small increase in the frequency of comorbidities could result in a relatively large increase in percentage of late-stage PCa. Conversely, the map of Figure 7A highlights an area around Gainesville (main campus of the University of Florida) where the local odds ratio for median income is both significantly lower than 1 and the State-level ratio. In other words, this is an area where the benefit of higher income on lowering the percentage of late-stage PCa is greater than what is observed over Florida in general. This could be linked to the higher accessibility of screening in the vicinity of a major University Hospital as indicated by the high provider (primary health provider and urologist) to case ratio found in (Goovaerts & Xiao, 2011) for Alachua County.
Marital status displays differences between local and State-level odds ratios that are rarely significant (Figure 7B). A covariate with significant differences between local and State-level odds ratios is year of diagnosis, in particular the beginning of the study period (2001 to 2003). Finding larger local odds ratios in the Florida Panhandle and Northern Florida (Figure 7D) is not surprising because these are areas where the percentage of late-stage PCa has been historically higher with a recent decline (Goovaerts, 2013) leading to greater differences with the reference year of 2007.
Diagnosis made at for-profit facilities globally is associated with lower percentages of PCa diagnosed at late-stages (State-level OR=0.886), yet in three areas highlighted in Figure 7C the local odds ratio is significantly higher than the State-level ratio. This type of information is useful to identify facilities that might not perform as well as what is observed on average over the State.
Conclusions
This study investigated the impacts of putative factors on percent of late-stage PCa in Florida during the period 2001–2007 both globally and in a spatial context. Study of the correlation between health data and risk factors is traditionally performed using global or aspatial regression, with the implicit assumption that the impact of covariates is constant across study area. The present study demonstrates that this assumption may not apply to large states such as Florida with substantial geographic variations in demographic, social, economic, and environmental conditions. Although most papers include a comparison of results of aspatial regression and GWR (Chen & Truong, 2012; Chi et al., 2013; Yang & Matthews, 2012), to our knowledge this is the first study where coefficients of the two regression models are formally compared using a 5-category classification scheme. Tailoring the test of hypothesis for local odds ratio to the value obtained at the State level allows discarding obvious results (e.g. having more than two comorbidities is significantly associated with higher percentage of late-stage PCa) to focus on areas where the increase or decrease is significantly higher or lower than expected on average over the State.
Globally, variables associated with higher percentage of late-stage PCa included having comorbidities, smoking, being Black and living in census tracts with farmhouses. Having private or public health insurance, being married or diagnosed in a for-profit facility, as well as living in a census-tract with high income are significantly associated with lower percentage of late-stage PCa. Locally, geographically-weighted regression identified multiple areas where local odds ratios were significantly different from the State-level ratio estimated using aspatial regression. For example, maps of local odds ratios for the comorbidity covariates allowed pinpointing specific areas where the local odds ratios were significantly smaller (Tallahassee, Pensacola) or larger (Palm Beach) than the state-level odds ratio. Another interesting result was the enhanced impact of census-tract median household income is associated with lower percentage of late-stage PCa in the vicinity of University of Florida hospital in Gainesville. However, as emphasized by other researchers (Cho et al., 2009), more theoretical work is needed on the impact of search strategy and weighting function on the results of geographically-weighted regression to improve its robustness.
The results of the study are promising for health policy-makers, in that the observed geographic variations in the impact of socioeconomic, behavioral, environmental and demographic factors stress the need for local strategies and cancer control interventions to further decrease the percentage of late-stage PCa and ultimately eliminate health disparities. In particular, the new approach whereby local odds ratios are compared to global ones should facilitate the selection of local areas for intervention. For example, efforts to reduce the number of comorbidities should start with the few zones where the local odds ratio is larger than the State-level odds ratio. To help operationalize delivery of localized interventions, the GWR method facilitates identification of distinct patterns that occur at a neighborhood level, within a single county, across multiple counties or in a contiguous region.
Highlights.
Comorbidities and smoking are associated with higher odds of late-stage diagnosis.
Diagnosis in for-profit facility is associated with lower late-stage percentages.
Significant differences can exist between local and State-level odds ratios.
Geographically-weighted regression facilitates identification of local patterns.
Spatial variability stresses the need for local cancer control interventions.
Acknowledgements
This research was funded by grants R43CA150496-01 and R44CA132347-02 from the National Cancer Institute, as well as grant #RSGT-10-082-01-CPHPS from the American Cancer Society. The views stated in this publication are those of the authors and do not necessarily represent the official views of the NCI and ACS.
Footnotes
Publisher's Disclaimer: This is a PDF file of an unedited manuscript that has been accepted for publication. As a service to our customers we are providing this early version of the manuscript. The manuscript will undergo copyediting, typesetting, and review of the resulting proof before it is published in its final citable form. Please note that during the production process errors may be discovered which could affect the content, and all legal disclaimers that apply to the journal pertain.
Contributor Information
Pierre Goovaerts, Email: goovaerts@biomedware.com.
Hong Xiao, Email: hxiao18@ufl.edu.
Georges Adunlin, Email: george.adunlin@gmail.com.
Askal Ali, Email: askalaali@gmail.com.
Fei Tan, Email: ftan@math.iupui.edu.
Clement K. Gwede, Email: clement.gwede@moffitt.org.
Youjie Huang, Email: YH2010FL@gmail.com.
References
- Alavanja MCR, Samanic C, Dosemeci M, Lubin J, Tarone R, Lynch CF, Barker J. Use of agricultural pesticides and prostate cancer risk in the agricultural health study cohort. American Journal of Epidemiology. 2003;157(9):800–814. doi: 10.1093/aje/kwg040. [DOI] [PubMed] [Google Scholar]
- American Cancer Society. Cancer Facts & Figures, 2013. Atlanta: American Cancer Society; 2013. [Google Scholar]
- American Cancer Society. Cancer Facts & Figures, 2014. Atlanta: American Cancer Society; 2014. [Google Scholar]
- Arcangeli CG, Smith DS, Ratliff TL, Catalona WJ. Stability of serum total and free prostate specific antigen under varying storage intervals and temperatures. The Journal of Urology. 1997;158(6):2182–2187. doi: 10.1016/s0022-5347(01)68191-6. [DOI] [PubMed] [Google Scholar]
- Bartsch C, Bartsch H, Schmidt A, Ilg S, Bichler KH, Fluchter SH. Melatonin and 6-sulfatoxymelatonin circadian rhythms in serum and urine of primary prostate cancer patients: Evidence for reduced pineal activity and relevance of urinary determinations. Clinica Chimica Acta; International Journal of Clinical Chemistry. 1992;209(3):153–167. doi: 10.1016/0009-8981(92)90164-l. [DOI] [PubMed] [Google Scholar]
- Caldas de Castro M, Singer BH. Controlling the false discovery rate: A new application to account for multiple and dependent tests in local statistics of spatial association. Geographical Analysis. 2006;38(2):180–208. [Google Scholar]
- Cardozo OD, García-Palomares JC, Gutiérrez J. Application of geographically weighted regression to the direct forecasting of transit ridership at station-level. Applied Geography. 2012;34:548–558. [Google Scholar]
- Chen D, Truong K. Using multilevel modeling and geographically weighted regression to identify spatial variations in the relationship between place-level disadvantages and obesity in Taiwan. Applied Geography. 2012;32(2):737–745. [Google Scholar]
- Chen VY, Wu P, Yang T, Su H. Examining non-stationary effects of social determinants on cardiovascular mortality after cold surges in Taiwan. Science of the Total Environment. 2010;408(9):2042–2049. doi: 10.1016/j.scitotenv.2009.11.044. [DOI] [PubMed] [Google Scholar]
- Chi S, Grigsby-Toussaint DS, Bradford N, Choi J. Can geographically weighted regression improve our contextual understanding of obesity in the US? findings from the USDA food atlas. Applied Geography. 2013;44:134–142. [Google Scholar]
- Cho S, Lambert DM, Kim SG, Jung S. Extreme coefficients in geographically weighted regression and their effects on mapping. GIScience & Remote Sensing. 2009;46(3):273–288. [Google Scholar]
- Elixhauser A, Steiner C, Harris DR, Coffey RM. Comorbidity measures for use with administrative data. Medical Care. 1998;36(1):8–27. doi: 10.1097/00005650-199801000-00004. [DOI] [PubMed] [Google Scholar]
- Florida Department of Health. Florida cancer registry. 2014 Retrieved from http://www.floridahealth.gov/diseases-and-conditions/cancer/cancer-registry/index.html.
- Fotheringham AS, Brunsdon C, Charlton M. Geographically weighted regression: The analysis of spatially varying relationships. John Wiley & Sons; 2003. [Google Scholar]
- Goovaerts P. Analysis and detection of health disparities using geostatistics and a space-time information system. Analysis. 2005;1:9–10. [Google Scholar]
- Goovaerts P. Analysis of geographical disparities in temporal trends of health outcomes using space–time joinpoint regression. International Journal of Applied Earth Observation and Geoinformation. 2013;22:75–85. doi: 10.1016/j.jag.2012.03.002. [DOI] [PMC free article] [PubMed] [Google Scholar]
- Goovaerts P, Xiao H. Geographical, temporal and racial disparities in late-stage prostate cancer incidence across florida: A multiscale joinpoint regression analysis. International Journal of Health Geographics. 2011;10:63-072X-10-63. doi: 10.1186/1476-072X-10-63. [DOI] [PMC free article] [PubMed] [Google Scholar]
- Jacquez GM, Goovaerts P, Kaufmann A, Rommel R. SpaceStat 4.0 user manual: Software for the space-time analysis of dynamic complex systems. 2014 [Google Scholar]
- Mandelblatt JS, Yabroff KR, Kerner JF. Equitable access to cancer services. Cancer. 1999;86(11):2378–2390. [PubMed] [Google Scholar]
- Mennis J. Mapping the results of geographically weighted regression. The Cartographic Journal. 2006;43(2):171–179. [Google Scholar]
- Meyer TE, Coker AL, Sanderson M, Symanski E. A case–control study of farming and prostate cancer in African-American and Caucasian men. Occupational and Environmental Medicine. 2007;64(3):155. doi: 10.1136/oem.2006.027383. [DOI] [PMC free article] [PubMed] [Google Scholar]
- Mullins CD, Blatt L, Gbarayor CM, Yang HWK, Baquet C. Health disparities: A barrier to high-quality care. American Journal of Health-System Pharmacy. 2005;62(18):1873. doi: 10.2146/ajhp050064. [DOI] [PMC free article] [PubMed] [Google Scholar]
- Nakaya T, Fotheringham A, Brunsdon C, Charlton M. Geographically weighted poisson regression for disease association mapping. Statistics in Medicine. 2005;24(17):2695–2717. doi: 10.1002/sim.2129. [DOI] [PubMed] [Google Scholar]
- Rodrigues M, de la Riva J, Fotheringham S. Modeling the spatial variation of the explanatory factors of human-caused wildfires in Spain using geographically weighted logistic regression. Applied Geography. 2014;48:52–63. [Google Scholar]
- Roetzheim RG, Pal N, Tennant C, Voti L, Ayanian JZ, Schwabe A, Krischer JP. Effects of health insurance and race on early detection of cancer. Journal of the National Cancer Institute. 1999;91(16):1409–1415. doi: 10.1093/jnci/91.16.1409. [DOI] [PubMed] [Google Scholar]
- Settimi L, Masina A, Andrion A, Axelson O. Prostate cancer and exposure to pesticides in agricultural settings. International Journal of Cancer. 2003;104(4):458–461. doi: 10.1002/ijc.10955. [DOI] [PubMed] [Google Scholar]
- Shoff C, Chen V, Yang T. When homogeneity meets heterogeneity: The geographically weighted regression with spatial lag approach to prenatal care utilization. Geospatial Health. 2014;8(2):557–568. doi: 10.4081/gh.2014.45. [DOI] [PMC free article] [PubMed] [Google Scholar]
- Siu SW, Lau KW, Tam PC, Shiu SY. Melatonin and prostate cancer cell proliferation: Interplay with castration, epidermal growth factor, and androgen sensitivity. The Prostate. 2002;52(2):106–122. doi: 10.1002/pros.10098. [DOI] [PubMed] [Google Scholar]
- Su S, Xiao R, Zhang Y. Multi-scale analysis of spatially varying relationships between agricultural landscape patterns and urbanization using geographically weighted regression. Applied Geography. 2012;32(2):360–375. [Google Scholar]
- Talcott JA, Spain P, Clark JA, Carpenter WR, Do YK, Hamilton RJ, Godley PA. Hidden barriers between knowledge and behavior. Cancer. 2007;109(8):1599–1606. doi: 10.1002/cncr.22583. [DOI] [PubMed] [Google Scholar]
- Wang K, Zhang C, Li W. Predictive mapping of soil total nitrogen at a regional scale: A comparison between geographically weighted regression and cokriging. Applied Geography. 2013;42:73–85. [Google Scholar]
- Wheeler D, Tiefelsdorf M. Multicollinearity and correlation among local regression coefficients in geographically weighted regression. Journal of Geographical Systems. 2005;7(2):161–187. [Google Scholar]
- Xiao H, Tan F, Goovaerts P, Ali A, Adunlin G, Huang Y, Gwede C. Construction of a comorbidity index for prostate cancer patients linking state cancer registry with inpatient and outpatient data. Journal of Registry Management. 2013;40(4):159–164. [PMC free article] [PubMed] [Google Scholar]
- Yang T, Matthews SA. Understanding the non-stationary associations between distrust of the health care system, health conditions, and self-rated health in the elderly: A geographically weighted regression approach. Health & Place. 2012;18(3):576–585. doi: 10.1016/j.healthplace.2012.01.007. [DOI] [PMC free article] [PubMed] [Google Scholar]


