Abstract
The availability of confocal endomicroscopy motivates the development of optical contrast agents that can delineate the morphologic and metabolic features of gastrointestinal neoplasia. This study evaluates 2-NBDG, a fluorescent deoxyglucose, the uptake of which is associated with increased metabolic activity, in the identification of Barrett’s-associated neoplasia. Surveillance biopsies from patients with varying pathologic grades of Barrett’s esophagus were incubated ex vivo at 37°C with 2-NBDG and imaged with a fluorescence confocal microscope. Images were categorized as neoplastic (high grade dysplasia, esophageal adenocarcinoma) or metaplastic (intestinal metaplasia, low grade dysplasia) based on the degree of glandular 2-NBDG uptake. Classification accuracy was assessed using histopathology as the gold standard. Forty-four biopsies were obtained from twenty-six patients; 206 sites were imaged. The glandular mean fluorescence intensity of neoplastic sites was significantly higher than that of metaplastic sites (p < 0.001). Chronic inflammation was associated with increased 2-NBDG uptake in the lamina propria but not in glandular epithelium. Sites could be classified as neoplastic or not with 96% sensitivity and 90% specificity based on glandular mean fluorescence intensity. Classification accuracy was not affected by the presence of inflammation. By delineating the metabolic and morphologic features of neoplasia, 2-NBDG shows promise as a topical contrast agent for confocal imaging. Further in vivo testing is needed to determine its performance in identifying neoplasia during confocal endomicroscopic imaging.
Keywords: Barrett’s esophagus, Confocal imaging, Optical contrast agents, Fluorescent deoxyglucose, Esophageal adenocarcinoma
Introduction
The incidence of esophageal adenocarcinoma (EAC) is rapidly rising in the United States, with an estimated 300-400% increase over the past 3 decades (1, 2). This increased incidence is particularly worrisome, given that the overall five-year-survival rate for patients diagnosed with EAC is a dismal 12% (3), an outcome resulting from detection of late-stage disease. Indeed, more than 60% of patients with EAC are diagnosed with local, regional, and distant metastases (4). Detecting and treating esophageal neoplasia at an early stage has been reported to increase five-year survival to rates as high as 81% (5); however, current surveillance methods have considerable limitations.
EAC arises primarily in patients with Barrett’s esophagus (BE) (6, 7), a highly prevalent condition caused by chronic esophageal reflux (8). In patients with BE, the squamous epithelium of the esophagus near the gastroesophageal junction is replaced by specialized columnar epithelium (9-11) known as intestinal metaplasia (IM). BE/IM is of clinical importance because it is a risk factor for EAC. Because of this increased risk, patients with BE undergo regular surveillance at designated intervals according to level of dysplasia in an attempt to identify neoplastic lesions at an early, treatable stage (12, 13). The current standard of endoscopic surveillance involves random four-quadrant biopsies taken every 1-2 cm along the BE segment (13). However, dysplasia within BE is often unidentifiable under standard white light endoscopy and as many as 43-57% of early cancers can go undetected by this method (14). Thus, there is a pressing need to improve the clinician’s ability to visualize neoplastic lesions during endoscopy. Improving the ability to discriminate high grade dysplasia (HGD) and early EAC from IM and low grade dysplasia (LGD) could significantly impact clinical decision-making. The diagnosis of either HGD or EAC prompts endoscopic based therapy or surgical resection (15-17), while diagnosis of either IM or LGD warrants continued surveillance (13).
Various optical imaging techniques are being explored to improve current surveillance strategies (18-20). Widefield endoscopic optical imaging techniques, such as autofluorescence (21) and narrowband imaging (22), have shown high sensitivity but suboptimal specificity, largely due to the confounding effect of inflammation. Moreover, the lack of spatial resolution prevents cellular-level interrogation of suspicious areas, motivating the need for high resolution imaging technologies, which may aid in reducing false positives.
Confocal endomicroscopy is thought to achieve the highest sensitivity and specificity of any high-resolution modality to date (18, 23). This technology is most commonly coupled with intravenously-administered fluorescein. Unfortunately, fluorescein is a non-specific contrast agent with diffuse uptake in both normal as well as neoplastic mucosa. While it permits the visualization of subcellular epithelial changes and the subepithelial vasculature, it does not specifically target neoplastic epithelium. Moreover, the number of cases needed to train endoscopists to interpret these images and characterize the morphologic features of neoplasia interpretation is high (24). The increased availability and utilization of confocal endomicroscopy necessitates the need for novel, safe, easily-applied contrast agents that can be used to increase the diagnostic accuracy of endoscopic surveillance.
Several molecular-specific, optically-active contrast agents have been developed to enhance the optical detection of neoplasia in a variety of organ sites using confocal microendoscopy (25, 26). Topical application of a fluorescently labeled deoxyglucose, 2-NBDG (2-[N-(7-nitrobenz-2-oxa-1,3-diazol-4-yl)amino]-2-deoxy-D-glucose), was recently shown to improve visualization of early oral neoplasia. The application of 2-NBDG was shown to increase fluorescence contrast in specimens with neoplasia, relative to that available with auto-fluorescence (27). The staining method was based on experiments by O'Neil and colleagues in cancer cell lines (28). The increase in 2-NBDG uptake is associated with increased rates of glucose metabolism in cancer cells relative to normal cells (28), thought to be due to over-expression of glucose transporters (GLUTs) and increased activity of hexokinase enzymes (29). The deoxyglucose is actively transported into the cell by the GLUTs and is phosphorylated by the hexokinase enzyme (30). The phosphorylated deoxyglucose molecule is then selectively entrapped within the cell cytoplasm, resulting in increased contrast during fluorescence imaging (31, 32), with peak excitation at 475 nm and peak emission at 550 nm. When coupled with the appropriate imaging technology, 2-NBDG can be a useful marker for detecting areas with increased levels of cellular metabolism associated with the over-expression of GLUTs.
An increase in expression of GLUTs has been reported in many epithelial cancers, including EAC (33, 34). GLUTs are currently targeted in cancer imaging using a radioactively-labeled glucose analog (18FDG) during positron emission tomography (PET) (35). PET is routinely used to stage potentially operable patients with EAC (36). However, there are obstacles to using PET for routine surveillance, including a high number of false positives associated with inflammation (37–39), patient exposure to radiation, and a relatively poor spatial resolution. Indeed, PET is used to evaluate increased uptake over a large field of view and cannot delineate neoplasia occurring at microscopic level. Optical molecular imaging using a fluorescently labeled deoxyglucose, a contrast agent with similar mechanism of uptake as 18FDG (40), has the potential to address these limitations when used as an adjunct to endoscopic surveillance with confocal endomicroscopy. When coupled with confocal imaging, 2-NBDG could potentially permit the simultaneous characterization of the morphologic and metabolic features of neoplasia.
The goal of this study was to carry out a pre-clinical pilot study to evaluate the feasibility of topical 2-NBDG as a contrast agent for the evaluation of Barrett’s-associated neoplasia. Fluorescently labeled deoxyglucose (2-NBDG) was topically applied ex vivo to fresh esophageal biopsy specimens. Samples were imaged using confocal fluorescence microscopy, and resulting fluorescence images were evaluated to assess the contrast between metaplastic (IM/LGD) and neoplastic (HGD/EAC) mucosa. Results of this pre-clinical study provide preliminary data to guide future translation to in vivo confocal endoscopic imaging in patients with BE.
Materials and Methods
Patient Enrollment and Data Collection
Patients who participated in this study had been previously diagnosed with BE, BE with dysplasia, or BE with EAC and were scheduled for endoscopic examination. This study was reviewed and approved by the Institutional Review Boards at Rice University, the University of Texas M.D. Anderson Cancer Center, and the Mount Sinai Medical Center. All patients gave written informed consent to participate in the study.
For each patient, up to 4 research biopsies were obtained from the gastroesophageal junction, 1 biopsy for every 1-2 cm of BE segment. The endoscopist noted whether the esophageal mucosa was intact or ulcerated at the site of each biopsy. Biopsies were excluded if they were too small to process for imaging, were too small for histologic processing, or if the epithelial layer was not present for assessment after histologic staining.
Immediately following forceps removal, biopsies were incubated in 100 μL of a 210 μM solution of 2-NBDG (Invitrogen, Carlsbad, CA, USA) in isotonic PBS for 40 minutes at 37°C. Following incubation, specimens were washed in isotonic PBS on a shaker three times at 4°C for 10 minutes each to remove any excess 2-NBDG. PBS was replaced after each washing step. The tissue was then placed between two cover slips and imaged en face on a confocal microscope (LSM Meta 510, Zeiss, Inc., Germany). Fluorescence images were obtained at 488 nm laser excitation, with a 488 nm dichroic and a bandpass emission filter (520-580 nm) with a 20X objective. Images were acquired at different sites across the entire epithelial surface of each biopsy, resulting in 2-10 images acquired from different sites within each biopsy. At each site, the focal plane was located between 16 and 23 microns below the surface of the biopsy specimen. Differential interference contrast (DIC) images were obtained from the same 500 X 500 pm field of view as the confocal fluorescence images to provide a guide to tissue morphology. All the fluorescence images used for analysis were taken at the same laser power and gain settings. The use of a benchtop confocal system allows the ability to control these settings, necessary during this initial pre-clinical evaluation of 2-NBDG in BE.
Following confocal imaging, biopsy specimens were fixed in formalin and submitted for standard histologic evaluation; the diagnosis of the research biopsy was considered the gold standard in this study. Pathology slides were reviewed by a single GI pathologist with expertise in BE and EAC. The pathologist who reviewed the biopsy was blinded from the interpretation of confocal images. Pathologic diagnosis of IM, LGD, HGD and/or EAC was determined using previously defined standard criteria (13), which included loss of goblet cells, increased cellular atypia and glandular irregularity during neoplastic progression, among others. The presence of chronic and/or acute inflammation was based on the presence of lymphocytes/plasma cells in the lamina propria or neutrophils within the glandular epithelium, respectively (41). When present, the degree of chronic inflammation was graded (mild, moderate, marked).
Qualitative Image Evaluation:
All confocal fluorescence images were analyzed visually by two investigators (N.T. and D.M.) to identify key morphologic and architectural features visualized by fluorescence contrast associated with 2-NBDG uptake, which correspond to features present in H&E-stained histology. These include architectural features such as complexity of glandular architecture, glandular density, and glandular arrangement, as well as cytologic features such as the presence/absence of goblet cells, nuclear crowding, and nuclear enlargement.
Initial review of images indicated distinct 2-NBDG staining patterns for EAC samples depending on whether or not the tumor appeared ulcerated at the time of endoscopy. Therefore, images from samples diagnosed as HGD/EAC were divided into two sub-groups based on endoscopic tumor appearance (intact mucosa, ulcerated surface). Images categorized as ulcerated EAC were excluded from further quantitative analysis, due to the clinicians' ability to easily visualize these lesions during endoscopy.
Quantitative Image Evaluation:
Due to the low-risk of progression associated with LGD, and the known high interobserver variability in histologic diagnosis of LGD (13), for quantitative evaluation both IM and LGD were grouped as metaplasia, and both HGD and EAC were grouped as neoplasia. This classification is consistent with the current confocal endoscopic grading system and is the most relevant to clinical utility for disease management (18).
GLUT over-expression and activity are known to be significantly elevated in HGD/EAC (33), therefore specimens diagnosed as such may exhibit increased uptake of 2-NBDG relative to IM/LGD. To determine whether the intensity of 2-NBDG fluorescence correlated with histopathologic diagnosis, two quantitative image features were calculated. First, the mean glandular intensity (MGI), which included fluorescence only from glands, was calculated for each site imaged. Glands were segmented by a single observer, blinded to histopathologic diagnosis. Second, the mean fluorescence intensity (MFI) of the entire field of view, including fluorescence from both glands and the lamina propria, was calculated for each site imaged. The average MGI and MFI were calculated for all sites with the same histopathologic diagnosis and compared. One-way unbalanced ANOVA was performed to determine whether differences in the mean value of calculated features between each pathologic category were significant.
Diagnostic Algorithm:
Linear discriminant analysis was used to develop an algorithm to classify samples as neoplastic (HGD/EAC) or non-neoplastic (IM/LGD) based on each of the two quantitative image features using histologic diagnosis as the gold standard. Due to the exploratory nature of this study, the same data set was used to train the algorithm and test its performance. For each input feature, a receiver operator characteristic (ROC) curve was constructed and the associated area under the curve (AUC) was calculated. Performance of the algorithm was assessed on a per-site basis; in addition, quantitative features from each site within a biopsy were averaged together in order to assess algorithm performance on a per-biopsy basis.
Results
A total of 206 sites were imaged from 44 biopsies, as described in Table I; 34 biopsies were obtained from UT MD Anderson Cancer Center and 10 biopsies were obtained from Mount Sinai Medical Center.
Table I.
Patient Data Summary.
| Pathologic Diagnosis | Individual Biopsies | Sites Imaged |
|---|---|---|
| IM/LGD | 28 (in 14 patients) | 113 |
| HGD/EAC with no ulceration | 10 (in 7 patients) | 55 |
| EAC with ulceration | 6 (in 5 patients) | 38 |
Qualitative Image Evaluation:
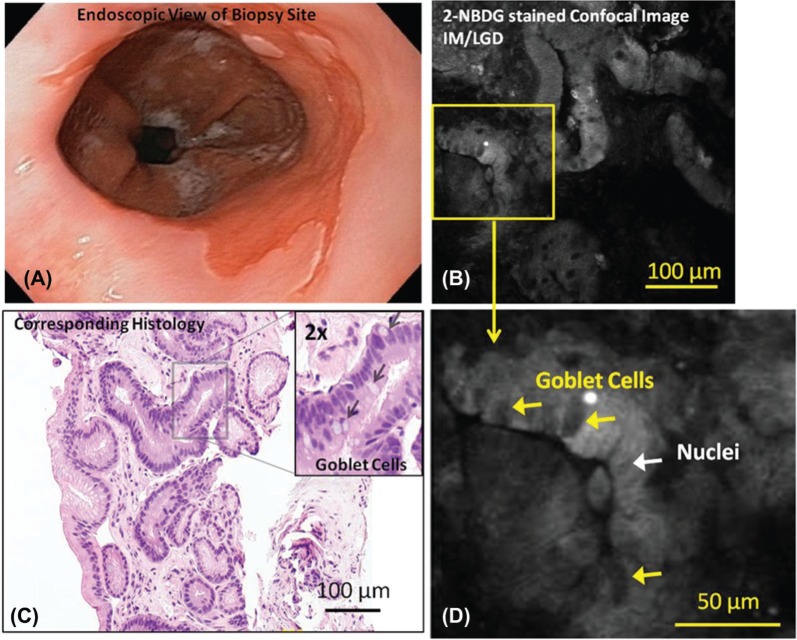
Figures 1–3 show representative endoscopic images, 2-NBDG stained confocal fluorescence images, and corresponding H&E histology from specimens with intact and ulcerated surfaces. Figure 1A shows a representative endoscopic image of BE with intact mucosa (non-ulcerated). Figure 1B shows a representative confocal fluorescence image of a biopsy from that area incubated with 2-NBDG. While uptake of the contrast agent is minimal, glands are still visible due to uptake of the contrast agent in epithelial cell cytoplasm. Goblet cells and nuclei appear to take up less 2-NBDG in comparison, making them appear dark. These features are indicated in the magnified confocal image (Figure 1D). The diagnosis of IM was verified by histopathology from the same biopsy (Figure 1C).
Figure 1:
Representative endoscopic image (A), confocal fluorescence images (B, D) and histologic images (C) of samples diagnosed as IM/LGD are shown. Relevant features such as goblet cells and nuclei are indicated.
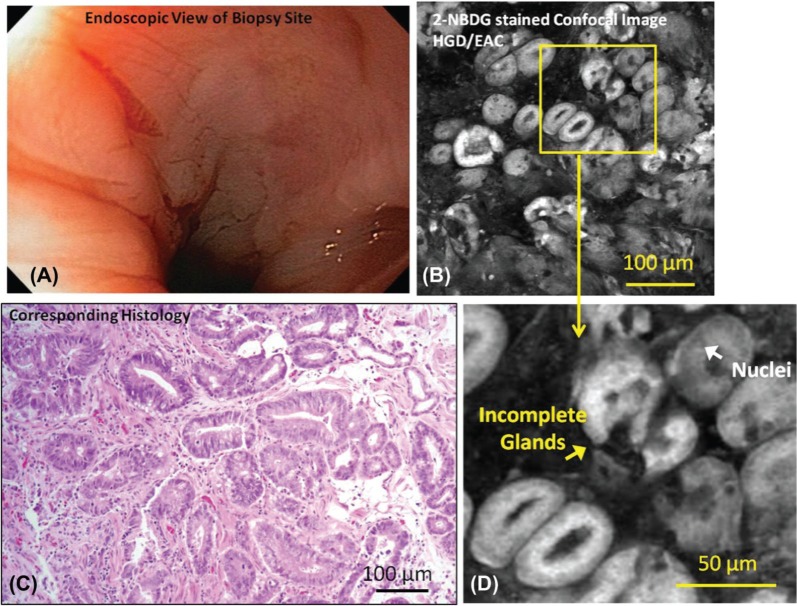
Figure 2:
Representative endoscopic image (A), confocal fluorescence images (B, D) and histologic images (C) of samples diagnosed as HGD with intact mucosal surface are shown. Relevant features such nuclei and incomplete glands are indicated. There is no apparent lesion or ulceration indicating neoplasia in endoscopy image; however, biopsy-confirmed neoplasia is present and neoplastic features are visible in the confocal image.
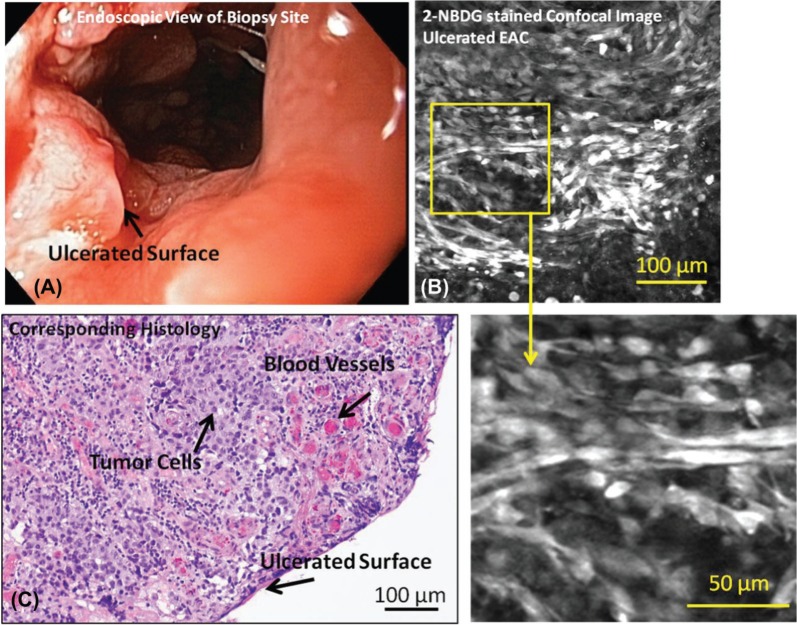
Figure 3:
Representative endoscopic image (A), confocal fluorescence images (B, D) and histologic images (C) of samples diagnosed as EAC with ulcerated mucosal surface are shown. Relevant features such as tumor cells, blood vessels, and the ulcerated surface are indicated. Apparent tumor and ulcerated surface visible during surveillance endoscopy is verified with biopsy-confirmed invasive cancer with surface ulceration.
Figure 2A shows an endoscopic image of mucosa diagnosed as HGD with intact mucosa (non-ulcerated). Figure 2B shows a confocal fluorescence image of a biopsy from that area incubated with 2-NBDG; uptake of the contrast agent is higher than in the specimen diagnosed as IM (shown in previous Figure 1B), resulting in increased glandular fluorescence intensity. Irregularly shaped glands and an increased density of glands are visible in the confocal fluorescence image, with strong uptake of 2-NBDG making the glandular patterns clear. Incomplete glands and nuclei are indicated in the magnified confocal image (Figure 2D). Visible cytologic changes include a decrease in goblet cell density and enlargement of nuclei. The diagnosis of HGD was verified by histology (Figure 2C).
Figure 3A shows an endoscopic image of ulcerated mucosa diagnosed as carcinoma. Figure 3B shows a confocal fluorescence image of a biopsy from that area incubated with 2-NBDG. Cells appear to take up the contrast agent, resulting in high fluorescence intensity; however, due to the lack of recognizable glandular structure, it is difficult to differentiate tumor cells from stromal invasion. The lack of glandular structure and the diagnosis of ulcerated EAC were verified on the corresponding histology section (Figure 3C).
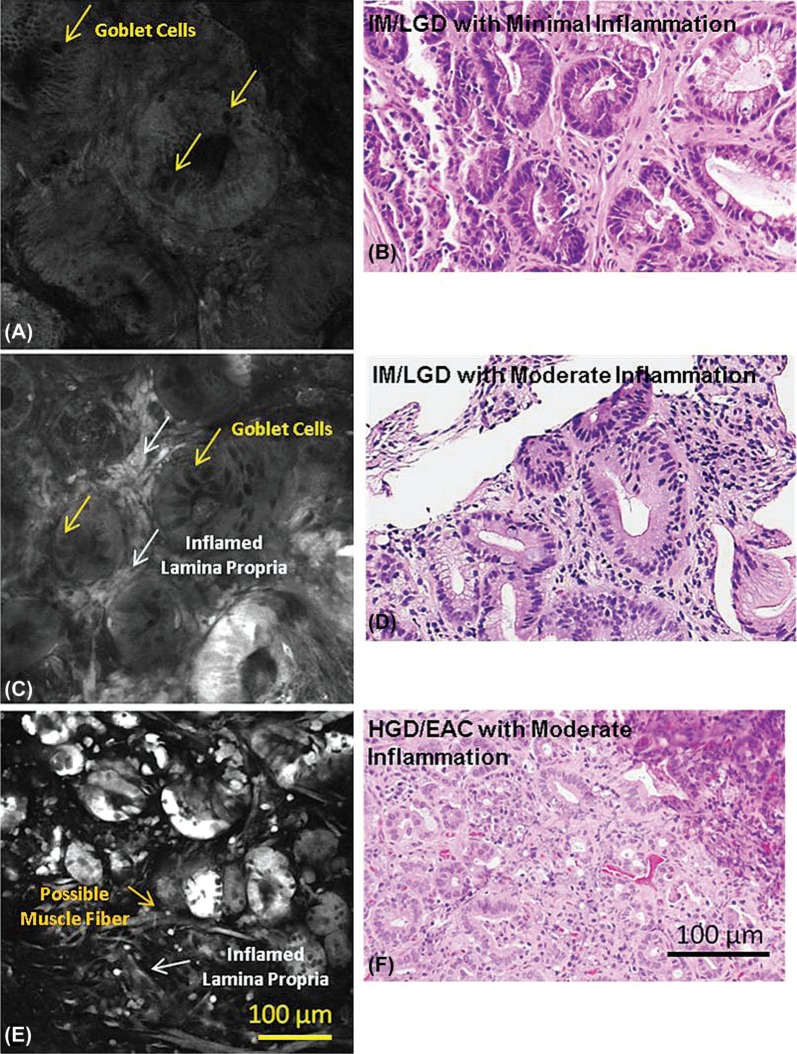
Figure 4A, C, and E, show representative images of 2-NBDG stained tissue from IM/LGD with zero to mild levels of inflammation, IM/LGD with moderate to marked inflammation, and HGD/EAC with moderate to marked inflammation. All specimens were obtained from areas with endoscopicallyintact mucosal surfaces. Corresponding histology is also shown (Figure 4B, D, and F). While fluorescence intensity associated with 2-NBDG uptake is minimal in the sample diagnosed with IM/LGD with zero to mild levels inflammation (Figure 4A), the 2-NBDG uptake within the gland enhances the visibility of mucin within goblet cells, making them appear dark in contrast. Representative goblet cells are indicated by the arrows. Dark nuclei are made apparent by the uptake of the agent in the surrounding cytoplasm and are identified by their smaller size and position within the gland; they are not as dark as goblet cells.
Figure 4:
Representative confocal fluorescence images of samples diagnosed as (A) IM/LGD with zero to mild levels of chronic inflammation, (B) IM/LGD with moderate to marked levels of chronic inflammation, (C) HGD/EAC with moderate to marked levels of chronic inflammation, and corresponding histopathology (D-F). The presence of moderate-marked inflammation is associated with increased fluorescence in the lamina propria, while the presence of neoplasia is associated with increased glandular fluorescence.
Figure 4C shows a representative confocal image of IM/LGD with moderate to marked inflammation. The pattern of glandular uptake is similar to that of IM/LGD with mild inflammation; the image shows characteristic crypts with dark goblet cells associated with IM/LGD. However, the presence of inflammatory cells in the lamina propria is associated with increased 2-NBDG and increased fluorescence intensity, characterized by the bright areas between the glands.
Figure 4E shows a representative confocal fluorescence image of HGD/EAC with moderate to marked inflammation. Glandular uptake of 2-NBDG is significantly higher than is found with IM/LGD, resulting in increasingly bright glands. The particularly high intensity associated with these glands allows visualization of glandular irregularity and disruption - hallmarks of HGD and early EAC. Glands are crowded, irregular, and fragmented and goblet cells are not visible. Uptake of 2-NBDG is visible in areas of lamina propria, making visible a few scattered fibers, most likely representing disrupted muscularis mucosa. Among the patients diagnosed as HGD/EAC with intact mucosa, the majority were graded as having moderate to marked levels of chronic inflammation (53/55); thus, the impact of lower levels of inflammation on 2-NBDG uptake could not be evaluated.
Quantitative Image Evaluation:
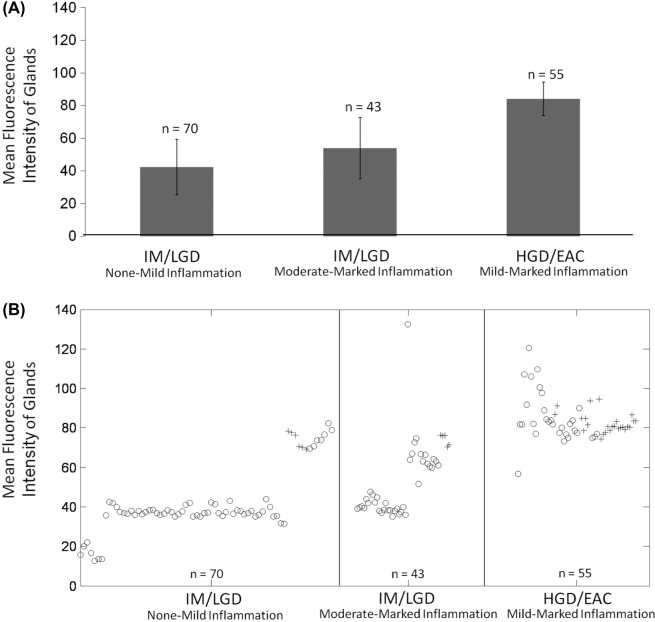
Figure 5 demonstrates gland selection for MGI calculation. Figure 6A shows the mean and standard deviation of the MGI of each site as a function of histologic diagnosis and grade of inflammation. On average, the MGI is lowest for sites with IM/LGD with zero to mild levels of inflammation (42.3 ± 17.0), and is highest for sites with HGD/EAC (84.0 ± 10.2). Figure 6B shows a corresponding scatter-plot of the MGI for each site; the MGI of the majority of the sites diagnosed as HGD/EAC are greater than for a majority of the sites diagnosed as IM/LGD, irrespective of the presence or degree of inflammation. Differences in the overall MGI of biopsies histologically categorized as IM/LGD and HGD/EAC were found to be significantly different (p < 0.001). The ability of high resolution imaging to separate glandular changes from changes in the lamina propria is particularly useful.
Figure 5:
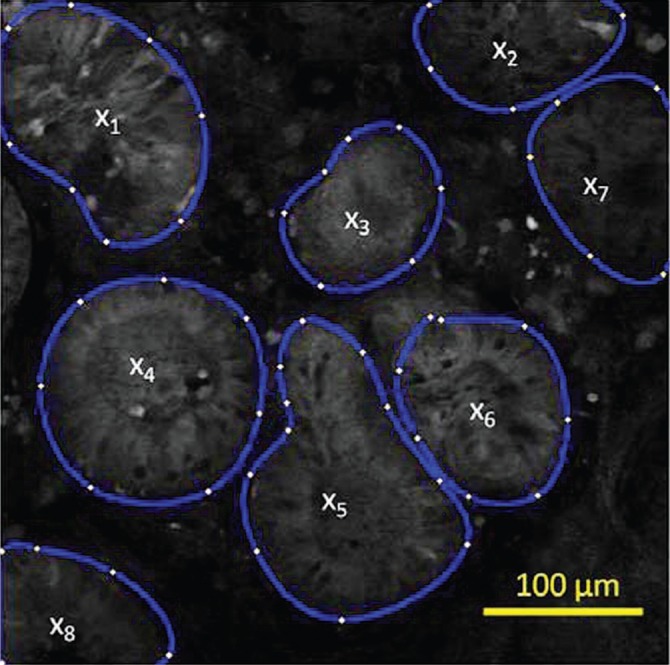
Demonstration of gland selection for mean glandular intensity (MGI) calculation on a confocal image of Barrett’s metaplasia stained with 2-NBDG. MGI is the average of x, where x is the average intensity of each gland.
Figure 6:
(A) Plot showing mean glandular fluorescence intensity ± one standard deviation, separated according to histologic diagnosis and presence/grade of inflammation: IM/LGD with zero-mild chronic inflammation; IM/LGD with moderated-marked chronic inflammation; and HGD/EAC with zero-marked chronic inflammation. (B) Scatter-plot showing mean glandular fluorescence intensity for each site according to histologic diagnosis and presence/grade of inflammation. Samples with acute inflammation present are indicated by “+” symbols; samples with no acute inflammation present are indicated by “o” symbols. n = the number of images evaluated per category.
The mean and standard deviation of the MFI feature, which includes both glands and lamina propria, was 29.3 ± 9.3 for IM/LGD with zero to mild levels of inflammation, 67.0 ± 35.7 for IM/LGD with moderate to marked levels of inflammation, and 53.0 ± 13.9 for HGD/EAC with mild to marked levels of inflammation. Due to the inflamed lamina propria, there is considerable overlap in the distribution of the MFI for sites diagnoses as IM/LGD with moderate to marked inflammation and sites diagnosed as HGD/EAC. Differences in the overall MFI of biopsies histologically categorized as IM/LGD and HGD/EAC were not found to be significantly different.
Diagnostic algorithms were developed to classify samples as neoplastic or metaplastic based on each of these two quantitative features; algorithms based on the MGI gave best performance relative to the gold standard of histopathology. Figure 7 shows the resulting ROC curves for this feature, with accuracy calculated on a per-site or per-biopsy basis. At the Q-point, the algorithm based on MGI has a sensitivity of 96% and a specificity of 90% calculated per site (AUC = 0.97), and a sensitivity of 100% and a specificity of 93% calculated per biopsy (AUC = 0.96).
Figure 7:
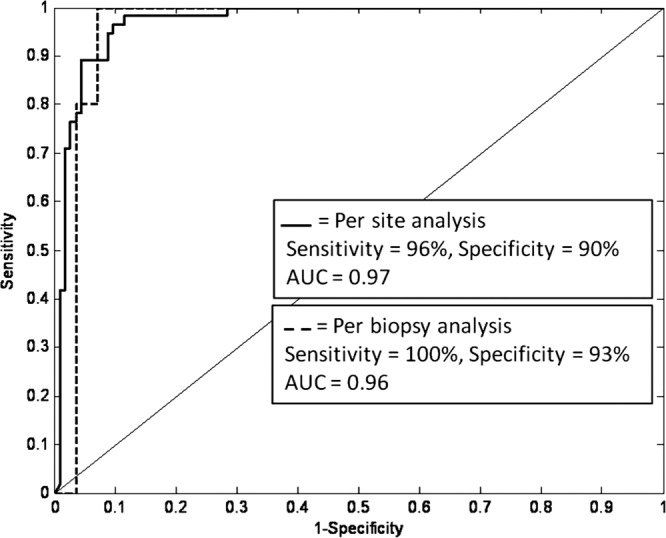
ROC curve for algorithm discriminating samples with HGD/EAC from samples with IM/LGD based on mean glandular fluorescence intensity. Results are shown for a per-site and a per-biopsy analysis using histology as the gold standard.
Discussion
This prospective, pre-clinical study evaluates the potential of fluorescent deoxyglucose as a topical contrast agent for adjuvant confocal microscopic examination of Barrett’s esophagus. Our results suggest that topical 2-NBDG provides quantifiable image features that can be used to discriminate neoplastic sites from metaplastic sites with high sensitivity and specificity. By combining high-resolution morphologic information provided by confocal microscopy with the metabolic information provided by 2-NBDG, this imaging method offers the ability to visualize and quantify key pathologic features to differentiate neoplasia. While glandular staining can be heterogeneous, likely due to pathologic heterogeneity known to be present in individual biopsy fragments (42), the effect appears to mitigated when the mean glandular intensity is used as a classifying feature. Indeed, the ability to delineate glandular uptake of 2-NBDG from the surrounding lamina propria provides the critical advantage of differentiating neoplasia from inflammation, a significant confounder with other imaging technologies.
Emerging targeted, optically labeled contrast agents such as antibodies, peptides, or aptamers can be advantageous over commonly used non-targeted agents, such as fluorescein, due to the specificity towards known markers of neoplasia. However, due to the size of the targeted agents (kDa range), it may be difficult to achieve relevant penetration depth using topical delivery. An advantage of 2-NBDG is its low molecular weight (330 Da); thus it may have the potential to penetrate deeper through tissue (43). This is especially useful since confocal imaging has the ability to image sub-surface cell layers. Moreover, due to its small size, 2-NBDG has the potential to overcome difficulties associated with tissue clearance; agent not taken up by the cells can be removed through simple washing steps.
Like 18FDG PET, 2-NBDG imaging provides a tool to assess tissue metabolic activity (40). Despite its benefits, 18FDG PET is typically only used for disease staging and monitoring (44). Moreover, false positives associated with inflammation are common (37). While duplicating many of the benefits of 18FDG PET, the use of 2-NBDG during optical imaging offers additional advantages. The spatial resolution of optical imaging is limited by diffraction and can thus be used to visualize the location of 2-NBDG uptake. This can aid in determining whether the signal comes from inflammatory cells in the lamina propria or neoplastic cells of the glands. These advantages support the broader use of metabolic monitoring during endoscopic surveillance. Finally, due to the long history of safe use of intravenous 18FDG (45, 46) and the limited amounts (3-5 ml) of 2-NBDG required for topical application in the esophagus, the use of this contrast agent should be readily translatable to clinical application.
This ex vivo study highlights the potential benefits of using 2-NBDG to image and quantify signal contrast associated with neoplasia and serves as an important step towards eventual clinical translation. However, further clinical studies are necessary to determine whether similar conclusions can be drawn during in vivo imaging. In this study, tissue samples were incubated with 2-NBDG post excision to allow the uptake of the agent. An in vivo study will be necessary to determine whether topical application will require an incubation time similar to that used in the ex vivo study. If so, an optimal medium for application, such as a paste or a gel, will need to be explored. Furthermore, larger sample sizes are necessary to assess clinical utility. In such a study, the effects of acute inflammation on the glandular mean intensity could be further evaluated and the differences between LGD and HGD could be explored in more detail. Despite these limitations, this study demonstrates the potential benefits of optically monitoring metabolic activity to identify neoplasia.
Results of this ex vivo pre-clinical study provide preliminary data to guide future translation to in vivo confocal endoscopic surveillance in patients with BE. Advances in widefield imaging have given endoscopists the ability to detect areas suspicious of neoplasia with high sensitivity but limited specificity. Topically applied 2-NBDG coupled with appropriate high resolution imaging techniques could be used to further optically sample those areas and rule out false positives based on relevant cellular and biochemical changes associated with neoplastic progression. Objective visualization of relevant biochemical changes provides clinicians with an added dimension of information, thus appropriate decisions regarding diagnosis and treatment can be made. Since these features are quantifiable, there exists the potential to develop computer-aided analysis software for real-time endoscopic interpretation. This information may increase sampling efficiency, enhance the detection of neoplasia and improve margin determination during surveillance.
Acknowledgements
The authors acknowledge Rachna Muldoon for her invaluable assistance during this study, and appreciate help Drs. Timothy Muldoon and Anne van De Ven regarding training and data collection. The authors appreciate the support from the National Cancer Institute through Bioengineering Research Partnership RO1CA103830.
Abbreviations
- BE
Barrett’s Esophagus
- EAC
Esophageal Adenocarcinoma
- IM
Intestinal Metaplasia
- LGD
Low Grade Dysplasia
- HGD
High Grade Dysplasia
- 2-NBDG
2-[N-(7-nitrobenz-2-oxa-1, 3-diazol-4-yl)amino]-2-deoxy-D-glucose
- 18FDG
2-deoxy-2-(18F)fluoro-D-glucose
- PET
Positron Emission Tomography
- IV
Intravenous
- MFI
Mean Fluorescence Intensity
- MGI
Mean Glandular Intensity
- LDA
Linear Discriminant Analysis
- ROC
Receiver Operator Characteristic
- AUC
Area Under the Curve
Footnotes
Conflict of Interest: The authors certify that regarding this paper, there are no relevant conflicts of interest or financial ties to disclose.
References
- 1.Cameron A. J. Epidemiology of Barrett’s esophagus and adenocarcinoma. Dis Esophagus 15, 106–108 (2002). [DOI] [PubMed] [Google Scholar]
- 2.DeVault K. R. Epidemiology and significance of Barrett’s esophagus. Dig Dis 18, 195–202 (2000). [DOI] [PubMed] [Google Scholar]
- 3.Sihvo E. I., Luostarinen M. E., Salo J. A. Fate of patients with adenocarcinoma of the esophagus and the esophagogastric junction: a population-based analysis. Am J Gastroenterol 99, 419–424 (2004). [DOI] [PubMed] [Google Scholar]
- 4.Farrow D. C., Vaughan T. L. Determinants of survival following the diagnosis of esophageal adenocarcinoma (United States). Cancer Causes Control 7, 322–327 (1996). [DOI] [PubMed] [Google Scholar]
- 5.Portale G., Hagen J. A., Peters J. H., Chan L. S., DeMeester S. R., Gandamihardja T. A., DeMeester T. R. Modern 5-year survival of resectable esophageal adenocarcinoma: single institution experience with 263 patients. J Am Coll Surg 202, 588–596; discussion 596–588 (2006). [DOI] [PubMed] [Google Scholar]
- 6.Blot W. J., Devesa S. S., Kneller R. W., Fraumeni J. F., Jr. Rising incidence of adenocarcinoma of the esophagus and gastric cardia. J Am Med Assoc 265, 1287–1289 (1991). [PubMed] [Google Scholar]
- 7.Cameron A. J. Epidemiology of columnar-lined esophagus and adenocarcinoma. Gastroenterol Clin North Am 26, 487–494 (1997). [DOI] [PubMed] [Google Scholar]
- 8.Winters C., Jr., Spurling T. J., Chobanian S. J. Barrett’s esophagus. A prevalent, occult complication of gastroesophageal reflux disease. Gastroenterology 92, 118–124 (1987). [PubMed] [Google Scholar]
- 9.Morales T. G., Sampliner R. E., Bhattacharyya A. Intestinal metaplasia of the gastric cardia. Am J Gastroenterol 92, 414–418 (1997). [PubMed] [Google Scholar]
- 10.Mueller J., Werner M., Stolte M. Barrett’s esophagus: histopathologic definitions and diagnostic criteria. World J Surg 28, 148–154 (2004). [DOI] [PubMed] [Google Scholar]
- 11.Spechler S. J. Columnar-lined esophagus: Definitions. Chest Surg Clin N Am 12, 1–13 (2002). [DOI] [PubMed] [Google Scholar]
- 12.Katz D., Rothstein R., Schned A., Dunn J., Seaver K., Antonioli D. The development of dysplasia and adenocarcinoma during endoscopic surveillance of Barrett’s esophagus. Am J Gastroenterol 93, 536–541 (1998). [DOI] [PubMed] [Google Scholar]
- 13.Sampliner R. E. Updated guidelines for the diagnosis, surveillance, and therapy of Barrett’s esophagus. Am J Gastroenterol 97, 1888–1895 (2002). [DOI] [PubMed] [Google Scholar]
- 14.Vieth M., Ell C., Gossner L., May A., Stolte M. Histological analysis of endoscopic resection specimens from 326 patients with Barrett’s esophagus and early neoplasia. Endoscopy 36, 776–781 (2004). [DOI] [PubMed] [Google Scholar]
- 15.Muller J. M., Erasmi H., Stelzner M., Zieren U., Pichlmaier H. Surgical therapy of oesophageal carcinoma. Br J Surg 77, 845–857 (1990). [DOI] [PubMed] [Google Scholar]
- 16.Rice T. W., Falk G. W., Achkar E., Petras R. E. Surgical management of high-grade dysplasia in Barrett’s esophagus. Am J Gastroenterol 88, 1832–1836 (1993). [PubMed] [Google Scholar]
- 17.Ell C., May A., Gossner L., Pech O., Günter E., Mayer G., Henrich R., Vieth M., Müller H., Seitz G., Stolte M. Endoscopic mucosal resection of early cancer and high-grade dysplasia in Barrett’s esophagus. Gastroenterology 118, 670–677 (2000). [DOI] [PubMed] [Google Scholar]
- 18.Kiesslich R., Gossner L., Goetz M., Dahlmann A., Vieth M., Stolte M., Hoffman A., Jung M., Nafe B., Galle P. R., Neurath M. F. In vivo histology of Barrett’s esophagus and associated neoplasia by confocal laser endomicroscopy. Clin Gastroenterol Hepatol 4, 979–987 (2006). [DOI] [PubMed] [Google Scholar]
- 19.Georgakoudi I., Jacobson B. C., Van Dam J., Backman V., Wallace M. B., Muller M. G., Zhang Q., Badizadegan K., Sun D., Thomas G. A., Perelman L. T., Feld M. S. Fluorescence, reflectance, and light-scattering spectroscopy for evaluating dysplasia in patients with Barrett’s esophagus. Gastroenterology 120, 1620–1629 (2001). [DOI] [PubMed] [Google Scholar]
- 20.Curvers W. L., Singh R., Song L. M., Wolfsen H. C., Ragunath K., Wang K., Wallace M. B., Fockens P., Bergman J. J. Endoscopic tri-modal imaging for detection of early neoplasia in Barrett’s oesophagus: a multi-centre feasibility study using high-resolution endoscopy, autofluorescence imaging and narrow band imaging incorporated in one endoscopy system. Gut 57, 167–172 (2008). [DOI] [PubMed] [Google Scholar]
- 21.Kara M. A., Peters F. P., Ten Kate F. J., Van Deventer S. J., Fockens P., Bergman J. J. Endoscopic video autofluorescence imaging may improve the detection of early neoplasia in patients with Barrett’s esophagus. Gastrointest Endosc 61, 679–685 (2005). [DOI] [PubMed] [Google Scholar]
- 22.Sharma P., Bansal A., Mathur S., Wani S., Cherian R., McGregor D., Higbee A., Hall S., Weston A. The utility of a novel narrow band imaging endoscopy system in patients with Barrett’s esophagus. Gastrointest Endosc 64, 167–175 (2006). [DOI] [PubMed] [Google Scholar]
- 23.Pohl H., Rosch T., Vieth M., Koch M., Becker V., Anders M., Khalifa A. C., Meining A. Miniprobe confocal laser microscopy for the detection of invisible neoplasia in patients with Barrett’s oesophagus. Gut 57, 1648–1653 (2008). [DOI] [PubMed] [Google Scholar]
- 24.Kiesslich R., Goetz M., Vieth M., Galle P. R., Neurath M. F. Confocal laser endomicroscopy. Gastrointest Endosc Clin N Am 15, 715–731 (2005). [DOI] [PubMed] [Google Scholar]
- 25.Hsiung P. L., Hardy J., Friedland S., Soetikno R., Du C. B., Wu A. P., Sahbaie P., Crawford J. M., Lowe A. W., Contag C. H., Wang T. D. Detection of colonic dysplasia in vivo using a targeted heptapeptide and confocal microendoscopy. Nat Med 14, 454–458 (2008). [DOI] [PMC free article] [PubMed] [Google Scholar]
- 26.Goetz M., Ziebart A., Foersch S., Vieth M., Waldner M. J., Delaney P., Galle P. R., Neurath M. F., Kiesslich R. In vivo molecular imaging of colorectal cancer with confocal endomicroscopy by targeting epidermal growth factor receptor. Gastroenterology 138, 435–446 (2009). [DOI] [PubMed] [Google Scholar]
- 27.Nitin N., Carlson A. L., Muldoon T., El-Naggar A. K., Gillenwater A., Richards-Kortum R. Molecular imaging of glucose uptake in oral neoplasia following topical application of fluorescently labeled deoxy-glucose. Int J Cancer 124, 2634–2642 (2009). [DOI] [PMC free article] [PubMed] [Google Scholar]
- 28.O'Neil R. G., Wu L., Mullani N. Uptake of a fluorescent deoxyglucose analog (2-NBDG) in tumor cells. Mol Imaging Biol 7, 388–392 (2005). [DOI] [PubMed] [Google Scholar]
- 29.Medina R. A., Owen G. I. Glucose transporters: expression, regulation and cancer. Biol Res 35, 9–26 (2002). [DOI] [PubMed] [Google Scholar]
- 30.Yoshioka K., Saito M., Oh K. B., Nemoto Y., Matsuoka H., Natsume M., Abe H. Intracellular fate of 2-NBDG, a fluorescent probe for glucose uptake activity, in Escherichia coli cells. Biosci Biotechnol Biochem 60, 1899–1901 (1996). [DOI] [PubMed] [Google Scholar]
- 31.Lloyd P. G., Hardin C. D., Sturek M. Examining glucose transport in single vascular smooth muscle cells with a fluorescent glucose analog. Physiol Res 48, 401–410 (1999). [PubMed] [Google Scholar]
- 32.Yamada K., Nakata M., Horimoto N., Saito M., Matsuoka H., Inagaki N. Measurement of glucose uptake and intracellular calcium concentration in single, living pancreatic beta-cells. J Biol Chem 275, 22278–22283 (2000). [DOI] [PubMed] [Google Scholar]
- 33.Younes M., Ertan A., Lechago L. V., Somoano J., Lechago J. Human erythrocyte glucose transporter (Glut1) is immunohistochemically detected as a late event during malignant progression in Barrett’s metaplasia. Cancer Epidemiol Biomarkers Prev 6, 303–305 (1997). [PubMed] [Google Scholar]
- 34.Younes M., Lechago L. V., Somoano J. R., Mosharaf M., Lechago J. Wide expression of the human erythrocyte glucose transporter Glut1 in human cancers. Cancer Res 56, 1164–1167 (1996). [PubMed] [Google Scholar]
- 35.Nabi H. A., Zubeldia J. M. Clinical applications of (18)F-FDG in oncology. J Nucl Med Technol 30, 3–9; quiz 10–11 (2002). [PubMed] [Google Scholar]
- 36.Flamen P., Lerut A., Van Cutsem E., De Wever W., Peeters M., Stroobants S., Dupont P., Bormans G., Hiele M., De Leyn P., Van Raemdonck D., Coosemans W., Ectors N., Haustermans K., Mortelmans L. Utility of positron emission tomography for the staging of patients with potentially operable esophageal carcinoma. J Clin Oncol 18, 3202–3210 (2000). [DOI] [PubMed] [Google Scholar]
- 37.Strauss L. G. Fluorine-18 deoxyglucose and false-positive results: a major problem in the diagnostics of oncological patients. Eur J Nucl Med 23, 1409–1415 (1996). [DOI] [PubMed] [Google Scholar]
- 38.Cook G. J., Wegner E. A., Fogelman I. Pitfalls and artifacts in 18FDG PET and PET/CT oncologic imaging. Semin Nucl Med 34, 122–133 (2004). [DOI] [PubMed] [Google Scholar]
- 39.Rosenbaum S. J., Lind T., Antoch G., Bockisch A. False-positive FDG PET uptake-the role of PET/CT. Eur Radiol 16, 1054–1065 (2006). [DOI] [PubMed] [Google Scholar]
- 40.Sheth R. A., Josephson L., Mahmood U. Evaluation and clinically relevant applications of a fluorescent imaging analog to fluorodeoxyglucose positron emission tomography. J Biomed Opt 14, 064014 (2009). [DOI] [PMC free article] [PubMed] [Google Scholar]
- 41.Cestari R., Villanacci V., Bassotti G., Rossi E., Casa D. D., Missale G., Minelli L., Cengia P., Gambarotti M., Pirali F., Donato F., Genta R. M. The pathology of gastric cardia: a prospective, endoscopic, and morphologic study. Am J Surg Pathol 31, 706–710 (2007). [DOI] [PubMed] [Google Scholar]
- 42.Reid B. J., Haggitt R. C., Rubin C. E., Roth G., Surawicz C. M., Van Belle G., Lewin K., Weinstein W. M., Antonioli D. A., Goldman H., et al. Observer variation in the diagnosis of dysplasia in Barrett’s esophagus. Hum Pathol 19, 166–178 (1988). [DOI] [PubMed] [Google Scholar]
- 43.Pierce M. C., Javier D. J., Richards-Kortum R. Optical contrast agents and imaging systems for detection and diagnosis of cancer. Int J Cancer 123, 1979–1990 (2008). [DOI] [PMC free article] [PubMed] [Google Scholar]
- 44.Yasuda S., Ide M., Fujii H., Nakahara T., Mochizuki Y., Takahashi W., Shohtsu A. Application of positron emission tomography imaging to cancer screening. Br J Cancer 83, 1607–1611 (2000). [DOI] [PMC free article] [PubMed] [Google Scholar]
- 45.Som P., Atkins H. L., Bandoypadhyay D., Fowler J. S., MacGregor R. R., Matsui K., Oster Z. H., Sacker D. F., Shiue C. Y., Turner H., Wan C. N., Wolf A. P., Zabinski S. V. A fluorinated glucose analog, 2-fluoro-2-deoxy-D-glucose (F-18): nontoxic tracer for rapid tumor detection. J Nucl Med 21, 670–675 (1980). [PubMed] [Google Scholar]
- 46.Gallagher B. M., Fowler J. S., Gutterson N. I., MacGregor R. R., Wan C. N., Wolf A. P. Metabolic trapping as a principle of oradiopharmaceutical design: some factors resposible for the biodistribution of [18F] 2-deoxy-2-fluoro-D-glucose. J Nucl Med 19, 1154–1161 (1978). [PubMed] [Google Scholar]


