

Abstract
We present a benchmark pilot study in which high-resolution Full-Field Optical Coherence Tomography (FF-OCT) was used to image human breast tissue and is evaluated to assess its ability to aid the pathologist’s management of intra-operative diagnoses. FF-OCT imaging safety was investigated and agreement between FF-OCT and routinely prepared histopathological images was evaluated. The compact setup used for this study provides 1 µm3 resolution and 200 µm imaging depth, and a 2.25 cm2 specimen is scanned in about 7 minutes. 75 breast specimens were imaged from 22 patients (21 women, 1 man) with a mean age of 58 (range: 25-83). Pathologists blind diagnosed normal/benign or malignant tissue based on FF-OCT images alone, diagnosis from histopathology followed for comparison. The contrast in the FF-OCT images is generated by intrinsic tissue scattering properties, meaning that no tissue staining or preparation is required. Major architectural features and tissue structures of benign breast tissue, including adipocytes, fibrous stroma, lobules and ducts were characterized. Subsequently, features resulting from pathological modification were characterized and a diagnosis decision tree was developed. Using FF-OCT images, two breast pathologists were able to distinguish normal/benign tissue from lesional with a sensitivity of 94% and 90%, and specificity of 75% and 79% respectively.
Keywords: Optical coherence tomography, Optical imaging, Breast cancer imaging
Introduction
Breast cancer remains the second leading cause of cancer death in women in the United States, with an estimated 232,620 new cases and 39,970 breast cancer deaths (39,520 women, 450 men) expected in 2011 (1). Nevertheless, in many countries, thanks to more systematic screening and better treatment regimens, breast cancer mortality has steadily decreased since 1990, with a decrease of 3.2% per year in women younger than 50 and of 2% per year for women 50 and older (1). Earlier screening allows for the detection of small invasive lesions and in situ carcinomas. For these lesions, breast-conserving surgery (lumpectomy) is standard practice, along with axillary sentinel node biopsy, in cases of invasive carcinoma.
Prior to definitive curative surgical therapy, routine diagnostic evaluation, usually with needle core biopsy and/or fine needle aspiration, has obviated the need for lesional diagnostic frozen section analysis at the time of surgery (2). In fact, for very small tumors, some have suggested that frozen sections may even be inappropriate for lesional diagnosis (3). However, frozen section analysis may still be performed to assess surgical margins, in an effort to minimize the need for a second surgical procedure. Unfortunately, frozen section analysis reportedly only has an overall sensitivity of 73% (4, 5) and is associated with several drawbacks: it is time consuming (20-30 minutes) (6), highly operator dependent, destructive to the sample as part of the tissue is lost during slide preparation, allows for only limited sampling, and introduces compression and freezing artifacts (7-11) that significantly hamper interpretation. Alternative techniques for immediate assessment of specimen margins, such as touch prep cytology (12) or intraoperative radiography (13), are also fraught with disadvantages, including poor sensitivity, limited spatial resolution, and added time. As a result, the re-excision rate is typically 20%, and may be as high as 40% (5, 6, 14-19). Consequently, improvements in the ability to perform accurate intra-operative margin assessment using a sub-surface optical microscopic biopsy technique is attractive, particularly if it is easy to perform, operator independent, nondestructive, fast and provides high enough spatial resolution to mimic traditional histopathological analysis.
Successful optical sectioning has been achieved on excised skin (Mohs surgery) using confocal microscopy (20) and multiphoton microscopy (21). However, the need to use large numerical aperture objectives to “slice” the tissue makes confocal microscopy sensitive to tissue-induced aberrations as well as to the effects of multiple scattering. Alternatively, optical sectioning techniques using Optical Coherence Tomography (OCT) (22) with a deep red or near infrared sample illumination offers many advantages: they are safe, non destructive (no biological or chemical modification) and do not require any exogenous contrast agents that could potentially compromise the tissue integrity for subsequent routine histopathological preparation or molecular testing. In the current study, we use the FullField OCT (FF-OCT) (23, 24) technique to provide large fields of view and high-resolution images of unprocessed breast specimens.
Comparison of FF-OCT to other Current Imaging Techniques
Main current imaging techniques comparable to FF-OCT are traditional OCT (22), confocal microscopy (25) and Optical Coherence Microscopy (OCM) (26).
Numerous studies have been published during the past few years, demonstrating the suitability of OCT imaging for both in vivo and ex vivo tissue diagnosis. OCT has been previously investigated in a variety of tissues such as the eye (26-29), upper aerodigestive tract (30-33), gastrointestinal tract (34, 35), breast tissue and lymph nodes (36-43). One of the earliest studies on human breast tissue showed that benign and malignant lesions could be differentiated using “Ultrahigh Resolution and Three-dimensional Optical Coherence Tomography” (38), which correlated OCT images with histopathological findings for ductal carcinoma in situ, invasive cancer and micro-calcifications. Another study (39), based on spectral-domain OCT, focused on the assessment of breast tumor margins and demonstrated good sensitivity and specificity. However, this study, involving a significant number of patients and images, is specific to tumor margin evaluation and uses diagnostic criteria based on “large scatterers” rather than on the microscopic morphology. Both these studies of breast tissue used techniques that had limited spatial resolution: the former obtained a 6 µm transverse resolution and 3.5 µm axial resolution, while the latter obtained a 6 µm axial resolution and 35 µm transverse resolution. Unfortunately, at these resolutions, OCT images appear fuzzy compared to conventional histology. Indeed, in order to satisfy the pathologist’s perceived requirements, the optical technique must mimic that seen with traditional histology: typically a field of view must be larger than 1 cm2 and the smallest details (spatial resolution) should be closer to 1 µm.
From a technical point of view, in the FF-OCT setup that is described in detail in the instrumental section, we use immersion microscope objectives with a numerical aperture of 0.3 while in OCT setups, numerical aperture is typically one order of magnitude lower (44), and therefore the scattered light detected is between 10 and 100 times weaker. As a result, the resolution and contrast of OCT images are much lower compared to those obtained with FF-OCT.
Improved resolution has recently been accomplished by combining two techniques: OCT, with its large field of view and Optical Coherence Microscopy (OCM) with its maximum lateral resolution of 2 µm (26). By doing so, it was possible to achieve high-resolution images of small zones with a sectioning ability (axial resolution) of 4 µm. With this improved resolution, the comparison of images with conventional histology of breast tissue is striking, providing an ability to distinguish adipose tissue, fibrous stroma, breast lobules and ducts, as well as in situ and invasive carcinomas. The system used combines two techniques and a change in magnification is achieved by switching between the two: a 3D OCT using a femtosecond Nd:Glass for large field imaging and an OCM for high resolution detail, where the field of view is limited to 400 × 400 µm2. However pathologists need to be able to identify a zone of interest for assessing the malignancy of a breast specimen. With low resolution on a large field image it can be difficult to identify the right zone on the specimen, and the reduced field of view of the OCM image may represent a drawback for clinical use of OCM.
In addition, the cost of an adequate femtosecond laser remains very high. Although laser technology continues to improve, these lasers remain expensive, often costing as much as the rest of the OCM setup. Large peak power at the focus of ultra fast laser can induce high order photobleaching as has been often observed in 2-photon fluorescence (45). Other endogenous chromophores such as melanin can limit tissue imaging by causing thermal and mechanical damage during an experiment.
Other limitations to the study included the inability to carry out accurate statistical analysis of sensitivity and specificity due too few specimens and an inability to determine detection accuracy of the new imaging technology due to non-blinded evaluation of the images.
Confocal microscopy (25) offers micrometer resolution but the imaging depth is limited. In human skin for example (46), penetration into the dermis (around 200 µm) is achieved with FF-OCT while confocal microscopy reaches only the papillary dermis (less than 100 µm).
In the current study, we use Full-Field OCT (FF-OCT) (11) to capture high-resolution images of unprocessed breast specimens. The pathologist may navigate a large field image (for this study, 2-2.25 cm2) and digitally zoom in to the cellular scale. Neither endogenous contrast agents nor chromophores are necessary; specimens are excised from mastectomy pieces and imaged directly. FF-OCT has proven its suitability and performance for high-resolution, wide field imaging of human and animal tissues (46, 47).
The objective of this study is to evaluate whether breast images obtained with FF-OCT contain a level of detail sufficient for a pathologist to identify tissue structures and make a diagnosis.
Materials and Methods
Instrument
OCT (22) is a technique for imaging scattering media such as biological tissues by interferometric selection of ballistic photons. It has proved an invaluable tool for biomedical imaging. Unlike conventional OCT, FF-OCT directly captures “en face” images on megapixel cameras at high lateral resolution (down to 1 µm) by using medium to large aperture microscope objectives and high axial resolution (1 µm) thanks to its use of a white light source (48, 49). FF-OCT can image unprocessed tissue samples down to a few hundred micrometers below the specimen surface (depending on tissue type) and generate 3D image volumes by capturing micron-thick optical slices while stepping through the depth of the sample. The penetration of the beam into the volume of the sample induces a shift between the focus and the sectioning plane due to refractive index mismatch. In order to compensate for this phenomenon and the aberrations that may take place, a real time optimization of the signal is performed (50).
The principle of FF-OCT relies on low coherence interference microscopy. The experimental set-up of FF-OCT (Figure 1) is based on a configuration that is referred to as a Linnik interferometer (51). A halogen bulb is used as a spatially incoherent source to illuminate the whole field of an immersion microscope objective. Due to the low temporal coherence of the source, interference occurs only when the optical path lengths of the two-interferometer arms are identical to within 1 µm, which is equal to the effective coherence length of the source (taking into account the camera spectral response) divided by 2n, n being the refractive index of the sample. When a biological object is placed under the microscope objective in the object arm, the light reflected by the reference mirror interferes with the light reflected or backscattered by the sample structures contained in a limited volume that is a slice orthogonal to the objective axis, located at a depth inside the object defined by an optical path length difference of zero. The signal is extracted from the background of incoherent backscattered light using a phaseshifting method.
Figure 1:

FF-OCT experimental setup: schematic of FF-OCT setup based on a Linnik interferometer configuration (A), photograph of compact set-up used for the study (B), the sample moves under the objective for imaging (C), the sample mounted in its holder (D).
Capturing images in the “en face” orientation allows for easy comparison with histological sections. The resolution, pixel number and sampling requirements result in a field of view that is limited to about 1 mm2. The resolution of the FF-OCT setup used was 1.4 µm transverse × 1 µm axial, and pixel size on the sample was 0.8 µm. Histology sections are typically ~ 1 cm2 and a pathologist typically evaluates tissue at several magnifications where field of view varies from cm down to µm, in order to make a full diagnosis. To achieve these parameters with our system, we move the sample on a high precision mechanical platform in order to create a mosaic of native field images that are stitched together to display a larger field of view (52, 53). Automated displacements of the motorized sample platform allow acquisition of a mosaic of image tiles, each one with an overlap of 20% (160 µm) to its immediate neighbors, in order to correct the sample platform displacement error. To reconstruct a large field image composed of the set of tiles, we use a stitching algorithm that uses a global optimization technique, available with Fiji-ImageJ (53).
Due to its “en face” acquisition of the images, FF-OCT offers better lateral resolution than conventional OCT. Indeed FF-OCT does not need the large depth of field required for time domain, spectral domain, Fourier-domain or swept-source OCT. For these conventional OCT variants, the available depth range must be of the same order as the depth of field of the objective, therefore requiring low numerical aperture optics, which consequently limits the lateral resolution capability to typically 5 to 40 µm. In contrast, the lateral resolution of FF-OCT is comparable to OCM (24), but its axial resolution is better than what could be obtained using super-fast lasers, while facilitating more flexibility and a better ability to capture a large field of view.
Our compact (310 × 310 × 800 mm L × W × H, about the size of a standard optical microscope) FF-OCT set-up (Figure 1) used for this study was located in a laboratory room used for frozen section analysis (Figure 1B). The system is unobtrusive and does not create any undesired heating, lighting or sound in the room. Optical power incident on the sample is <1 mW/mm2, and due to the incoherent nature of the source and its visible light spectrum (the source is a simple halogen bulb), this poses no risk of thermal damage to tissue over the few-minute durations required for image capture.
The FF-OCT system used optimally requires 20 minutes warm up time from switch on to reach thermal equilibrium. If images are acquired before this warm up time is complete, field illumination may be inhomogeneous and slight mechanical misalignments may produce artifacts on the images, visible as broad lines on Figure 5B.
Figure 5:

Different types of invasive adenocarcinoma. Stellate (A-D) and nodular (E-H). FF-OCT images were acquired 20 µm beneath the tissue surface. The trabeculae of the highly scattering tumor-associated fibrous tissue can be observed (F). This is in contrast to the normal fibrous tissue that appears grainy and produces less scattering (G). Furthermore, tumor-associated adipocytes are smaller than those outside the tumor (D). In the stellate tumor (B), the fibrous tissue is seen invading the adipose tissue. In the nodular tumor (F), foci of carcinoma cells appear as grey zones surrounded by the highly scattering tumorassociated fibrous tissue trabeculae (H). A circular dilated duct with secretion in the lumen is visible in the center of the nodule. The different aspect of fibrous tissue defines the tumor margins (G).
Imaging Protocol
Written consent was obtained prior to imaging according to the standard procedure in Tenon Hospital (Paris) for each patient undergoing biopsy or surgical resection.
Sample Selection
For each patient we procured at least 4 tissue samples, each averaging 2-2.25 cm2: One sample from the tumor, one at the edge of the tumor and two from adjacent areas of normal appearance. Gross examination alone was used to identify the tumor. The size of the tissue samples was comparable to those typically used for frozen section analysis.
Sample Preparation
Sample tissues were gross tissue pieces of <2 × 2 × 1 cm3 with no particular preparation for FF-OCT imaging compared to that routinely performed e.g., for frozen section analysis. The sample tissue was placed in a sample holder and immersed in a saline solution. A custom cover slip was placed over the specimen, and the sample holder piston was raised in order to rest the sample gently against the cover slip (Figure 1D). This flattens the surface, reduces optical aberrations and the sandwiching effect immobilizes the sample. The sample in its holder was then placed under the microscope (Figure 1C), and optical immersion oil was applied between the cover slip and the objective to ensure a continuous optical path. The specimen is protected from the environment and is isolated from the air and the objective immersion oil.
From the moment the sample was placed in the holder to the moment the system was ready to acquire the images (i.e. including automated positioning of the sample and detection of the surface) took around 2 to 3 minutes, which in addition to the image acquisition and stitching time of 7 minutes equals under 10 minutes from first sample handling to image viewing.
Image Acquisition
For consistency, our comparison between images acquired by FF-OCT and histology preparations was primarily performed with images taken at 20 µm below the cover slip, as at this depth the paraffin block begins to produce slices showing the full sample surface, but these slices would normally be discarded by the pathologist in favor of deeper slices. We were therefore able to use these 20 µm depth histology slides without disturbing the normal workflow of the pathology department. In addition, at this shallow depth we obtained the least attenuated signal on the FF-OCT images. In most cases, in order to facilitate the comparison with HES stained slides, the entire tissue sample was imaged with the FF-OCT setup. As the objective of this study was to produce histology-like images with the FF-OCT instrument to enable comparison, it was considered most pertinent to capture a single “en face” image of each sample in a single plane. Nevertheless it should be noted that the penetration depth of the FF-OCT technique typically extends to approximately 150 µm in fibrous tissues and down to approximately 200 µm in adipose tissues (47). The interest of 3D imaging in depth is application dependent and was not considered pertinent to this study.
All FF-OCT images were displayed using a non-inversed linear Look Up Table (LUT) scale. Thus, the hypo-scattering structures appear black, whereas the hyper-scattering structures appear white.
After the FF-OCT imaging procedure, the samples were fixed in formalin and subjected to routine processing including paraffin embedding, HES staining and sectioning at the same estimated depths. The resulting slides were then scanned to produce whole slide images for use as comparative images.
Matching with Histology
We acknowledge that it is difficult to obtain exact matches between FF-OCT images of the fresh tissue and histology slides of tissue that has been modified due to the processes necessary for gold standard histology (fixing, inclusion in paraffin and microtome slicing). A match is most easily performed at low magnification, although the 2D-tilt of the sample on the slides and on the FF-OCT images may differ, i.e. when the specimen is paraffin embedded it is positioned with an angle in the volume of the paraffin that may be different to the spatial orientation of the specimen when it is placed in the sample holder during FF-OCT imaging. Therefore, when the slicing of the paraffin block is performed it appears that the section on the histology block and the “optical section” of the FF-OCT image are not identical.
In order to be able to efficiently compare the histology to the FF-OCT images, although the orientation and the section were not exactly identical, we decided for the reasons explained in the previous section to image all our 2.25 cm2 specimens at 20 µm below the surface, i.e. at a depth sufficient to ensure that the whole sample area is visible on both FF-OCT images and histology slides.
We devised a matching procedure whereby the outline of the sample served as a landmark to aid in locating finer structures in the tissue. Typically we first matched the overall sample outline, followed by large structures such as vessels or tears in the tissue, and finally fine features such as ducts, areas of cancerous tissue, etc., could be approximately matched.
Study Protocol
75 breast specimens were imaged from 22 patients (21 women, 1 man) with a mean age of 58 (range: 25-83). A total of 193 images were acquired. The FF-OCT instrument used is a commercial system and produces images of repeatable quality provided the sample is positioned correctly. The instrument automatically searches for the sample surface on switch-on and displays a live image of the sample surface. If the sample is not completely in contact with the cover slide, the imaging depth must be lowered until the entire image plane passes through the sample to avoid blank areas appearing on the final image. In the current study, images were captured 20 µm beneath the surface where in all but 6 cases acceptable images were acquired. These 6 cases were eliminated due to non-optimal contact with the cover slide.
Images of fresh tissue have better contrast and all figures showed in the manuscript are from fresh specimens. Nevertheless images from fixed specimens were easily interpretable by the pathologists and we included both fresh and fixed specimens in the sensitivity and specificity study. The samples included tissues of normal appearance as well as a large range of breast lesions from men, post- and pre-menopausal women. No discrimination was made regarding the patient’s age or health status, in order to verify that the malignancy assessment could be made on the broadest possible selection of breast tissue.
In most cases, samples were selected from freshly excised radical mastectomy specimens, e.g., large malignant or multifocal tumors, benign macroscopic lesions and/or normal appearing tissue present in other areas of the same breast. A selection of the cases to be sampled was made in order to be able to image a larger amount of different lesions with different macroscopic appearance (nodular or stellate) and different histological types of invasive carcinoma. This information was available from pre-operative diagnoses (mammography and needle core biopsy). Most patients had more than one diagnosis classification associated with their histopathological assessment.
The study was conducted in three phases:
Phase 1: Evaluation of FF-OCT safety on human breast tissue. After FF-OCT, samples were processed for routine standard histopathology and compared to histological sections from other specimens of the same region of the breast that did not undergo FF-OCT. The specimens imaged by FF-OCT were assessed for any adverse impact on tissue architecture revealed by HES staining, or on immunophenotypes assessed by immunochemistry. Six additional radical mastectomy specimens were included in this part of the study. For carcinoma specimens, usual markers tested by Immunohistochemistry (IHC) involved in tumor evaluation were quantified to verify that FF-OCT does not alter the parameters usually tested. Thus, the signal of Estrogen and Progesterone receptors, Cerb B2 (Her2/neu), ki-67 and E-Cadherin was evaluated and quantified on tumor samples that were imaged with FF-OCT and compared to tumor samples from the same patient that did not undergo FF-OCT. For normal breast tissue specimens, the signal of other IHC markers such as Cytokeratin (CK) 7, 14, 18, 5/6 and vimentin was evaluated and quantified on samples imaged with FF-OCT. The signal obtained was compared to their usual expected signal on normal breast tissue.
Phase 2: Identification of the main architectural features of human breast tissue in FF-OCT by comparison with standard histopathology slides prepared from the same specimens. Images were reviewed by two senior-staff breast pathologists (MA and BS) who underwent identical training on a sample set of images.
Phase 3: FF-OCT images were reviewed by two senior-staff breast pathologists (MA and BS). Each pathologist classified the images into two diagnostic categories: normal/ benign or malignant. They received neither macroscopic images of the samples nor histological slides/whole slide images. The test was conducted long after surgery to prevent any possible familiarity with the case, and the pathologists had no pre-operative assessment information for the patients. Once complete, their designations were compared to the diagnosis based on the gold-standard histopathology preparations of the same tissue. Diagnosis from histopathology was performed by one of the pathologists (MA) on an occasion subsequent and separated in time from the diagnoses by FF-OCT.
Results
Phase 1: Safety
On comparison, the value of the different evaluation markers on the tumorous specimens imaged with FF-OCT were not significantly different from those obtained on matched control specimens from similar regions of the specimen that had not been not imaged with FF-OCT. For normal breast tissue, the localization of the signal of the different types of CK and vimentin was not significantly different from the expected signal on normal breast tissue.
Therefore, no alteration of any of the parameters assessed (histopathology and immunohistochemistry) was observed following the FF-OCT procedure.
Phase 2: Correlation of the Morphologic Features in FF-OCT Images with Gold Standard Histopathology
The two pathologists concurred on identification of normal tissue features and worked together to devise the diagnosis decision tree presented in Figure 3.
Figure 3:

Diagnosis decision tree for FF-OCT images of human breast tissue.
Part 1: Recognition of breast tissue features: By conducting a comparative analysis with normal breast tissue, the morphologic features of the major components of breast tissue in the FF-OCT images could be identified, including fibroadipose tissue, epithelial ducts, vasculature and fibrous tissue (Figure 2). For example, it was found that the galactophorous ducts, when cut tangentially, are recognizable by light grey color, which we hypothesize is generated by their highly scattering thick elastic membranes (Figure 2C). In contrast, the same glands, when cut longitudinally, exhibit a characteristic epithelial layer of varying thickness that appears dark grey (Figure 2B). Intraluminal secretions are sometimes identified. The lobules (Figure 2A) are identified as dark grey, granular, rounded structures. The vessels (Figure 2D), when cut tangentially, do not have the thick epithelial layer of the galactophorous ducts, but are also associated with the presence of an elastic membrane. The adipocytes (Figure 2E) are hypo-scattering, and appear as black rounded structures. Their membranes scatter more and appear grey. The characteristic honeycomb configuration of the fat cells is easily identified. The healthy fibrous tissue appears grainy with medium back-scattering signal (Figure 2G). The fibrous tissue in the stroma is made of hyper-scattering trabeculae (Figure 2H). The scar fibrous tissue is made of thick and large trabeculae, less scattering than the stroma (Figure 2F). Calcifications appear white (Figure 2C) due to their very high backscattering levels. The high resolution of the FF-OCT technique makes the very thin membranes of the vessels and adipocytes visible (Figure 2D, E).
Figure 2:

Breast tissue basic structures. Lobule (A), galactophorous duct (B), cross section of a galactophorous duct with calcifications (C), vessel (D), adipocytes (E), scar fibrous tissue (F), normal fibrous tissue (G), fibrous tissue surrounding carcinomatous cells in tumourous stroma (H). FF-OCT images were acquired 20 µm beneath the tissue surface.
Lobules, ducts and adipocytes were features that were clearly distinguished in both FF-OCT images and histology. FF-OCT images presented an advantage in being able to distinguish the granular fibrous appearance of normal tissue and the fine trabeculae of malignant tissue, whereas these details are not well visualized in histology with HES staining and require use of special trichome stains. A drawback of the FF-OCT images is the lack of visibility of individual nuclei as the backscattering signal of the nuclei is low in breast tissues. Indeed, pathologists found it misleading that necrosis was not always well visualized with FF-OCT. The overall signal amplitude, or whiteness, of the tissue therefore had to be taken into account over and above detection of necrosis as the predominant indication of malignancy. Overall tissue architecture and form was sometimes better visualized with FF-OCT than in histology in cases where histology slices had been taken too close to the edge of the block. In comparison with studies on similar tissues comparing histology with conventional OCT (38), FF-OCT performs better than conventional OCT, particularly on distinguishing the smallest features, due to its higher resolution.
Part 2: Distinction between benign/normal and malignant tissue: After gaining an understanding of the appearance of normal morphological features of human breast tissue in our images, we next focused on discerning what aberrations of these morphological features in our images would allow characterization of the tissue as benign/normal or malignant. The analysis produced a distinct set of criteria that need to be satisfied for accurate discrimination between benign/normal and malignant tissue, along with a recommended workflow that should be followed. The workflow and criteria are presented as a flowchart (Figure 3), and briefly outlined below:
Assess the FF-OCT images following the criteria used for low magnification assessment of standard histology slides. These would include identifying features such as the presence or absence of stellate lesions, and the entanglement of the adipose and fibrous tissues.
If there is no evidence of tumors at low magnification, it is necessary to verify the presence of intact normal breast tissue structures such as lobules, galactophorous ducts and vessels at high magnification.
- If there is no obvious tumor and no evidence of intact normal structures, the following criteria for reading the FF-OCT images must be used.
- Assess the shrinkage of the adipose tissue, which is characterized by the presence of adipocytes of different sizes at the periphery of an invasive carcinoma. In most cases, at the interface of the lesion, fat cells appear smaller and less rounded.
- Search for the presence of grey zones, typically surrounded by white fibrous structures (corresponding to foci of carcinoma surrounded by fibrous tissue).
- Assess the color and morphology of this fibro us tissue. The appearance of the fibrous tissue is different depending on the type of collagen present. In FF-OCT images, the fibrous tissue of malignant tumor-associated stroma is very white, while it is greyer for scar-associated fibrous tissue or normal/benign breast fibrous tissue. Furthermore, the fibrous tissue architecture differs, usually appearing as thin trabeculae in malignant tumor-associated stroma, while appearing as thick trabeculae in tissue associated with reactive/reparative change (i.e. scar tissue) (Figure 2F). Trabeculae are not seen in normal or benign fibrous tissue (Figure 2F-H).
Figure 4 shows normal breast tissue of a post-menopausal woman. Characteristic structures of breast tissue such as the lobules, galactophorous ducts, adipocytes and a normal fibrous tissue are identifiable. Some entanglement of the fibrous tissue and adipose tissue is noted.
Figure 4:
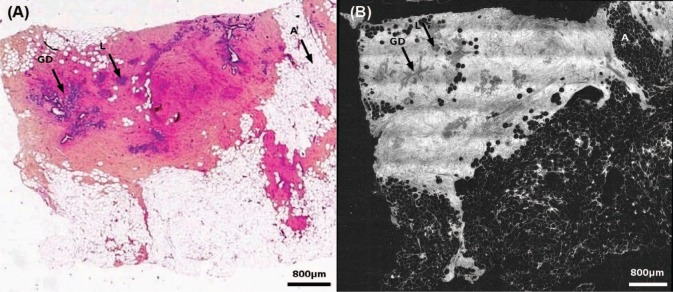
Healthy breast tissue specimen. Post-menopausal woman. FF-OCT image was acquired 20 µm beneath the tissue surface. Whole slide image of the conventional gold-standard histology preparation (A) and the corresponding FF-OCT image (B). Characteristic structures of breast tissue such as the lobules (L), galactophorous ducts (GD), adipocytes (A) and a normal fibrous tissue are seen. Some entanglement of the fibrous tissue and adipose tissue is visible. The fibrous tissue appears grainy with a medium back scattering level. Ducts are cut longitudinally; thus they appear dark grey. A digital zooming on the image reveals acini in the lobules.
The fibrous tissue appears grainy with a medium back scattering level. Ducts are cut longitudinally; thus they look dark grey. Zooming in digitally on the image reveals acini in the lobules.
In Figure 5, two types of invasive carcinoma can be seen: a stellate tumor (Figure 5A-D), and a nodular tumor (Figure 5E-H). In both lesions, the trabeculae of the highly scattering tumor-associated fibrous tissue are observed (Figure 5D, H). This is in contrast to the normal fibrous tissue that appears grainy and produces less scattering (Figure 5G). Furthermore, tumor-associated adipocytes are smaller than those outside of the tumor (Figure 5D). In the stellate tumor, (Figure 5B), the fibrous tissue is seen invading the adipose tissue. In the nodular tumor (Figure 5F), foci of carcinoma cells appear as grey zones surrounded by the highly scattering tumor-associated fibrous tissue trabeculae (Figure 5H). A circular dilated duct with secretion in the lumen is visible in the center of the nodule.
Figure 6 shows an Invasive Ductal Carcinoma (IDC) with an associated Ductal Carcinoma In Situ (DCIS) component. Enlarged lobules and ducts filled with DCIS (Figure 6C, D) are clearly visible on the image. In addition, the invasive component is characterized by the presence of highly scattering fibrous tissue (Figure 6B) and foci of darker grey carcinoma cells (Figure 6D).
Figure 6:

Ductal invasive adenocarcinoma with Ductal Carcinoma In Situ (DCIS) component. FF-OCT images were acquired 20 µm beneath the tissue surface. Histology (A) and FF-OCT image (B) with digital zooms (C-E). Enlarged lobules and ducts filled with DCIS (D, E) are clearly visible on the image. In addition, the invasive component is characterized by the presence of highly scattering fibrous tissue (C) and foci of darker grey carcinoma cells (E).
A fibroadenoma is shown in Figure 7F and the enlarged ductules (Figure 7G) characteristic of this benign lesion are easy to distinguish on the FF-OCT image. DCIS is noted in Figure 7B characterized by enlarged abnormal lobules (Figure 7C) and ducts (Figure 7D) that can be distinguished easily by a digital zoom in on the image. The acini in the enlarged lobule are clearly visible and the narrow lumen in the duct is indicative of malignancy.
Figure 7:

Ductal carcinoma. Histology (A, E) and FF-OCT (B-D, F, G) of a ductal carcinoma in situ (B) with an abnormal duct (C) and an enlarged lobule (D). Fibroadenoma (F) and an enlarged ductule (G). FF-OCT images were acquired 20 µm beneath the tissue surface. DCIS is noted in (B), characterized by enlarged abnormal lobules (D) and ducts (C), which can be distinguished easily in a digital zoom-in on the image. The acini in the enlarged lobule are clearly visible and the narrow lumen in the duct is indicative of malignancy.
Phase 3: Assessment of the Diagnostic Accuracy of FF-OCT
Samples from 21 patients were counted in the results. The histology results from the 22nd patient samples were mislaid and so this data was eliminated from the study. Based on the FF-OCT images alone, the analysis of 78 samples from the 21 patients by the first breast pathologist (MA) yielded 28 true positives, 34 true negatives, 3 false negatives and 9 false positives, giving a sensitivity of 90% and a specificity of 79%. The analysis of 79 samples from the 21 patients by the second breast pathologist (BS) yielded 31 true positives, 33 true negatives, 2 false negatives and 11 false positives giving a sensitivity of 94% and a specificity of 75% (Table I).
Table I.
Results of diagnoses from FF-OCT compared with histology.
| Pathologists | True positives | True negatives | False positives | False negatives | Not interpretable | Sensitivity (%) | Specificity (%) |
|---|---|---|---|---|---|---|---|
| MA | 28 | 34 | 9 | 3 | 4 | 90 | 79 |
| BS | 31 | 33 | 11 | 2 | 2 | 94 | 75 |
Note that for each pathologist, a few FF-OCT images (4-MA, 2-BS) were considered uninterpretable, primarily due to a non-optimal positioning of the sample under the glass plate of the sample holder. As previously described, this caused images to be acquired at a depth at which the optical slice did not pass through the whole sample area, resulting in blank areas on the final image.
Although this study did not seek to achieve tumor classification beyond a benign/normal versus malignant diagnosis, in several cases the pathologists were able to identify a specific histopathological diagnosis, such as Invasive Ductal Carcinoma (IDC) (3-MA, 3-BS), Ductal Carcinoma In Situ (DCIS) (2-MA, 1-BS), or benign fibroadenomas (2-MA, 2-BS) directly from the FF-OCT images.
Looking at reasons for misclassification can suggest which pathologies are least recognizable in FF-OCT images. For MA, the 3 false negatives resulted from samples from a single patient with Invasive Lobular Carcinoma (ILS) and Lobular Carcinoma In Situ (LCIS). For BS, the two false negatives resulted from one sample diagnosed as adenofibroma when in fact it was a malignant tumor, and one sample diagnosed as normal when in fact it was ILS and LCIS (this false negative common to both pathologists). These results suggest that ILS and LCIS are more difficult to recognize and are often confused with normal tissue. A possible way to improve on the classification of lobular carcinomas may be to measure lobular size on the images with the annotation tool.
False positive results were often associated with adenofibromas. Adenofibromas are liable to cause confusion as the deformation of the mammary tissue architecture associated with this benign lesion can give the impression of malignancy.
Final histopathological diagnoses on the 21 patients, performed by the same pathologists, included 11 cases of IDC, 8 of DCIS, 3 of ILC, 3 of LCIS, 1 of invasive mucinous adenocarcinoma, 1 of Atypical Ductal Hyperplasia (ADH) and 3 of Atypical Lobular Hyperplasia (ALH). Two cases were benign adenofibromas. Often more than one diagnosis was associated with each patient (e.g., IDC + DCIS). Both pathologists discussed and agreed on the final diagnoses.
Discussion
In this benchmark pilot study, we describe the first pre-clinical evaluation of FF-OCT for ex-vivo human breast tissue analysis and diagnosis. We have shown that the technique is safe, producing no demonstrable alterations that affect interpretation of conventional histology preparations following imaging, or any alteration in the ability to perform immunohistochemistry for a variety of epitopes. We have demonstrated an ability to identify and assess the microstructure of normal human breast tissue including glands, lobules, galactophorous ducts and adipose tissue. We have developed a set of initial criteria and a recommended workflow for interpreting FF-OCT images to accurately differentiate whether the alterations observed are benign/normal or malignant. Two breast pathologists applied these criteria, and were able to distinguish normal from benign tissue, and in situ and invasive carcinomas using FF-OCT images, with a sensitivity of 94% and 90% respectively, and specificity of 75% and 79% respectively. In some cases, a specific histopathological diagnosis could be made by the pathologists, such as IDC, DCIS, or benign fibroadenoma.
FF-OCT is the first ultra-high resolution optical imaging technique that combines the possibility of obtaining breast tissue images over an adequately large area, while producing images of sufficiently high resolution, thereby allowing pathologists to mimic routine histopathology diagnostic workflow by zooming in and out on the images. The 1 µm3 resolution offered by FF-OCT outperforms other optical imaging techniques to closely mimic histopathology. A diagnostic decision tree has been established that allows pathologists to classify tissue as malignant or benign/normal. While the values obtained for sensitivity and specificity could indeed be improved, it is important to note that this diagnostic accuracy assessment was totally blinded to any clinical information or context, and that the breast tissue remains a very complex organ, with numerous potential histopathological entities.
While the current study has only a limited sample size, and concentrates on a single organ system, the lessons acquired from this initial pilot study will help with the design of future evaluations of tissue samples from all the major organ systems.
In its current stage of development, FF-OCT is of interest for several use cases. First, it represents a paradigm shift in the handling of immediate assessment of resected tissue. For the first time, it allows a primary digital acquisition of enough information to allow pathologists to meaningfully interpret the morphologic tissue features, on fresh tissue, in a non-destructive manner. The rapid image capture and lack of sample preparation (e.g., staining, freezing or slicing) has the potential to significantly reduce the time it takes to provide this interpretation to surgeons. For certain types of frozen section, such as margin assessment, it has the potential to diminish the need for a re-excision and improve post-operative prognosis. Because it is non-destructive, it has potential in performing both immediate and routine assessment of high risk, small biopsy specimens, such as those obtained from central nervous system tumors. In fact, it could be used to carry out immediate or permanent assessments of tissue biopsies in a variety of contexts. For a typical core needle biopsy with a surface area of 0.2 cm2, imaging can be accomplished in about 1 minute. This would then allow for additional testing of the tissue, particularly in cases where fresh non-fixed, non-paraffin embedded tissue is required.
In vitro application of this technology may also be evaluated for both clinical and research tissue banking (where tissue is cryopreserved for future use, such as DNA or RNA extraction). In oncology, the diagnosis and treatment of tumors frequently requires molecular diagnostic information (i.e. gene mutations, translocations, amplifications) to inform targeted therapy. The optimization of these techniques on small biopsy samples is crucial for the pathologist, the clinician and the patient, particularly those who have advanced or metastatic, and thus inoperable, cancer. The fact that FF-OCT does not consume the tissue and does not induce alterations is an advantage.
Moreover, the standard procedures in a typical pathology laboratory (e.g., embedding tissue, sectioning of a paraffinembedded tissue with the microtome, frozen section preparation with a cryostat) are not automated. Thus, these procedures are time consuming and require expert technical personnel. Therefore “triaging” of specimens by FF-OCT could significantly streamline the workflow, such that only truly important specimens are paraffin-embedded and processed for gold standard histopathology.
Finally, application of FF-OCT endoscopically for in vivo assessment is of interest in the clinical and surgical setting. Indeed, endoscopic FF-OCT for application in vivo has been recently demonstrated (54).
Acknowledgements
This work was supported in part by Institut National du Cancer (INCA/ONCODIAG n°2009-1-PL BIO 16-ESPCI-1) and by the foundation Pierre Gilles de Gennes pour la recherche.
We would like to thank Eolia Flandre for performing histological sections used for this work.
Abbreviations
- OCT:
Optical Coherence Tomography
- FF-OCT:
Full-Field Optical Coherence Tomography
- OCM:
Optical Coherence Microscopy
- HES:
Hematoxylin and Eosin Stain
- IDC:
Invasive Ductal Carcinoma
- DCIS:
Ductal Carcinoma In Situ
- ILS:
Invasive Lobular Carcinoma
- LCIS:
Lobular Carcinoma In Situ
- ADH:
Atypical Ductal Hyperplasia
- ALH:
Atypical Lobular Hyperplasia
Footnotes
Conflict of Interest: ACB and BdP have indirect stock ownership in LLTech SAS. LLTech SAS has not sponsored the study.
References
- 1.American Cancer Society: Cancer Facts and Figures; 2011.
- 2.Silverstein MJ, Recht A, Lagios MD, Bleiweiss IJ, Blumencranz PW, Gizienski T, Harms SE, Harness J, Jackman RJ, Klimberg VS, Kuske R, Levine GM, Linver MN, Rafferty EA, Rugo H, Schilling K, Tripathy D, Whitworth PW, Willey SC. Image-detected breast cancer: state-of-the-art diagnosis and treatment. J Am Coll Surg 209, 504–520 (2009). DOI: 10.1016/j.jamcollsurg.2009.07.006. [DOI] [PubMed] [Google Scholar]
- 3.Cendán JC, Coco D, Copeland EM. Accuracy of intraoperative frozen-section analysis of breast cancer lumpectomy-bed margins. J Am Coll of Surg 201, 194–198 (2005). DOI: 10.1016/j.jamcollsurg.2005.03.014. [DOI] [PubMed] [Google Scholar]
- 4.Nakazawa H, Rosen P, Lane N, Lattes R. Frozen section experience in 3000 cases: accuracy, limitations, and value in residence training. Am J Clin Pathol 49, 41–51 (1968). [DOI] [PubMed] [Google Scholar]
- 5.Olson TP, Harter J, Munoz A, Mahvi DM, Breslin T. Frozen section analysis for intraoperative margin assessment during breast-conserving surgery results in low rates of re-excision and local recurrence. Ann Surg Oncol 14, 2953–2960 (2007). DOI: 10.1245/s10434-007-9437-1. [DOI] [PubMed] [Google Scholar]
- 6.McLaughlin SA, Ochoa-Frongia LM, Patil SM, Cody HS, 3rd, Sclafani LM. Influence of frozen-section analysis of sentinel lymph node and lumpectomy margin status on reoperation rates in patients undergoing breast-conservation therapy. J Am Coll Surg 206, 76–82 (2008). DOI: 10.1016/j.jamcollsurg.2007.07.021. [DOI] [PubMed] [Google Scholar]
- 7.Ishak K. Benign tumors and pseudotumors of the liver. Appl Pathol 6, 82–104 (1988). [PubMed] [Google Scholar]
- 8.Taxy J. Frozen section and the surgical pathologist: a point of view. Arch Pathol Lab Med 133, 1135–1138 (2009). [DOI] [PubMed] [Google Scholar]
- 9.Sienko A, Allen TC, Zander DS, Cagle PT. Frozen section of lung specimens. Arch Pathol Lab Med 129, 1602–1609 (2005). [DOI] [PubMed] [Google Scholar]
- 10.Nagasue N, Akamizu H, Yukaya H, Yuuki I. Hepatocellular pseudotumor in the cirrhotic liver. Report of three cases. Cancer 54, 2487–2494 (1984). DOI: 10.1002/1097-0142(19841201)54:11,2487::AID-CNCR2820541129.3.0.CO;2-M. [DOI] [PubMed] [Google Scholar]
- 11.Weinberg E, Cox C, Dupont E, White L, Ebert M, Greenberg H, Diaz N, Vercel V, Centeno B, Cantor A, Nicosia S. Local Recurrence in lumpectomy patients after imprints cytology margin evaluation. Am J Surg 188, 349–354 (2004). DOI: 10.1016/j.amjsurg.2004.06.024. [DOI] [PubMed] [Google Scholar]
- 12.Valdes EK, Bollbol SK, Cohen JM, Feldman SM. Intra-operative touch preparation cytology; does it have a role in re-excision lumpectomy? Ann Surg Oncol 14, 1045–1050 (2007). DOI: 10.1245/s10434-006-9263-x. [DOI] [PubMed] [Google Scholar]
- 13.Goldfeder S, Davis D, Cullinan J. Breast specimen radiography: can it predict margin status of excised breast carcinoma? Acad Radiol 187, 339–344 (2006). DOI: 10.1016/j.acra.2006.08.017. [DOI] [PubMed] [Google Scholar]
- 14.Swanson GP, Rynearson K, Symmonds R. Significance of margins of excision on breast cancer recurrence. Am J Clin Oncol Cancer 25, 438–441 (2002). [DOI] [PubMed] [Google Scholar]
- 15.Gonzalez-Angulo AM, Morales-Vasquez F, Hortobagyi GN. Overview of resistance to systemic therapy in patients with breast cancer. Adv Exp Med Biol 608, 1–22 (2007). [DOI] [PubMed] [Google Scholar]
- 16.Papa MZ, Zippel D, Koller M, Klein E, Chetrit A, Ari GB. Positive margins of breast biopsy: is reexcision always necessary? J Surg Oncol 70, 167–171 (1999). DOI: 10.1002/(SICI)1096-9098-(199903)70:3<167::AID-JSO4>3.0.CO;2-7. [DOI] [PubMed] [Google Scholar]
- 17.Willner J, Kiricuta IC, Kölbl O. Locoregional recurrence of breast cancer following mastectomy: always a fatal event? Results of univariate and multivariate analysis. Int J Radiat Oncol 37, 853–863 (1997). [DOI] [PubMed] [Google Scholar]
- 18.Cabioglu N, Hunt KK, Sahin AA, Kuerer HM, Babiera GV, Singletary SE, Whitman GJ, Ross MI, Ames FC, Feig BW, Buchholz TA, Meric-Bernstam F. Role for intraoperative margin assessment in patients undergoing breast-conserving surgery. Ann Surg Oncol 14, 1458–1471 (2007). DOI: 10.1245/s10434-006-9236-0. [DOI] [PubMed] [Google Scholar]
- 19.Fleming FJ, Hill ADK, McDermott EW, O’Doherty A, O’Higgins NJ, Quinn CM. Intraoperative margin assessment and re-excision rate in breast conserving surgery. Eur J Surg Oncol 30, 233–237 (2004). DOI: 10.1016/j.ejso.2003.11.008. [DOI] [PubMed] [Google Scholar]
- 20.Gareau DS, Patel YG, Li Y, Aranda I, Halpern AC, Nehal KS, Radjadhyaksha M. Confocal mosaicing microscopy in skin excisions: a demonstration of rapid surgical pathology. J Microsc 233, 149–159 (2009). DOI: 10.1111/j.1365-2818.2008.03105.x. [DOI] [PMC free article] [PubMed] [Google Scholar]
- 21.Masters BR, So PTC. Confocal microscopy and multi-photon excitation microscopy of human skin in vivo. Opt Express 8, 2–10 (2001). DOI: 10.1364/OE.8.000002. [DOI] [PubMed] [Google Scholar]
- 22.Huang D, Swanson EA, Lin CP, Schuman JS, Stinson WG, Chang W, Hee MR, Flotte T, Gregory K, Puliafito CA. Optical coherence tomography. Science 254, 1178–1181 (1991). DOI: 10.1126/science.1957169. [DOI] [PMC free article] [PubMed] [Google Scholar]
- 23.Dubois A, Boccara AC. Full-field Optical Coherence Microscopy. In: Drexler W, Fujimoto GJ. (Eds.) Optical Coherence Tomography: Technology and Applications. New York-Basel: Springer, 565–591 (2008). DOI: 10.1007/978-3-540-77550-8. [Google Scholar]
- 24.Dubois A, Boccara AC. Full-field OCT. Med Sci (Paris) 22, 859–64 (2006). [DOI] [PubMed] [Google Scholar]
- 25.Pawley JB. (Ed.). Handbook of Biological Confocal Microscopy. 3rd Edition. Berlin: Springer; (2006). [Google Scholar]
- 26.Zhou C, Cohen DW, Wang Y, Lee HC, Mondelblatt AE, Tsai TH, Aguirre AD, Fujimoto JG, Connolly JL. Integrated optical coherence tomography and microscopy for ex vivo multiscale evaluation of human breast tissues. Cancer Res 70, 10071–10079 (2010). DOI: 10.1158/0008-5472.CAN-10-2968. [DOI] [PMC free article] [PubMed] [Google Scholar]
- 27.Swanson EA, Izatt JA, Hee MR, Huang D, Lin CP, Schuman JS, Puliafito CA, Fujimoto JG. In vivo retinal imaging by optical coherence tomography. Opt Lett 18, 1864–1866 (1993). DOI: 10.1364/OL.18.001864. [DOI] [PubMed] [Google Scholar]
- 28.Grieve K, Paques M, Dubois A, Sahel J, Boccara C, Le Gargasson JF. Ocular tissue imaging using ultrahigh-resolution, full-field optical coherence tomography. Invest Ophthalmol Vis Sci 45, 4126–4131 (2004). DOI:10.1167/iovs.04-0584. [DOI] [PubMed] [Google Scholar]
- 29.Drexler W, Morgner U, Ghanta RK, Kärtner FX, Schuman JS, Fujimoto JG. Ultrahigh-resolution ophthalmic optical coherence tomography. Nat Med 7, 502–507 (2001). DOI: 10.1038/87993. [DOI] [PMC free article] [PubMed] [Google Scholar]
- 30.Betz CS, Stepp H, Havel M, Jerjes W, Upile T, Hopper C, Sroka R, Leunig A. A set of optical techniques for improving the diagnosis of early upper aerodigestive tract cancer. Med Las Appl 23, 175–185 (2008). DOI: 10.1016/j.mla.2008.07.003. [Google Scholar]
- 31.Ozawa N, Sumi Y, Shimozato K, Chong C, Kurabayashi T. In vivo imaging of human labial glands using advanced optical coherence tomography. Oral Surg Oral Med O 108, 425–429 (2009). DOI: 10.1016/j.tripleo.2009.05.035. [DOI] [PubMed] [Google Scholar]
- 32.Chen Y, Aguirre AD, Hsiung PL, Desai S, Herz PR, Pedrosa M, Huang Q, Figueiredo M, Huang SW, Koski A, Schmitt JM, Fujimoto JG, Mashimo H. Ultrahigh-resolution optical coherence tomography of Barrett’s esophagus: preliminary descriptive clinical study correlating images with histology. Endoscopy 39, 599–605 (2007). DOI: 10.1055/s-2007-966648. [DOI] [PubMed] [Google Scholar]
- 33.Jerjes W, Upile T, Conn B, Betz CS, Abbas S, Jay A, Jamil W, Vourvachis M, Radhi R, El Maaytah M, Hopper C. Oral leukoplakia and erythroplakia subjected to optical coherence tomography: preliminary results. Brit J Oral Max Surg 46, e7 (2008). DOI: 10.1016/j.bjoms.2008.07.108. [Google Scholar]
- 34.Tearney GJ, Brezinski ME, Southern JF, Bouma BE, Boppart SA, Fujimoto JG. Optical biopsy in human pancreatobiliary tissue using optical coherence tomography. Dig Dis Sci 43, 1193–1199 (1998). DOI: 10.1023/A:1018891304453. [DOI] [PubMed] [Google Scholar]
- 35.Cobb MJ, Hwang JH, Upton MP, Chen Y, Oelschlager BK, Wood DE, Kimney MB, Li X. Imaging of subsquamous Barrett’s epithelium with ultrahigh-resolution optical coherence tomography: a histologic correlation study. Gastrointestinal Endosc 71, 223–230 (2010). DOI: 10.1016/j.gie.2009.07.005. [DOI] [PMC free article] [PubMed] [Google Scholar]
- 36.Boppart SA, Luo W, Marks DL, Singletary KW. Optical coherence tomography: feasibility for basic research and image-guided surgery of breast cancer. Breast Cancer Res Treat 84, 85–97 (2004). DOI: 10.1023/B:BREA.0000018401.13609.54. [DOI] [PubMed] [Google Scholar]
- 37.Adie SG, Boppart SA. Optical coherence tomography for cancer detection. In: Rosenthal E, Zinn KR. (Eds.) Optical Imaging of Cancer Clinical Applications. New York: Springer, 209–250 (2009). [Google Scholar]
- 38.Hsiung PL, Phatak DR, Chen Y, Aguirre AD, Fujimoto JG, Connolly JL. Benign and malignant lesions in the human breast depicted with ultrahigh resolution and three-dimensional optical coherence tomography. Radiology 244, 865–874 (2007). DOI: 10.1148/radiol.2443061536. [DOI] [PubMed] [Google Scholar]
- 39.Nguyen FT, Zysk AM, Chaney EJ, Kotynek JG, Oliphant UJ, Bellafiore FJ, Rowland KM, Johnson PA, Boppart SA. Intraoperative evaluation of breast tumor margins with optical coherence tomography. Cancer Res 69, 8790–8796 (2009). DOI: 10.1158/0008-5472.CAN-08-4340. [DOI] [PMC free article] [PubMed] [Google Scholar]
- 40.Zysk AM, Boppart SA. Computational methods for analysis of human breast tumor tissue in optical coherence tomography images. J Biomed Opt 11, 1–7 (2006). DOI: 10.1117/1.2358964. [DOI] [PubMed] [Google Scholar]
- 41.Luo W, Nguyen FT, Zysk AM, Ralston TS, Brockenbrough J, Marks DL, Oldenburg AL, Boppart SA. Optical biopsy of lymph node morphology using optical coherence tomography. Tech Canc Res Treat 4, 539–548 (2005). [DOI] [PubMed] [Google Scholar]
- 42.McLaughlin RA, Scolaro L, Robbins P, Hamza S, Saunders C, Sampson DD. Imaging of human lymph nodes using optical coherence tomography: potential for staging cancer. Cancer Res 70, 2579–2584 (2010). DOI: 10.1158/0008-5472.CAN-09-4062. [DOI] [PubMed] [Google Scholar]
- 43.McLaughlin RA, Quirk BC, Curatolo A, Kirk RW, Scolaro L, Lorenser D, Robbins PD, Wood BA, Saunders CM, Sampson DD. Imaging of breast cancer with optical coherence tomography needle probes: feasibility and initial results. IEEE Sel Topics Quantum Electron 18, 1184–1191 (2012). DOI: 10.1109/JSTQE.2011.2166757. [Google Scholar]
- 44.Feldichtein FI, Gelikonov VM, Gelikonov GV. Design of OCT scanners. In: Bouma BE, Tearney GJ. (Eds.). Handbook of Optical Coherence Tomography. New York-Basel: Marcel Dekker Inc., 125–142 (2002). [Google Scholar]
- 45.Heikal A, Webb W. One- and two-photon time resolved fluorescence spectroscopy of selected fluorescent markers: photobleaching, triplet-, and singlet-state dynamics. Biophys J 76, 260a (1999). [Google Scholar]
- 46.Jain M, Shukla N, Manzoor M, Nadolny S, Mukherjee S. Modified full-field optical coherence tomography: a novel tool for histology of tissues. J Pathol Inform 2, 28–36 (2011). DOI: 10.4103/2153-3539.82053. [DOI] [PMC free article] [PubMed] [Google Scholar]
- 47.Dalimier E, Salomon D. Full-field optical coherence tomography: a new technology for 3D high-resolution skin imaging. Dermatology 224, 84–92 (2012). DOI: 10.1159/000337423. [DOI] [PubMed] [Google Scholar]
- 48.Dubois A, Moneron G, Grieve K, Boccara AC. Three-dimensional cellular level imaging using full-field optical coherence tomography. Phys Med Biol 49, 1227–1234 (2004). DOI: 10.1088/0031-9155/49/7/010. [DOI] [PubMed] [Google Scholar]
- 49.Dubois A, Grieve K, Moneron G, Lecaque R, Vabre L, Boccara AC. Ultra high resolution full-field optical coherence tomography. Appl Opt 43, 2874–2883 (2004). DOI: 10.1364/AO.43.002874. [DOI] [PubMed] [Google Scholar]
- 50.Binding J, Arous J Ben, Léger JF, Gigan S, Boccara AC, Bourdieu L. Brain refractive index measured in vivo with high-NA defocus-corrected full-field OCT and consequences for two-photon microscopy. Opt Express 19, 4833–4847 (2011). DOI: 10.1364/OE.19.004833. [DOI] [PubMed] [Google Scholar]
- 51.Dubois A, Vabre L, Boccara AC, Beaurepaire E. High-resolution full-field optical coherence tomography with a Linnik microscope. Appl Optics 41, 805–812 (2002). DOI: 10.1364/AO.41.000805. [DOI] [PubMed] [Google Scholar]
- 52.Beck J, Murray J, Willows AO Dennis, Cooper MS. Computer assisted visualizations of neural networks: expanding the field of view using seamless confocal montaging. J Neurosci Meth 98, 155–163 (2000). DOI: 10.1016/S0165-0270(00)00200-4. [DOI] [PubMed] [Google Scholar]
- 53.Preibisch S, Saalfeld S, Tomancak P. Globally optimal stitching of tiled 3D microscopic image acquisitions. Bioinformatics 25, 1463–1465 (2009). DOI: 10.1093/bioinformatics/btp184. [DOI] [PMC free article] [PubMed] [Google Scholar]
- 54.Latrive A, Boccara AC. In vivo and in situ cellular imaging full-field optical coherence tomography with a rigid endoscopic probe. Biomed Opt Express 2, 2897–2904 (2011). DOI: 10.1364/BOE.2.002897. [DOI] [PMC free article] [PubMed] [Google Scholar]