

Abstract
MicroRNAs (miRNAs) are small (19–23nt), highly conserved noncoding RNAs that posttranscriptionally regulate target gene expression. Altered expression of miRNAs has been demonstrated in many different human diseases, including cancer. The large archives of formalin-fixed, paraffin-embedded (FFPE) tissue specimens with clinical follow-up information that exist are a highly valuable source of tissue to study human diseases. However, RNA in the FFPE tissue is fragmented and may be chemically modified. In this study, we prepared miRNA preserving total RNA from matched pairs of FFPE and respective fresh-frozen clinical samples, and used that in microarray experiments to compare miRNA expression profiles between FFPE and fresh-frozen tissue from the same tissue samples. We demonstrate that miRNA expression profile from FFPE tissues closely resembles that from fresh tissues. These results underscore the suitability of FFPE tissues as appropriate resources for miRNA expression analyses.
Keywords: MicroRNA, Formalin-fixed paraffin-embedded (FFPE), Microarray profiling, qPCR
1. Introduction
Formalin-fixed paraffin-embedded (FFPE) is the most common method of collection and storage of surgical specimens; these archived tissues are of significant value to retrospective studies of human diseases since they may have in-depth clinical follow-up information. The ability to isolate nucleic acid that is suitable for molecular analysis from these archived tissue samples provides a powerful tool to reveal the mechanism of disease at both the genomic and gene expression level (1). Historically, the nucleic acids isolated from FFPE tissues are typically fragmented and chemically modified to a degree that renders it incompatible with most molecular analysis. Recently, it was found that fragmentation of FFPE RNA seems to have a size endpoint of around 80nt, and modifications affect only about 1% of the nucleotides. Since miRNAs are small (19–23nt), they are less affected by the fixation/embedding process (2, 3). With miRNAs recently taking center stage as a key regulator of mRNA and protein expression (4, 5), many endeavors were made to profile miRNA from FFPE tissues (6, 7). Several miRNA isolation kits for FFPE tissues are commercially available (8, 9), and there are a number of platforms that are commercially available for miRNAs profiling (8, 10, 11).
2. Materials
Tissues: FFPE tissues were sectioned at 20 μm using a fresh microtome blade for each block, four thick sections were used for RNA isolation. We found that it is very helpful to macro-dissect the thick sections using a razor blade to trim off excessive surround tissue, which may help reduce signals from contaminating tissue.
-
RecoverALL total nucleic acid isolation kit (Ambion, Austin, Texas): This kit contains reagents for 40 isolations of total RNA from paraffin-embedded tissue.
Amount Component Storage 16 mL Digestion buffer Room temperature 60 mL Wash 1 concentrate
Add 42 mL 100% ethanol before useRoom temperature 60 mL Wash 2/3 concentrate
Add 48 mL 100% ethanol before useRoom temperature 80 Collection tubes Room temperature 40 Filter cartridges Room temperature 19.2 mL Isolation additive Room temperature 5 mL Elution Solution Room temperature 160 μL Protease −20°C 240 μL 10× DNase buffer −20°C 160 μL DNase −20°C 400 μL RNase A −20°C 100% xylene, ACS grade or higher quality.
100% ethanol for molecular biology.
Microtome for tissue sectioning.
Nuclease-free 1.5 mL microcentrifuge tubes.
Adjustable pipettors and RNase-free tips.
Microcentrifuge capable of at least 10,000 × g.
Incubators or heat blocks (deep well preferred) set at 50 and 85%C.
1(Optional) Nonstick tubes for long-term storage of recovered nucleic acid.
1(Optional) Centrifugal vacuum concentrator (e.g., SpeedVac) for drying deparaffinized tissue samples.
Spectrophotometer, such as the NanoDrop 1000 Spectrophotometer.
Agilent 2100 bioanalyzer or reagents and apparatus for preparation and electrophoresis of agarose gels.
3. Methods
miRNA containing total RNA Isolation.
3.1. Deparaffinization
Cut 20 mm sections from FFPE tissue blocks using a microtome.
Place the equivalent of ≤80 mm of tissue slices (i.e., a maximum of 4 × 20 μm) in a 1.5 mL microcentrifuge tube (see Note 1).
Add 1 mL of 100% xylene to the sample (see Note 2).
Vortex briefly to mix and centrifuge briefly to bring down the tissue.
Heat the sample for 3 min at 50%C to melt the paraffin.
Centrifuge the sample for 2 min at room temperature at a maximum speed to pellet the tissue.
-
Remove the xylene without disturbing the pellet. Discard the xylene.
If the pellet is loose, leave some xylene in the tube to avoid removing any tissue pieces.
Add 1 mL of RT 100% ethanol to the sample and vortex to mix.
Centrifuge the sample for 2 min at a maximum speed to pellet tissue.
Remove and discard the ethanol without disturbing the pellet. The ethanol will contain traceamounts of xylene and must be discarded accordingly (see Note 3).
Repeat steps 7–10 above to wash second time with 1 mL of 100% ethanol.
Briefly centrifuge again to collect any remaining drops of ethanol in the bottom of the tube. Remove as much residual ethanol as possible without disturbing the pellet.
Air dry the pellet 15–30 min to remove residual ethanol.
3.2. Protease Digestion
Add 400 μL digestion buffer to each sample.
Add 4 μL protease to each sample.
Swirl the tube gently to mix and to immerse the tissue. If tissue sticks to the sides of the tube, use a pipette tip to push it into the solution.
-
Incubate the sample in a heat block or water bath for 3 h at 50%C (see Note 4).
Most samples will clarify within 3 h. If the sample mixture does not clarify after 3 h, avoid removing undigested tissue pieces when applying to the filter cartridge.
Stopping Point
Samples can be stored at −20%C, then thawed on ice before proceeding to total RNA isolation.
3.3 Total RNA Isolation
Add 480 μL isolation additive to each sample.
Vortex to mix. The solution should appear white and cloudy after vortexing.
Add 1.1 mL 100% ethanol to each sample.
-
Mix by pipetting up and down.
The solution should become clear at this point.
For each sample, place a filter cartridge in one of the collection tubes supplied.
-
Pipet 700 μL of the sample/ethanol mixture (from step 3) onto the filter cartridge and close the lid.
To prevent clogging of the filter, avoid pipetting large pieces of undigested tissue onto the filter cartridge.
Centrifuge at 10,000 × g for 30 s to pass the mixture through the filter (see Note 5).
Discard the flow-through, and re-insert the filter cartridge in the same .
Repeat steps 6–8 until all the sample mixture has passed through the filter.
Add 700 μL of Wash 1 to the filter cartridge.
Centrifuge for 30 s at 10,000 × g to pass the mixture through the filter.
Discard the flow-through, and re-insert the filter cartridge in the same collection tube.
Add 500 μL of Wash 2/3 to the filter cartridge.
Centrifuge for 30 s at 10,000 × g to pass the mixture through the filter.
Discard the flow-through, and re-insert the filter cartridge in the same collection tube.
Spin the assembly for an additional 30 s to remove residual fluid from the filter.
3.4 DNase Digestion and Final RNA Purification
Preheat Elution Solution or nuclease-free water to 95°C in a heat block before you start this step.
-
Combine the following solutions to make the DNase mix (a master DNase mix can be used if there is more than one sample).
Amount (per reaction) (μL) Component 6 10× DNase buffer 4 DNase 50 Nuclease-free water Add 60 mL of the DNase mix to the center of each filter cartridge.
Cap the tube and incubate for 30 min at room temperature (22–25°C).
Add 700 μL of Wash 1 to the filter cartridge.
Incubate for 30–60 s at RT.
Centrifuge for 30 s at 10,000 × g.
Discard the flow-through and re-insert the filter cartridge in the same collection tube.
Add 500 μL of Wash 2/3 to the filter cartridge.
Centrifuge for 30 s at 10,000 × g.
Discard the flow-through and re-insert the filter cartridge in the same collection tube.
Repeat steps 8–10 to wash second time with 500 μL of Wash 2/3.
Centrifuge the assembly for 1 min at 10,000 × g to remove residual fluid from the filter.
Transfer the filter cartridge to a fresh collection tube.
Apply 30 μL of Elution Solution or nuclease-free water, preheated to 95°C, to the center of the filter, and close the cap (see Note 6).
Allow the sample to sit at room temperature for 1 min.
Centrifuge for 1 min at a maximum speed to pass the mixture through the filter.
Repeat steps 14–16 with a second 30 μL eluant to the same collection tube. The final volume should be close to 60 μL.
Store the nucleic acid at −20°C or colder (see Note 7).
3.5. (Optional) Further Purify the Recovered RNA
Ethanol precipitation can further purify the recovered RNA if needed.
Add ammonium acetate to a final concentration of 2–2.5 M and mix well.
Add 4 volumes of ethanol and mix again.
Chill at −20°C or lower from 12 h to overnight.
Centrifuge at 16,000 × g for 20–30 min to pellet the RNA.
Wash the pellet twice with 80% ethanol.
Resuspend the RNA in nuclease-free water or TE (10 mM Tris–HCl, pH 8, 1 mM EDTA).
3.6. Assessing RNA Yield and Integrity
The expected RNA yield varies greatly depending on the amount of tissue used, the tissue type, and the method used for fixing and storing the sample.
3.6.1. RNA Yield
-
1. Spectrophotometry
The concentration of an RNA solution can be determined by measuring its absorbance at 260 nm. We recommend using the NanoDrop 1000 Spectrophotometer because it is very quick and easy to use by measuring 1.5 μL of the RNA sample directly.
Alternatively, the RNA concentration can be determined by diluting an aliquot of the preparation in TE (10 mM Tris–HCl, pH 8, 1 mM EDTA) and reading the absorbance in a traditional spectrophotometer at 260 nm. Calculate the RNA concentration (μg/mL) as follows:
A260 × dilution factor × 40 μg/mL = μg RNA/mL.
-
2. Fluorometry
If a fluorometer or a fluorescence microplate reader is available, Molecular Probe’s RiboGreen fluorescence-based assay for RNA quantitation is a convenient and sensitive way to measure RNA concentration.
3.6.2. RNA Quality
-
1. Spectrophotometry
The A260/A280 ratio and A260/A230 of the RNA are indications of its purity. A260/A280 should be ≥1.8−2.1 and A260/A230 should be ≥1.8 (see Note 8).
-
2. Agarose gel electrophoresis
RNA recovered from FFPE tissues will typically appear smeared. In higher quality preparations, two broad bands representing 18S and 28S rRNA will be visible but most likely only a smear will be seen in most cases.
-
3. Microfluidics analysis
Agilent’s 2100 bioanalyzer used in conjunction with an RNA LabChip kit provides a powerful and sensitive method to assess RNA integrity. The data will mimic that seen on agarose gels. An example result is shown in Fig. 1.
Fig. 1.
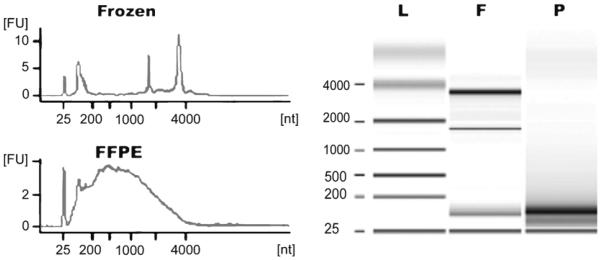
Representative total RNA integrity analysis using Agilent 2100 bioanalyzer. Left upper panel: fresh-frozen human melanoma tissue; Left lower panel: matched FFPE tissue; Right panel: an agarose gel-like mimic. L ladder, F frozen tissue, P FFPE tissue.
3.7. miRNA Profiling Platforms
-
1. miRNA microarray
There are a number of miRNA microarray platforms commercially available:
miRCURY LNA™ microRNA Array from Exiqon (7); Agilent miRNA array platform (11); NCode™ miRNA Arrays from Invitrogen; Illumina miRNA expression panel and Affymetrix miRNA arrays. The amount of input RNA required is different when using these platforms. An example of our miRNA microarry results using miRCURY LNA™ microRNA Array from Exiqon is shown in Fig. 2.
Fig. 2.

Pairwise Pearson’s correlations of miRNA expression between FFPE samples and matched fresh frozen. RNA from fresh frozen and matched FFPE tissues was profiled using a commercially available microarray platform. Mean miRNA intensity correlation between FFPE samples (indicated by P1, P2, P3, P4, P5) and fresh-frozen tissue samples (indicated by F1, F2, F3, F4, F5) is shown in the figure.
-
2. miRNA real-time PCR
The PCR Array performs miRNA expression analysis with real-time RT-PCR sensitivity and the multisequence profiling capabilities of a microarray. TaqMan MicroRNA Arrays v2.0 and Megaplex™ Primer Pools from ABI enable a comprehensive miRNA expression profiling and its individual TaqMan® MicroRNA Assays provide the ideal tool for further confirmation and validation for miRNA profiling; The miRNA PCR Arrays from SABiosciences is a set of optimized real-time PCR assays, in 96-well or 384-well plates, for a miRNA panel as well as appropriate housekeeping assays and RNA quality controls.
Acknowledgment
This work is supported by Specialized Program of Research Excellence (SPORE) on Skin Cancer (CA-093372).
Footnotes
4. Notes
Overloading the tissue >80 mm will result in lower RNA yield and poor quality from incomplete protease digestion.
Using slices that are ≥10 mm thickness and minimizing time in the xylene and ethanol washes will minimize the loss of miRNA.
Xylene is a toxic substance, handle it only in a well ventilated area using personal protection equipment. Dispose xylene waste according to applicable regulations.
Extending the incubation at 70°C for additional 15 min after 3 h at 50°C helps to release longer mRNA form.
Do not centrifuge filter cartridges at relative centrifugal forces greater than 10,000 × g to avoid damaging the filters.
The Elution Solution from the kit contains salts which may affect downstream applications if concentrated. If you intend to vacuum dry the sample, elute in nuclease-free water instead.
If a very small amount of RNA was recovered or to store your RNA sample for an extended period of time, transfer the eluate to a nonstick tube (e.g., P/N 12450) to prevent the loss of RNA.
Contaminating genomic DNA in the recovered RNA can be removed by further digestion of DNase.
References
- 1.Cronin M, Pho M, Dutta D, Stephans JC, Shak S, Kiefer MC, et al. Measurement of gene expression in archival paraffin-embedded tissues: development and performance of a 92-gene reverse transcriptase-polymerase chain reaction assay. Am. J. Pathol. 2004;164:35–42. doi: 10.1016/S0002-9440(10)63093-3. [DOI] [PMC free article] [PubMed] [Google Scholar]
- 2.Xi Y, Nakajima G, Gavin E, Morris CG, Kudo K, Hayashi K, Ju J. Systematic analysis of microRNA expression of RNA extracted from fresh frozen and formalinfixed paraffin-embedded samples. RNA. 2007;13:1668–74. doi: 10.1261/rna.642907. Epub 2007 Aug 13. [DOI] [PMC free article] [PubMed] [Google Scholar]
- 3.Li J, Smyth P, Flavin R, Cahill S, Denning K, Aherne S, et al. Comparison of miRNA expression patterns using total RNA extracted from matched samples of formalinfixed paraffin-embedded (FFPE) cells and snap frozen cells. BMC Biotechnol. 2007;7:36. doi: 10.1186/1472-6750-7-36. [DOI] [PMC free article] [PubMed] [Google Scholar]
- 4.Calin GA, Croce CM. MicroRNA signatures in human cancers. Nat. Rev. Cancer. 2006;6:857–866. doi: 10.1038/nrc1997. [DOI] [PubMed] [Google Scholar]
- 5.Lu J, Getz G, Miska EA, Alvarez-Saavedra E, Lamb J, Peck D, et al. MicroRNA expression profiles classify human cancers. Nature. 2005;435:834–838. doi: 10.1038/nature03702. [DOI] [PubMed] [Google Scholar]
- 6.Nelson PT, Baldwin DA, Scearce LM, Oberholtzer JC, Tobias JW, Mourelatos Z. Microarray-based, high-throughput gene expression profiling of microRNAs. Nat. Methods. 2004;1:155–161. doi: 10.1038/nmeth717. [DOI] [PubMed] [Google Scholar]
- 7.Liu A, Tetzlaff M, VanBelle P, Elder D, Feldman M, Tobias J, et al. MicroRNA expression profiling outperforms mRNA expression profiling in formalin-fixed paraffin-embedded tissues. Int. J. Clin. Exp. Pathol. 2009;2:519–527. [PMC free article] [PubMed] [Google Scholar]
- 8.Tetzlaff MT, Liu A, Xu X, Master SR, Baldwin DA, Tobias JW, et al. Differential expression of miRNAs in papillary thyroid carcinoma compared to multinodular goiter using formalin fixed paraffin embedded tissues. Endocr. Pathol. 2007;18:163–173. doi: 10.1007/s12022-007-0023-7. [DOI] [PubMed] [Google Scholar]
- 9.Siebolts U, Varnholt H, Drebber U, Dienes H-P, Wickenhauser C, Odenthal M. Tissues from routine pathology archives are suitable for microRNA analyses by quantitative PCR. J. Clin. Pathol. 2009;62:84–88. doi: 10.1136/jcp.2008.058339. [DOI] [PMC free article] [PubMed] [Google Scholar]
- 10.Doleshal M, Magotra AA, Choudhury B, Cannon BD, Labourier E, Szafranska AE. Evaluation and validation of total RNA extraction methods for microRNA expression analyses in formalin-fixed, paraffinembedded tissues. J. Mol. Diagn. 2008;10:203–211. doi: 10.2353/jmoldx.2008.070153. [DOI] [PMC free article] [PubMed] [Google Scholar]
- 11.Zhang X, Chen J, Radcliffe T, LeBrun DP, Tron VA, Feilotter H. An array-based analysis of microRNA expression comparing matched frozen and formalin-fixed paraffin-embedded human tissue samples. J. Mol. Diagn. 2008;10:513–519. doi: 10.2353/jmoldx.2008.080077. [DOI] [PMC free article] [PubMed] [Google Scholar]