

Abstract
A wirelessly powered homecage system, called the EnerCage-HC, that is equipped with multicoil wireless power transfer, closed-loop power control, optical behavioral tracking, and a graphic user interface is presented for longitudinal electrophysiology and behavioral neuroscience experiments. The EnerCage-HC system can wirelessly power a mobile unit attached to a small animal subject and also track its behavior in real-time as it is housed inside a standard homecage. The EnerCage-HC system is equipped with one central and four overlapping slanted wire-wound coils with optimal geometries to form three- and four-coil power transmission links while operating at 13.56 MHz. Utilizing multicoil links increases the power transfer efficiency (PTE) compared with conventional two-coil links and also reduces the number of power amplifiers to only one, which significantly reduces the system complexity, cost, and heat dissipation. A Microsoft Kinect installed 90 cm above the homecage localizes the animal position and orientation with 1.6-cm accuracy. Moreover, a power management ASIC, including a high efficiency active rectifier and automatic coil resonance tuning, was fabricated in a 0.35-μm 4M2P standard CMOS process for the mobile unit. The EnerCage-HC achieves a max/min PTE of 36.3%/16.1% at the nominal height of 7 cm. In vivo experiments were conducted on freely behaving rats by continuously delivering 24 mW to the mobile unit for >7 h inside a standard homecage.
Index Terms: Closed-loop inductive power transmission, automatic tracking, implantable medical devices, radio-frequency identification (RFID), homecage, EnerCage, Kinect
I. Introduction
Behavioral neuroscience research on small awake animal subjects, such as rodents, has benefited from recent advances in neural interfacing technology. Neural interfaces have been traditionally hardwired to deliver power and communicate with neural recording or stimulation instruments attached to the animal body (we will refer to them as the mobile units), thereby restricting experiments that involve freely behaving animal subjects [1], [2]. These studies also require labor-intensive human operator involvement to ensure continuous and smooth flow of the experiments, which imposes a barrier to conducting long-term experiments over the span of several days, weeks, or months. In an attempt to overcome the limitations imposed by cables, several battery-powered neural recording systems have been developed [3]–[9]. Although these setups can eliminate the cables from the mobile unit, they are still not suitable for longitudinal studies due to the limited lifetime of the batteries, which also add to the animal payload. Researchers have to make compromises between the duration of the experiment and how much weight the animal can carry before it affects its natural behavior and bias the results.
In order to address these limitations, a few wirelessly-powered systems have been developed to either directly power the mobile unit or recharge the batteries during the experiment [10]–[15]. However, these systems suffered from poor power transfer efficiency (PTE) because the coil geometries were not optimized. Moreover, they continuously powered the entire homecage, as opposed to where the animal was located, reducing the flux linkage between the transmitter (Tx) and receiver (Rx) coils, resulting in lower coupling coefficient and transmission of more power for delivering sufficient power to the mobile unit. In an attempt to circumvent these problems, smart wirelessly-powered systems have been reported, which can significantly improve the PTE [16]–[22]. In these systems, batteries on the mobile units have been eliminated or replaced by smaller super capacitors, and an array of coils at the bottom of the experimental arena that are automatically selected based on the position of the animal subject to couple with the Rx coil in the mobile unit. As a result, the new systems can achieve higher PTE and dissipate less heat for the same amount of power received at the mobile unit. As an alternative, a single Tx coil mechanically moving on XY-rails was also reported in [23]. Although these systems can achieve high PTE and operate at low temperature, they are too bulky to be integrated with the standard homecage (HC) in a way that high throughput experiments can run in parallel over extended periods of time inside the animal research facilities without occupying the lab space and limited human resources of research laboratories. Moreover, the animal tracking resolution and quality in the earlier work were not sufficient for behavioral experiments.
Tracking animal subjects to analyze the locomotion has been separately studied on different animal species including rodents [24]–[28]. Automated locomotion measurement using computer vision can improve accuracy and significantly lower the cost of labor, thus it is rapidly growing [29]–[33]. Microsoft Kinect® is a popular high-precision and low-cost imager that is equipped with infrared depth (IR-3D) and Red-Green-Blue (RGB-2D) cameras, allowing animal tracking in both bright and dark conditions. This is particularly important for nocturnal animal species, which include most rodents. Kinect® has been recently adopted in a few automated locomotion tracking experiments [34], [35]. However, only the depth camera has been previously used for tracking the subject’s position in real time.
In this paper, we present a wirelessly-powered smart homecage, called the EnerCage-HC, which is conceptually shown in Fig. 1, and includes: 1) a compact and geometrically-optimized array of wire-wound coils (WWCs) with one central WWC at the bottom of the cage and four overlapping slanted WWCs on the corners of the cage to form 3- or 4-coil links and generate a homogeneous high-PTE space inside the homecage (30 × 30 × 17 cm3) [36], thanks to, 2) a closed power control loop (CPCL) that can dynamically compensate for coupling distance and load variations due to animal movements and implant functions (e.g. stimulation on/off), respectively, 3) an automated real-time behavioral tracking mechanism based on 2D and 3D imaging with Microsoft Kinect®, and 4) a custom-designed coin-sized mobile unit that includes two Rx coils and an efficient power management integrated circuit (PMIC).
Fig. 1.
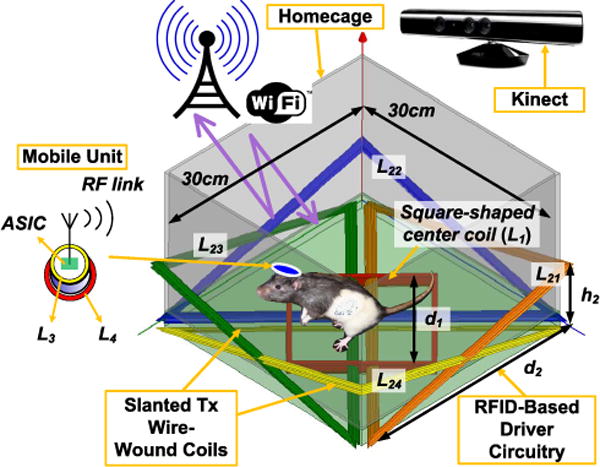
3D rendered view of the EnerCage-HC system with one square-shaped WWC at the bottom of the homecage and four overlapping slanted triangular WWCs on the corners. A custom ASIC receives power in the mobile unit and generates a stable supply for the sensing blocks and bidirectional RF data link. Animal position and orientation are tracked in real-time by a Microsoft Kinect.
The EnerCage-HC system has a different structure and serves a different purpose compared to our previously-reported EnerCage system in [19], in terms of using a set of slanted wired-wound coil structure instead of an array of overlapping printed spiral coils (PSC). It also benefits from reduced number of cables by using WiFi instead of Ethernet, a power management ASIC in the mobile unit for smaller size and higher efficiency, safety functions during in vivo experiments, and accurate animal subjects tracking features. Unlike the original EnerCage that was offering large wirelessly powered experimental arenas, the EnerCage-HC is intended for automated, high throughput, and long-term experiments in a large number of parallel cages that can be located in standard racks in animal research facilities without requiring labor intensive supervision or occupying precious laboratory space. In section II, the EnerCage-HC system architecture is introduced. The coil design and optimization are presented in section III. The optical tracking is discussed in section IV. The power management ASIC has been described in section V, followed by the in vivo measurement results in section VI and conclusions.
II. EnerCage-HC System Architecture
Fig. 1 shows a rendered view of the proposed EnerCage-HC system. The square-shaped center-WWC (L1) at the bottom of the cage can directly form a 3-coil power transmission links with two coils (L3, L4) that are embedded in the mobile unit when the subject is located in the center of the cage. All other WWCs (L21 ~ L24) are open-circuit. L1 can also form a 4-coil link with one of the triangular-shaped overlapping slanted WWCs (L21 ~ L24) when the subject is located near a corner of the homecage by shorting that particular WWC with a resonant capacitor to form a series high-Q LC-tank. The sizes of the central and triangular WWCs are d1 and d2, respectively, and the tips of the triangular WWCs are elevated by h2.
In this system, multi-coil resonance-based inductive link not only increases the PTE compared to similar sized 2-coil links but also reduces the required number of power amplifiers (PA) to only one, which in turn reduces the system complexity, cost, and dissipated heat. Hence, only L1 is driven by a class-C PA at fp = 13.56 MHz, and L21 ~ L24 simply form high-Q LC-tanks. The PA is driven by an RFID reader (TR7960, Texas Instruments, Dallas, TX). The CPCL changes the PA supply voltage (VDD_Tx) based on the information it receives about the mobile unit rectifier output voltage, VRECP in Fig. 2, which is back telemetered via load shift keying (LSK) by shorting the L4C4-tank [37]. In this prototype, in order to monitor the system operation, VRECP is also divided down, digitized, and wirelessly sent back to the central PC station by the mobile unit MCU and its built-in 2.4 GHz transceiver. This data is used for monitoring the mobile unit operation and ensuring the EnerCage-HC system functionality. The central PC station is also responsible for processing the Kinect images to detect and report the animal position in each EnerCage-HC in real time. This information is then used to switch L21 ~ L24.
Fig. 2.
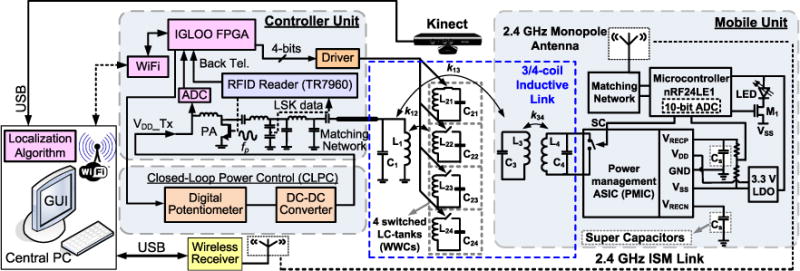
Block diagram of the EnerCage-HC system for automated, high throughput, and long-term awake animal experiments in a standard homecage. The controller unit has an FPGA to process the position data from the PC and activate the WWCs in a way that they form 3- and 4-coil power transfer links based on the animal position. The PA output power is dynamically controlled in a closed loop based on the received power at the mobile unit. All the acquired information and system operating status are wirelessly transmitted to the PC station. The mobile unit on the animal body receives power inductively, generates a stable supply voltage through a power management ASIC, and communicates with the RFID reader via load shift keying (LSK). An LED blinking at 50 Hz with 4% duty cycle helps with 2D/3D Kinect localization and indicates both the animal location and orientation (i.e., where it is heading) inside the homecage.
A. Stationary Unit
Fig. 2 shows a detailed block diagram of the prototype EnerCage-HC system. The stationary unit is composed of a coil array (L1, L21 ~ L24), a controller module, CPCL, a Microsoft Kinect® for optical tracking, and a central PC station with a graphical user interface (GUI). A field-programmable gate array (FPGA) receives the animal coordinates from the PC via a WiFi link, and use them to close- or open-circuit L21C21 ~ L24C24 tank circuits. The RFID reader not only drives the class-C PA, but also recovers the back telemetry (BT) data from the PMIC. The VDD_Tx is dynamically controlled by the CPCL from 4.5 V to 20 V in 256 steps based on the BT data to compensate for any coil coupling and loading variations [37]. In the EnerCage-HC system, 1-bit BT data is used to increase or decrease the VDD_Tx. The received BT pulses indicate that the received power in the mobile unit is sufficient, where the coupling between stationary and mobile unit is strong enough. The received BT pulses are oversampled by the FPGA to decrease the VDD_Tx at the rate of 320 steps/s by controlling a digital potentiometer (AD5160) in the feedback loop of the DC-DC converter (LT1370). In the absence of BT pulses, the FPGA increases the VDD_Tx at the same rate [37].
B. Mobile Unit
The mobile unit, shown on the right side of Fig. 2, is equipped with the PMIC, two super-capacitors, a 3.3 V low dropout regulator (LDO), an LED tracer, and an MCU (nRF24LE1, Nordic Semiconductor, Norway). The PMIC includes two active rectifiers to generate both positive VRECP and negative VRECN for bipolar stimulation [38], two LDOs to generate VDD = 2 V and VSS = 2 V, an automatic resonance tuning (ART) block, and LSK circuitry. An off-chip LDO is used to generate a separate 3.3 V supply voltage for the MCU. VRECP is divided by two and digitized by the MCU built-in 10-bit ADC. When VRECP is higher than 2.3V, the MCU sends narrow pulses to the PMIC at 3 kHz, which are sharpened (~0.4 μs) before shorting the L4C4-tank as briefly as possible to close the power control loop with minimal degradation of the PTE. The duty cycle of the BT short-circuit pulses is only 0.1% significantly minimize the power loss. The MCU also turns on/off transistor M1 at 50 Hz with 4% duty cycle to blink a green LED for optical tracking of the mobile unit. Two 0.21 F super capacitors, following VRECP and VRECN, supply the mobile unit when the received power is interrupted by >80° tilting of the mobile unit or >18 cm coupling distance from the bottom of the homecage. These thresholds are experimentally determined when the PTE has reached a low level that even the maximum PA power in the EnerCage-HC system (7 W) is not sufficient to provide enough power to the mobile unit.
C. Graphical User Interface
All acquired information, such as VRECP, VDD_Tx, and system operating status e.g. WiFi and MCU 2.4 GHz link connectivity, along with the Kinect images are collected by the central PC from each EnerCage-HC system to be used in the signal/image processing algorithm and the GUI. The subject coordinates are sent from the PC to the FPGA using the User Datagram Protocol (UDP), while two-way communication through TCP/IP is used for monitoring the VDD_Tx. The same link is used to reduce VDD_Tx to 4.5 V when no mobile unit is detected in the homecage. The GUI displays a real time color video of the homecage, position of the animal and mobile unit in the cage, the total distance that the animal has traveled, the processed depth image, the active WWC, the connection status, VRECP, and VDD_Tx. The GUI can also save the acquired data in text and movie formats.
III. Multi-Coil Link Optimization for EnerCage-HC
Fig. 3 shows how utilizing 3/4-coil links eliminates the need to drive the triangular WWCs, while increasing the PTE by decoupling the loosely-coupled L2-L3 link from the source and load impedances [39]. When the mobile unit is in the center of the homecage, only L1 is driven to form a 3-coil link, while the other WWCs are open-circuit. The PTE of a 3-coil link can be found from [40].
| (1) |
Fig. 3.
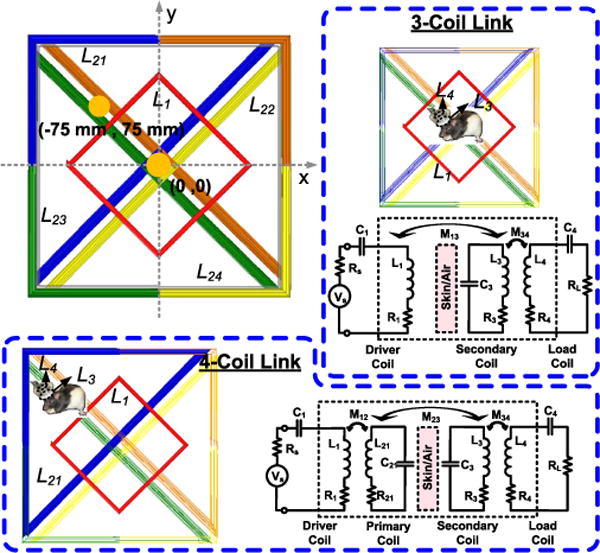
WWC switching to form 3- and 4-coil inductive links with the mobile unit while only driving L1 (inactive coils are light colored).
However, when the mobile unit is on the corners of the cage, the closest WWC (L21 ~ L24) is shorted with a capacitor, which resonates at 13.56 MHz with the Tx, to form a 4-coil link. In a 4-coil link, the PTE can be written as [40] (2) as shown at the bottom of this page.
The quantitative model and comprehensive circuit-based analysis describing the power transmission in 4-coil inductive links are described in [39] and [40]. The WWC geometries are optimized to provide homogeneous PTE in the worst case coil misalignments.
To reduce the size and weight of the mobile unit, which is carried in the headstage or a backpack, the diameter and width of L3, i.e. Do3 and W3, were limited to 2.5 cm and 0.64 mm, respectively, to be about the size of a U.S. quarter. Under the 300 Ω loading condition, which is corresponding to 24 mW of power consumption in the mobile unit, to maximize Q3 for L3, n3 = 2 was chosen based on the HFSS simulations. The 24 mW power was chosen in this prototype as a level that is sufficient for the majority of state-of-art neural recording and stimulation devices [7]. The CPCL dynamically controls the VDD_Tx to compensate for any load variations in the mobile unit. In order to embed the Tx coils inside the body of the homecage the width of the wire used in the Tx coils was limited to the thickness of the homecage. The AWG10 (W = 2.59 mm) wire was chosen for L1 and L21~L24 to achieve the highest Q. Fig. 4a shows the HFSS simulation results of Q1 and Q2 vs. fp for n1,2 =1 turn and 2 turns. In these simulations, L1 was square shaped with an estimated d1 = 19 cm, and L2 had an isosceles triangular shape with d2 = 30 cm and h2 = 7 cm (see Fig. 1). L1 has a square shape to increase its overlap area with L21–L24, which is directly proportional to their coupling coefficient. It is clear from these simulations that at fp = 13.56 MHz in the industrial-scientific-medical (ISM) band, n1 = n21–24 = 1 provides higher Q1 and Q2
| (2) |
Fig. 4.
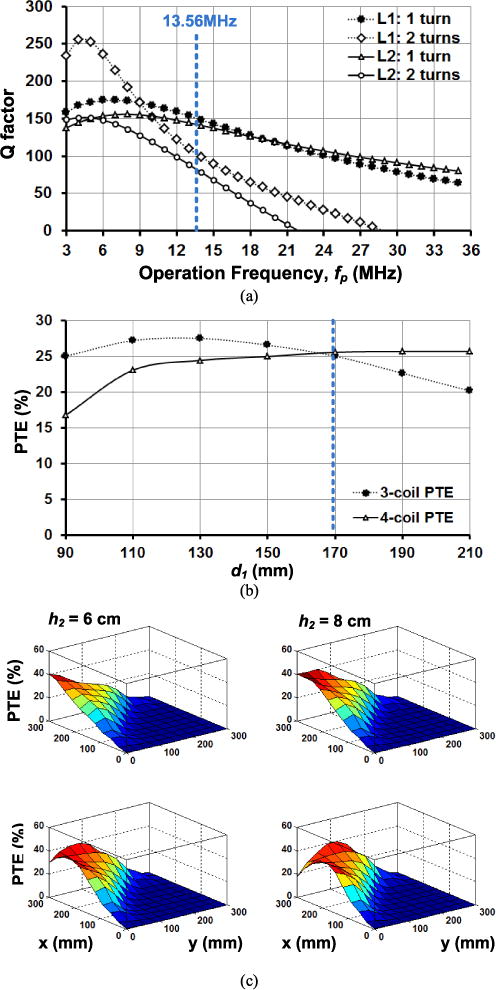
Simulation results of 3/4-coil link optimization for the EnerCage-HC system: (a) Q-factor versus fp for different number of turns in L1 and L2, (b) optimal L1 geometry for homogeneous 3/4-coil PTE, and (c) 4-coil PTE distribution on the corner of the homecage with h2 = 6 cm, 8 cm, 10 cm, and 12 cm at a nominal height of d23 = 7 cm.
In optimizing d1, we noticed that the common optimization algorithm in [40] leads to a smaller d1 with higher PTE at the center of L1 in the 3-coil arrangement. However, that will also reduce the overlap between L1 and L21 ~ L24 coils, resulting in lower k12 and lower PTE in the 4-coil arrangement. Moreover, the powered area in the center of the homecage is also reduced by decreasing d1, negatively affecting the homogeneity of the PTE across the homecage. Fig. 4b shows the simulated 3- and 4-coil PTE vs. d1 at L2-L3 nominal distance of d23 = 7 cm when the Rx coil was located at the center of the homecage (0, 0) for the 3-coil and in the center of a triangular WWC (−75 mm, 75 mm) for the 4-coil link (see orange spots Fig. 3). Starting from 9 cm, as d1 becomes larger, k12 is increased and PTE for the 4-coil link also increases. However, if d1 becomes much larger than its optimal size for the 3-coil link, its PTE decreases due to reduced k13. To create a homogeneous PTE at the coils’ switching points, d1 was selected as 17 cm, based on the simulations in Fig 4b.
To determine the L2 triangular geometry, d2 was chosen 28 cm, slightly less than the length of each side of the homecage (30 cm), to offer maximum overlap with L1 but avoid overlapping among four WWCs at the center of the homecage considering the thickness of the coil wires (see the top view in Fig. 3). h2 is key in determining the distribution of the 4-coil PTE at the corners of the homecage, where the animal tends to stand up and create a worst case scenario for power transmission from a central WWC at the bottom of the cage. Fig. 4c shows the simulated distribution of the 4-coil PTE inside the homecage for the nominal height of d23 = 7 cm when h2 is changed from 6 cm to 12 cm in the nominal loading condition of 300 Ω. It can be seen that by increasing h2 the high PTE region tends to move toward the center of the cage, while PTE at the corners drop. Therefore, to achieve a homogeneous PTE distribution at the corners of the homecage, h2 = 8 cm was chosen, the height at which the peak PTE starts to drop. The PTE distribution is affected by L3 and L4 geometries and orientations, but not by the loading condition. The PTE in the EnerCage-HC is reduced if the loading condition is out of the nominal condition. However, the CLPC dynamically adjusts the Tx power to ensure that the headstage receives sufficient power even in suboptimal loading or positioning conditions.
The geometry of L4 was optimized as the last step for d23 = 7 cm, based on the coil optimization procedure in [40]. The nominal loading was considered to be 300 Ω, corresponding to ~24 mW power consumption in the mobile unit. L3 and L4 are concentric. The inductance values of L3 and L4 are decided by their number of turns and diameter. L4 has a lower Q-factor compared to L3 because the diameter of the litz wire in L4 is much smaller than the solid wire used in L3. Also L4 has higher number of turns because according to our coil design, despite its smaller size, it should have a higher inductance [40]. The optimal EnerCage-HC coil geometries are summarized in Table I. The coil design is optimized for the most common conditions, i.e. a horizontal mobile unit at a nominal height of 7 cm above the bottom of the cage. The other conditions will be taken care of by the CPCL, which dynamically adjusts the Tx power to ensure the mobile unit functionality.
TABLE I.
Coil Specifications for the Prototype EnerCage-HC System
| Parameters | Value |
|---|---|
| Tx wire-wound coil (L1) | Diameter =17 cm Wire width = 2.59 mm (AWG10) Number of turns = 1 Inductance = 0.716 μH Quality factor = 150.3 |
| Tx wire-wound coil (L2) |
d2 = 28 cm, h2 = 8 cm Wire width = 2.59 mm (AWG10) Number of turns = 1 Inductance = 0.890 μH Quality factor = 154 |
| Rx wire-wound coil (L3) | Diameter = 2.5 cm Wire width = 0.64 mm (AWG22) Number of turns = 2 Inductance = 0.48 μH Quality factor = 136 |
| Rx Litz wire-wound coil (L4) | Diameter = 1 cm Wire diameter = 0.25 mm Number of turns/strands = 6/44 Inductance = 5.8 μH Quality factor = 12 |
| L2-L3 nominal distance (d23) | 7 cm |
| Nominal load (RL) | 300 Ω (~24 mW) |
| Operation frequency (fp) | 13.56 MHz |
Figs. 5a and 5b compare the simulated PTE distribution inside the homecage at a nominal height of 7 cm when a single large WWC encompasses the bottom of the cage (see [12]) vs. our proposed 5-coil design, shown in Fig. 1, respectively. The conclusions from these simulations are: 1) The PTE in the corners of the EnerCage-HC is significantly higher than the single WWC design, thanks to the overlapping slanted WWCs (L21 ~ L24), both when the mobile unit is held horizontally and vertically, which happen when the animal is walking on the bottom or climbing the walls of the homecage, respectively; 2) The average PTE in the EnerCage-HC is 27.8%, which is three times higher than the 9.2% average PTE of a single WWC; 3) The PTE distribution in the EnerCage-HC is considerably more homogeneous than the single WWC because the maximum PTE variation inside the homecage is 23.8% of the average PTE in the EnerCage-HC vs. 56.5% in the single WWC homecage.
Fig. 5.
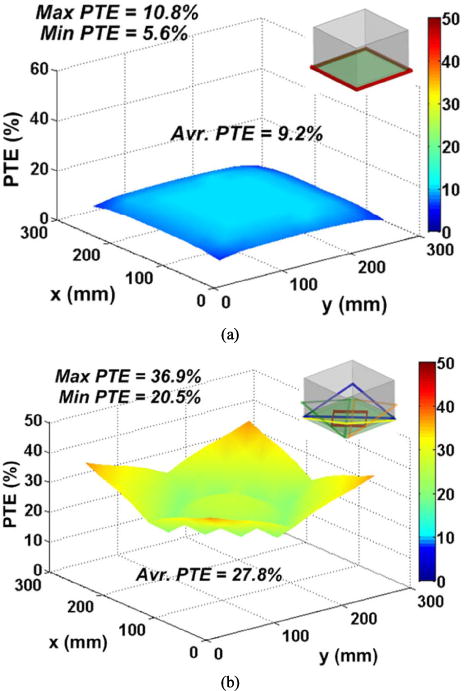
Simulation results of the PTE distribution inside the homecage at the nominal height of d23 = 7 cm for (a) a single WWC [12] and (b) the proposed EnerCage-HC system.
IV. 2D/3D Optical Animal Subject Tracking
Using Kinect provides a unique opportunity to utilize both the IR depth (3D) and RGB (2D) cameras for tracking the animal subject. Another advantage of an IR-based system is its ability to track subjects even in the dark environments, which is quite helpful when experimenting with nocturnal species that include the majority of rodents. Moreover, utilizing both IR and RGB cameras in the EnerCage-HC, aided with an LED tracer on the headstage, enables recognition of the animal subject orientation (determining its head from tail), which is important in behavioral tracking [41], [42].
A. Automated Tracking
Fig. 6 shows the hardware and software diagrams of the tracking algorithm in the EnerCage-HC system. The Kinect was installed at ~90 cm above the homecage to easily cover the 30 × 30 cm2 area of the homecage. The collected depth and RGB images from the Kinect were transferred to PC via USB, as shown in Fig. 6a. The real-time depth image from Kinect was compared to a reference depth image, taken when the animal subject was not present, to find the animal subject in the cage. The software algorithm projects the depth image voxels over a 2D plane, and indicates the areas that have higher value than a predefined detection threshold. Then, the center of the animal outline is found from the projected image to identify the center of the subject body. If the measured depth of the object is less than the threshold, the software concludes that the animal is not present in the cage, and reduces the PA power to its minimum by setting VDD_Tx = 4.5 V to reduce the dissipated power.
Fig. 6.
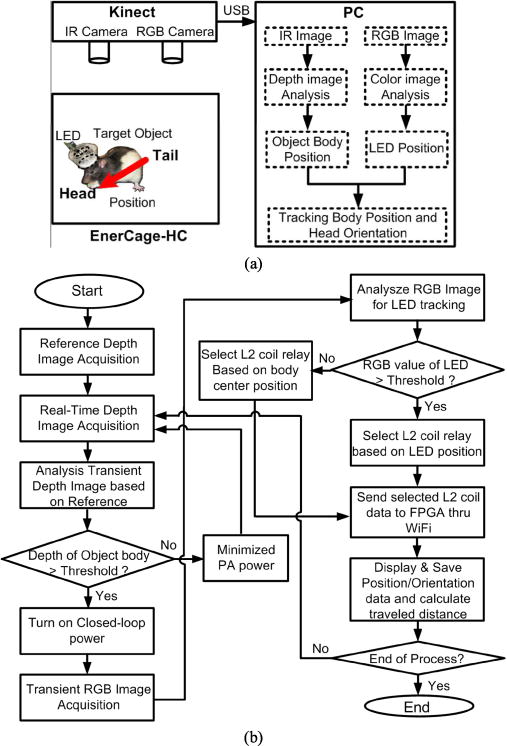
Data flow diagram and flowchart of the tracking mechanism in EnerCage-HC. (a) EnerCage-HC system uses data from both RGB and IR images from the Kinect, and detects the head and body positions separately. (b) Flowchart of the software running on the PC shows how the RGB and IR images are used for real time animal tracking.
When the algorithm finds the center of the subject body, it activates the CPCL to provide sufficient amount of power to the mobile unit. It then analyzes the RGB image to find the LED indicator. At startup, when the mobile unit is not powered and the LED is off, L21 ~ L24 are controlled based on the body position extracted from the depth image. When the LED indicator starts blinking, the position of the LED indicator is detected from the RGB image and combined with the center of the body to not only activate one of L21 ~ L24 coils but also indicate the subject orientation.
With more advanced image processing, we are trying to pinpoint the position of the rat head directly from Kinect the 3D image. When that algorithm is fully functional, there will be no need for an additional LED localization. By tracing the acquired positions, the accumulated distance that the subject has traveled can be calculated in real time. The process for automated tracking, shown in Fig. 6, takes ~50 ms, including the 30 Hz frame rate of the Kinect. It also depends on the performance of the central PC station. Considering relatively low speed of the animal subject movements within the homecage (30~70 cm/s) [43] and the presence of the super capacitors in the mobile unit, the tracking mechanism in the EnerCage-HC is fast enough to provide the animal position for switching L21 –L24 to power the mobile unit. All of the acquired data during the experiment is displayed on the PC screen, and saved in the PC station for post processing.
B. Validation
Fig. 7 compares the automated and manual tracking results within the EnerCage-HC. A checker board with 3 cm grid was used to manually place the mobile unit in a known position inside the homecage. Fig. 7a shows the images of 15 random mobile unit positions on the checker board compared with the automatic tracking data collected in 3 min at each position (P1 to P15). The maximum time jitter for the optical tracking was 20 ms in this test. The maximum position error was measured 1.6 cm near the corners, where the large viewing angle from the Kinect lens is the main source of inaccuracy. Fig. 7b shows the comparison between automatic (red) and manual frame-by-frame (blue) tracking of a freely behaving rat (17 cm long) from the recorded video in an in vivo experiment, which details are presented in section VI. We randomly selected 20 min of the recorded experiment video, and manual tracking was performed by a human observer watching the recorded video to identify the position of the LED and center of body. It can be seen from Fig. 7b that the automated tracing of the LED indicator is in good agreement with manual tracking with maximum localization error of 1.3 cm. However, since determination of the manual body center is somewhat subjective, the automated and manual tracking results are not overlapping as well as the LED tracking. Nonetheless they show similar trends.
Fig. 7.
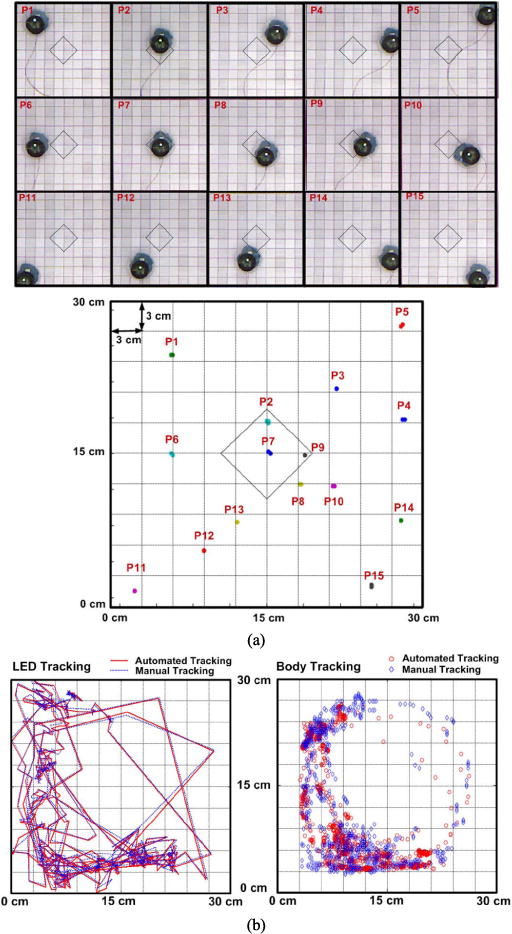
Validation of the automated tracking in the EnerCage-HC system: (a) sample images of 15 random positions (P1–P15) for the LED tracking on the checker board during 3 min and (b) automated tracking versus manual tracking for a 20 min in vivo experiment (Left: LED and Right: body center tracking).
V. Power Management IC in the Mobile Unit
To increase the overall power efficiency of the EnerCage-HC system and establish a communication link between mobile and stationary units for the CPCL, while maintaining small size and volume of the mobile unit, a custom PMIC was designed. Fig. 8 shows the PMIC block diagram, along with its off-chip components that are presented outside the gray dashed box. The AC signal across the Rx L4C4-tank, which is tuned at fp = 13.56 MHz, is rectified by the positive/negative rectifier. The rectifier outputs, VRECP = 2.3 V and VRECN = −2.3 V, are then applied to two LDOs, which create stable VDD = 2 V and VSS = −2 V An automatic-resonance tuning (ART) block ensures that the L4C4- tank is always tuned at fp = 13.56 MHz despite the effects of packaging, implantation, or animal proximity to large conductive objects, such as the transmitter coils.
Fig. 8.
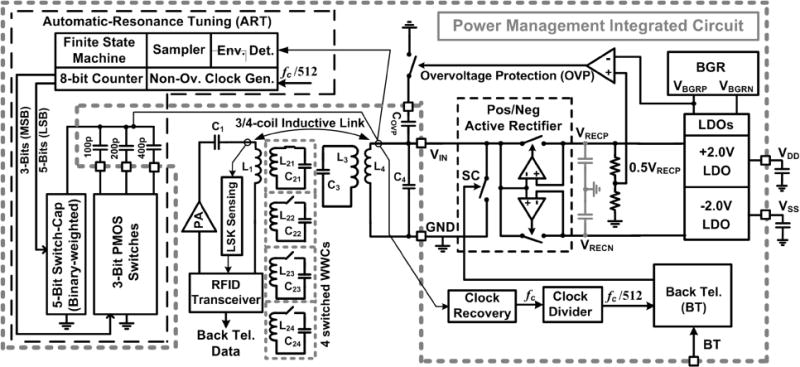
Block diagram of the efficient power management integrated circuit (PMIC) in the mobile unit, which is equipped with automatic resonance tuning (ART) mechanism and back telemetry to dynamically tune the L4C4-tank at the 13.56 MHz carrier frequency and close the power control loop, respectively.
The ART sweeps a 5-bit binary-weighted on-chip (3 pF, 6 pF, 12 pF, 24 pF, 48 pF) and a 3-bit binary-weighted off-chip (100 pF, 200 pF, 400 pF) capacitor bank, resulting in 0–800 pF capacitance change across the L4C4-tank with 3 pF resolution. The ART sweeps the 8-bit capacitor bank, which are connected to an 8-bit counter, in a certain direction (up or down) until the envelope of the carrier across the L4C4-tank, VENV, drops by 100 mV. Then the direction of the sweep changes until VENV again drops by 100 mV. This up/down cycle ensures that the L4C4-tank remains tuned around fp = 13.56 MHz with a fluctuating small offset. The ART finds the optimal capacitance value in less than 3 ms when it only utilizes its 5-bit on-chip capacitors. Therefore, animal movements during this time does not effect on the ART operation. Considering the fact that the coupling between the Tx and Rx coils can become too strong, the PMIC is equipped with an over-voltage protection circuit. A hysteresis comparator detunes the L4C4-tank by adding Covp = 1 nF in parallel when VRECP > 2.6 V to protect the PMIC from large input voltages. The PMIC chip is also equipped with back telemetry circuit to short the L4C4-tank with sharp pulses (~0.4 μs) for sending the VRECP information for the CPCL. Additional details about the PMIC can be found in [44].
Fig. 9a shows a simplified schematic diagram of the active rectifier, consisting of the PMOS and NMOS pass transistors, which are driven by two high-speed offset-controlled comparators [45]. The startup circuit monitors VRECP/VRECN and sets CTL = 0 when VRECP/VRECN are low. At startup, P1 and N1 transistors are diode-connected and form a passive rectifier, which charges VRECP/VRECN regardless of the comparators’ status up to the point that VRECP and VRECN reach a stable minimum level (±1 V). Then CTL toggles to enable the active rectifier to operate normally. Fig. 9b shows measured input/output waveforms in the positive/negative rectifier at 13.56 MHz. The measured rectifier power conversion efficiency (PCE) was 74.3% when RL = 600 Ω was connected between VRECP=2.3 V.
Fig. 9.
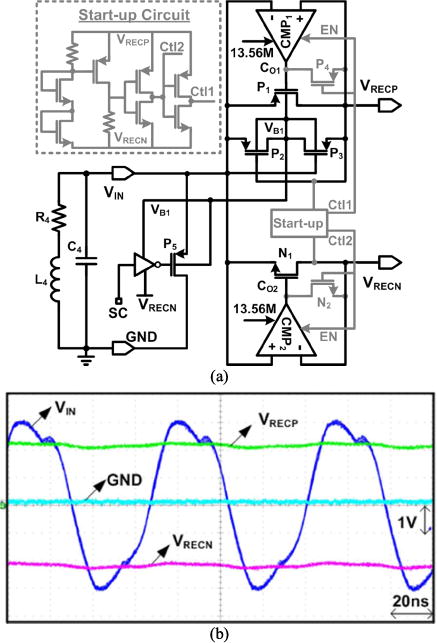
Active rectifier in the PMIC [45]. (a) Circuit diagram of the positive/negative active rectifier with startup. (b) Measured waveforms at 13.56 MHz. The measured PCE was 74.3% when RL = 600 Ω was connected between VRECP = 2.3 V and VRECN = −2.3 V.
Fig. 10 shows the mobile unit prototype including the PMIC, an nRF MCU, and an LED. The PMIC was fabricated in the TSMC 0.35-μm 4M2P standard CMOS process, and it occupies 3.5 mm2 of silicon area. The mobile unit includes L3 and L4 coils, which specifications are given in Table I, at the bottom of the box, a small PCB with the PMIC wirebonded to a QFN package, and a separate PCB with nRF MCU, RF matching network, 2.4 GHz monopole antenna, and the LED indicator. The total weight of the mobile unit in this prototype was 16.2 g including the weight of the box, which was 9.1 g.
Fig. 10.
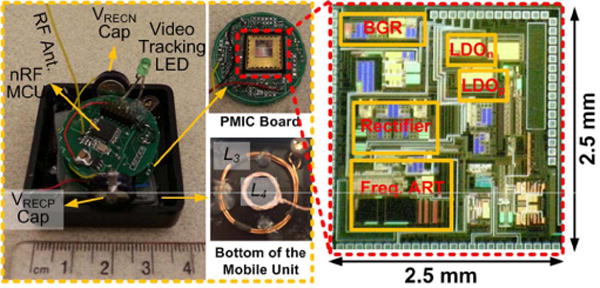
The mobile unit prototype including the PMIC, an nRF MCU, and LED indicator. The PMIC was fabricated in TSMC 0.35-μm 4M2P standard CMOS process, occupying 3.5 mm2.
VI. Measurement Results
Fig. 11 shows the measured PTE distribution between the Tx and Rx coils inside the EnerCage-HC at d23 = 7 cm based on the direct PTE measurement procedure in [40], using a network analyzer across the inductive links. The surface of homecage was marked by a checker board with 3 cm resolution for the PTE measurements. At the corners, the maximum measured PTE was 36.3%, which matches very well with the simulated result in Fig. 5b. The lowest and average PTEs across the homecage were 16.1% and 21.9%, respectively. The efficiency of the PA was measured 81% at VDD_Tx = 4.5 V, and gradually decreased to 63% at VDD_Tx = 20 V, which is the maximum voltage in this prototype EnerCage-HC system.
Fig. 11.
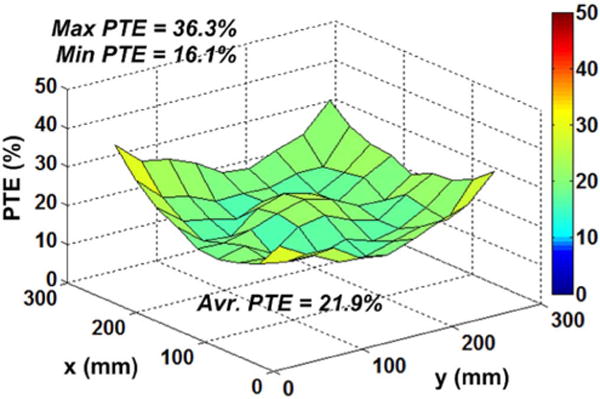
Measured PTE distribution inside the EnerCage-HC.
The maximum permissible exposure (MPE) to magnetic field strength based on the IEEE standard is 16.3/fc (A/m), where fc is in MHz, resulting in the equivalent maximum power density at 13.56 MHz to be 54.3 mW/cm2 [46]. Since the WWC at the bottom of the EnerCage (L1) has 17 cm × 17 cm = 289 cm2 area, the maximum safe power transmission level would be 15.6 W. However, the maximum transmitted RF power in the current EnerCage-HC prototype is 4.4 W, and it only happens over a short period in the worst case scenario when the animal stands up. This is equivalent to a maximum power density of 15.2 mW/cm2, which is well below the safety limit. Therefore, the EnerCage-HC system satisfies the IEEE standard with respect to safe level of human or animal exposure to radio frequency electromagnetic fields [46].
Fig. 12 shows the in vivo experimental setup for the EnerCage-HC prototype. The animal subject was a one-year-old rat weighting 300 g. The mobile unit was placed in the plastic box in Fig. 10 and attached to a special jacket, designed for rats. All experiments were conducted with the prior approval from the Institutional Animal Care and Use Committee (IACUC) at the Georgia Institute of Technology. During the experiment, the GUI reported the real-time video, VRECP, VDD_Tx, and the LED/Body tracking information along with the rat body orientation and travelled distance. Water bottle and food dispenser were also placed in the homecage for the 7 hr and 20 min experiment, during which the rat was freely moving in the homecage.
Fig. 12.
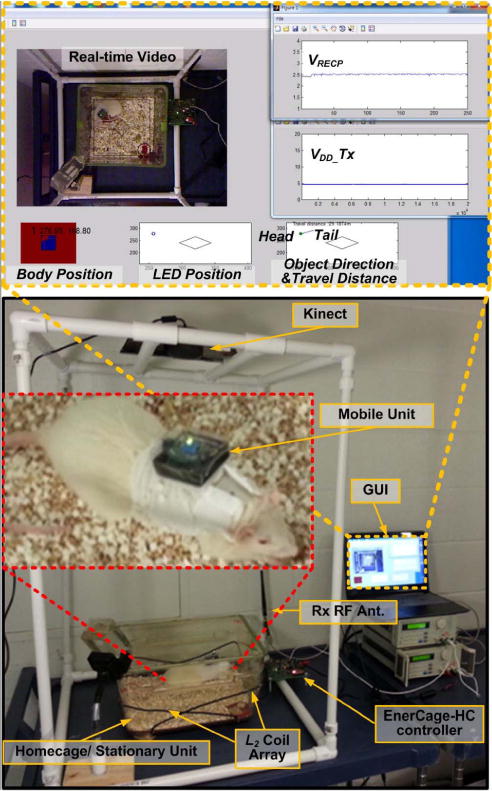
In vivo experimental setup for the EnerCage-HC prototype. In this experiment, the rat was freely moving around the cage for 7 hour and 20 min.
Fig. 13 shows the measured VRECP and VDD_Tx during 7 hours and 20 min without any interruption. The EnerCage-HC continuously delivered 24 mW of regulated power to the mobile unit by maintaining VRECP constant at 2.3 V, which was high enough for the LDO to generate a stable VDD = 2 V, thanks to the CPCL module. The VDD_Tx was dynamically adjusted by the CPCL module in the EnerCage-HC between 4.5 V and 20 V corresponding to the PA power consumption of 0.3 W to 7 W, depending on the coil separation, d23. We should point out that the 7 W power consumption in the PA is the worst case scenario of animal standing up, which is maximum coil separation or angular misalignment of the Rx coil. Fig. 13 inset shows that the CPCL increased VDD_Tx, when the rat moved to low PTE areas or stood up on his hind limbs (t < 14817 s), and decreased VDD_Tx when the mobile unit was close to the homecage surface or high PTE areas (t > 14817 s). The mobile unit received stable power inside the homecage during 7:20 hr of continuous operation regardless of the animal movements, proving the functionality of the EnerCage-HC.
Fig. 13.
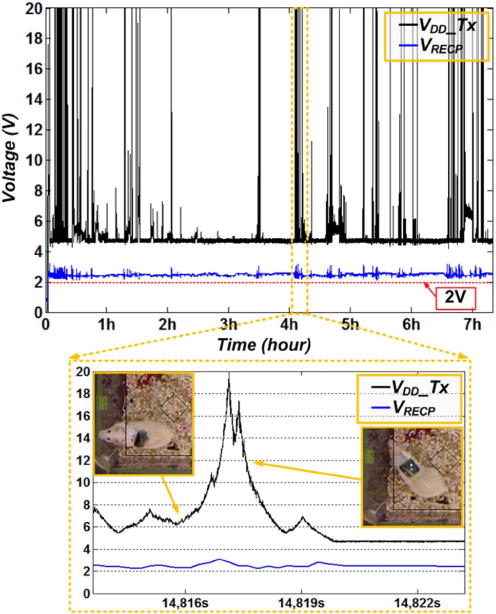
In vivo experimental results showing the mobile unit positive rectifier voltage, VRECP, and the transmitter PA supply voltage, VDD_Tx, during ~7 hrs. The CLCP increased the transmitted power, which is in proportional to VDD_Tx, when the rat moved to low PTE areas or stand up as shown in inset t < 14817 s, and decreased VDD_Tx when the mobile unit was close to the homecage surface or high PTE areas as shown in the inset t > 14817 s.
Fig. 14 shows the measured tracking information including the position and orientation of the animal inside the homecage during the 7:20 hr in vivo experiment. Fig. 14a shows the automated position data for the LED indicator on the mobile unit. The heat map shows how long the animal spent in a certain location. The statistical result for the rat’s orientation based on the automated LED/body tracking data is shown in Fig. 14b. Since most of the time the rat moved across the left corners, marked A and B in Fig. 14a, the orientation of the rat shows peaks in those directions. The rat’s travel distance based on the LED tracking data is shown in Fig. 14c, which indicates that the rat moved about 69.6 m in the homecage during the experiment.
Fig. 14.
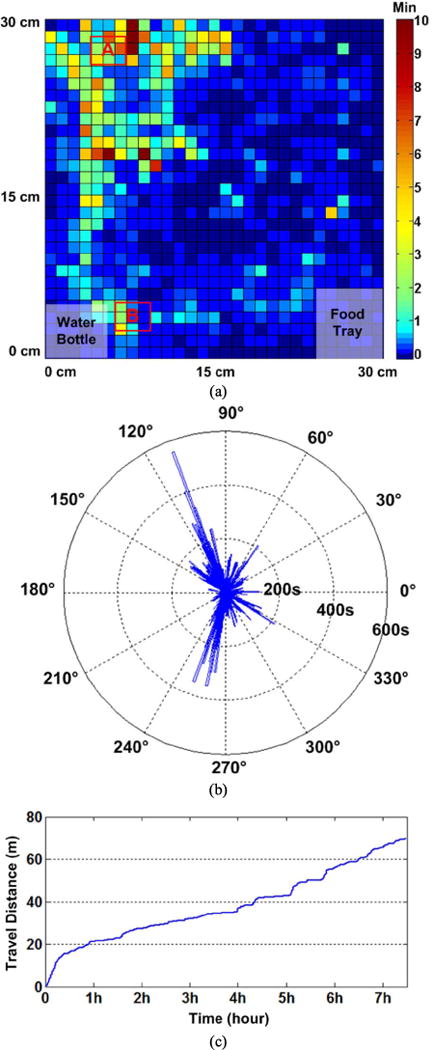
In vivo experimental results showing the automated tracking for the LED/body during ~7 hrs of the experiment inside the homecage: (a) the position of the mobile unit based on the LED tracking, (b) the distributed time of the rat’s orientation based on the LED/body tracking, and (c) the travel distance of the rat in the homecage.
Table II compares the EnerCage-HC system with the previous attempts at developing wirelessly-powered systems for behavioral experiments on small freely behaving animals. The presented EnerCage-HC, 1) provides the largest wirelessly-powered area per one PA with the proposed slanted multi-coil WWC arrangement, 2) is the only system equipped with accurate 2D/3D animal subject tracking, not only for real time coil switching but also for the behavioral analysis of the subject, 3) compared to [19], the customized mobile unit provides higher average power efficiency with smaller Rx coils at 7 cm distance, thanks to its ART mechanism. It also ensures safe operation against frequent over voltage situations along with robust and smooth closed-loop control during long-term in vivo experiments, improving the quality of the collected biosignal and behavioral data.
TABLE II.
Benchmarking Wirelessly-Powered Systems for Behavioral Experiments
| Year of publication | 2012 [16] 2014 [19] | 2014 [20] | 2013 [21] | 2014 [22] | 2014 [23] | This work |
|---|---|---|---|---|---|---|
| Frequency | 13.56 MHz | 13.56 MHz | 1.55 MHz | 2.457 MHz | 13.56 MHz | 13.56 MHz |
| Coil coupling | 3-/4- coil | 4 coil | 2 coil | 4 coil | 2 coil | 3/4 coil |
| Tx coil type | PSC array | PSC array | PSC array | WWC | PSC | WWC |
| Number of power amplifiers | 27 | 1 | 16 | 1 or 2 | 1 | 1 |
| Powered experimental area | 51.5 × 45 cm2 | 30 × 30 cm2 | 45 × 26 cm2 | 15 × 20 cm2 | 18 × 34 cm2 | 30 × 30 cm2 |
| Rx power | 20 mW | *115 mW | ~22 mW | N/A | 1.7 mW | 24 mW |
| Rx coil diameter (L3, L4) | 4 cm, 2.5 cm | 4.2 cm, 1.1 cm | 4 cm | 1.9 cm, 1.6 cm | 1.2 cm | 2.5 cm, 1 cm |
| Efficiency (Distance) | ~21% (7cm) | *76% (4cm) | **7.2% (10 cm) | ***10% (7 cm) | 17% (3 cm) | 21.9% (7 cm) |
| Animal subject tracking (Resolution) | Position (N/A) | N/A | Position (N/A) | N/A | Position (1 cm) | Position & Orientation (1.6 cm) |
| Tracking Method | Magnetic | N/A | Impedance | N/A | Magnetic Field | Infrared/RGB |
| Closed loop control | Yes | N/A | N/A | Yes | Yes | Yes |
| Automatic resonance tuning | N/A | N/A | N/A | N/A | N/A | Yes |
| In vivo experiment (duration) | Yes (1 hr) | N/A | N/A | Yes (N/A) | N/A | Yes (7 hr 20 min) |
Source resistance is 1 Ω.
Estimated
Single PA is used
VII. Conclusion
A novel wireless platform for electrophysiology experiments inside the standard homecage has been presented. This system, called the EnerCage-HC, takes advantage of multi-coil coupling and Kinect® based optical localization to offer an efficient and low-cost technology for wireless powering any electronics attached to a small animal subject and track its behavior. The EnerCage-HC includes four switchable slanted triangular WWCs covering lower corners of the homecage by establishing 4-coil power transfer as well as a square-shaped WWC at the bottom of the cage for 3-coil power transfer in the center. The Kinect tracking algorithm is key to achieve the switchable 3-/4-coil function, which in turn allows the use of only one PA in the system, which significantly reduces the system complexity, cost, and heat dissipation. The 3-/4-coil mechanism achieves three times higher and more homogeneous PTE in the homecage compared to the conventional single WWC. A PMIC is used in the mobile unit to offer high efficiency voltage rectification/regulation, and communication between mobile and stationary units for closed-loop power control. The functionality of the EnerCage-HC prototype was demonstrated in both bench-top and in vivo experiments. The mobile unit was attached to a rat, and continuously received 24 mW of regulated power during a 7:20 hour experiment, while a Kinect® installed 90 cm above the homecage tracked the animal position and orientation with 1.6 cm accuracy. To the best of our knowledge, the EnerCage-HC system is the first wirelessly powered cage equipped with the tracking functions for both animal position and orientation. It has the ability to create an automated enriched environment inside standard homecage for long-term electrophysiology experiments.
Acknowledgments
The authors would like to thank Dr. L. O’Farrell and members of the GT-Bionics Lab for their advice and help with the benchtop measurements and in vivo experiments.
This work was supported in part by the National Institutes of Health under Grant 1R21EB018561 and Grant 5R21EB009437 and in part by the National Science Foundation under Award ECCS-1408318 and Award IIP-1346416.
Biographies

Byunghun Lee (S’11) received the B.S. degree from Korea University, Seoul, Korea, in 2008, and the M.S. degree from the Korea Advanced Institute of Technology (KAIST), Daejeon, Korea, in 2010. He is currently pursuing the Ph.D. degree in electrical and computer engineering at the Georgia Institute of Technology. From 2010 to 2011, he was involved in wireless power transfer systems at KAIST as a Design Engineer. His research interests include analog/mixed-signal IC design and wireless power transfer systems for biomedical applications.

Mehdi Kiani (S’09) received the B.S. degree from Shiraz University, Shiraz, Iran, in 2005, the M.S. degree from the Sharif University of Technology, Tehran, Iran, in 2008, and the M.S. and Ph.D. degrees in electrical and computer engineering from the Georgia Institute of Technology, in 2012 and 2013, respectively. He is currently an Assistant Professor with the Department of Electrical Engineering, Pennsylvania State University. His research interest is integrated circuits and systems design for bio application. He was a recipient of the Georgia Tech Sigma Xi Best Ph.D. Thesis Award, and Georgia Tech Chih Foundation Research Award for excellent research in the fields of engineering and health sciences.

Maysam Ghovanloo (S’00–M’04–SM’10) received the B.S. degree in electrical engineering from the University of Tehran, Tehran, Iran, in 1994, the M.S. degree in biomedical engineering from the Amirkabir University of Technology, Tehran, in 1997, and the M.S. and Ph.D. degrees in electrical engineering from the University of Michigan, Ann Arbor, MI, USA, in 2003 and 2004, respectively. From 2004 to 2007, he was an Assistant Professor with the Department of Electrical and Computer Engineering, NC-State University, Raleigh, NC. He joined the Faculty of the Georgia Institute of Technology, Atlanta, GA, USA, in 2007, where he is currently an Associate Professor and the Founding Director of the GT-Bionics Laboratory, School of Electrical and Computer Engineering. He has authored or co-authored over 150 peer-reviewed publications. He is a member of the Tau Beta Pi, the American Association for the Advancement of Science, Sigma Xi, the IEEE Solid-State Circuits Society, the IEEE Circuits and Systems Society, and the IEEE Engineering in Medicine and Biology Society. He was the 2010 recipient of a CAREER Award from the National Science Foundation. He has organized several special sessions and was a member of the Technical Program Committees for major conferences in the areas of circuits, systems, sensors, and biomedical engineering. He served on the Imagers, MEMS, Medical, and Displays Subcommittee of the International Solid-State Circuits Conference from 2010 to 2014. He is also an Associate Editor of the IEEE TRANSACTIONS ON BIOMEDICAL ENGINEERING and the IEEE TRANSACTIONS ON BIOMEDICAL CIRCUITS AND SYSTEMS.
Footnotes
The associate editor coordinating the review of this paper and approving it for publication was Prof. Kazuaki Sawada.
Color versions of one or more of the figures in this paper are available online at http://ieeexplore.ieee.org.
Contributor Information
Byunghun Lee, GT-Bionics Laboratory, School of Electrical and Computer Engineering, Georgia Institute of Technology, Atlanta, GA 30308 USA.
Mehdi Kiani, Electrical Engineering Department, Pennsylvania State University, University Park, PA 16802 USA.
Maysam Ghovanloo, Email: mgh@gatech.edu, GT-Bionics Laboratory, School of Electrical and Computer Engineering, Georgia Institute of Technology, Atlanta, GA 30308 USA.
References
- 1.Manns JR, Eichenbaum H. A cognitive map for object memory in the hippocampus. Learn Memory. 2009 Sep;16(10):616–624. doi: 10.1101/lm.1484509. [DOI] [PMC free article] [PubMed] [Google Scholar]
- 2.Choi Y, Park S, Chung Y, Gore RK, English AW, Bellamkonda RV. PDMS microchannel scaffolds for neural interfaces with the peripheral nervous system. Proc IEEE 27th Int Conf Micro Electro Mech Syst (MEMS) 2014 Jan;:873–876. [Google Scholar]
- 3.Sodagar AM, Perlin GE, Yao Y, Najafi K, Wise KD. An implantable 64-channel wireless microsystem for single-unit neural recording. IEEE J Solid-State Circuits. 2009 Sep;44(9):2591–2604. [Google Scholar]
- 4.Szuts TA, et al. A wireless multi-channel neural amplifier for freely moving animals. Nature Neurosci. 2011 Feb;14(2):263–269. doi: 10.1038/nn.2730. [DOI] [PubMed] [Google Scholar]
- 5.Greenwald E, Mollazadeh M, Hu C, Tang W, Culurciello E, Thakor NV. A VLSI neural monitoring system with ultra-wideband telemetry for awake behaving subjects. IEEE Trans Biomed Circuits Syst. 2011 Apr;5(2):112–119. doi: 10.1109/TBCAS.2011.2141670. [DOI] [PubMed] [Google Scholar]
- 6.Fan D, et al. A wireless multi-channel recording system for freely behaving mice and rats. PLoS One. 2011 Jul;6(7):e22033-1–e22033-9. doi: 10.1371/journal.pone.0022033. [DOI] [PMC free article] [PubMed] [Google Scholar]
- 7.Lee SB, Yin M, Manns JR, Ghovanloo M. A wideband dual-antenna receiver for wireless recording from animals behaving in large arenas. IEEE Trans Biomed Eng. 2013 Jul;60(17):1993–2004. doi: 10.1109/TBME.2013.2247603. [DOI] [PMC free article] [PubMed] [Google Scholar]
- 8.Harrison RR, et al. A low-power integrated circuit for a wireless 100-electrode neural recording system. IEEE J Solid-State Circuits. 2007 Jan;42(1):123–133. [Google Scholar]
- 9.Guggenmos DJ, et al. Restoration of function after brain damage using a neural prosthesis. Proc Nat Acad Sci USA. 2013 Dec;110(52):21177–21182. doi: 10.1073/pnas.1316885110. [DOI] [PMC free article] [PubMed] [Google Scholar]
- 10.Millard RE, Shepherd RK. A fully implantable stimulator for use in small laboratory animals. J Neurosci Methods. 2007 Nov;166(2):168–177. doi: 10.1016/j.jneumeth.2007.07.009. [DOI] [PMC free article] [PubMed] [Google Scholar]
- 11.Lenaerts B, Puers R. Inductive powering of a freely moving system. Sens Actuators A, Phys. 2005 Sep;123–124:522–530. [Google Scholar]
- 12.Cong P, Chaimanonart N, Ko W, Young D. A wireless and batteryless 130 mg 300 μW 10 b implantable blood-pressure-sensing microsystem for real-time genetically engineered mice monitoring. IEEE Int Solid-State Circuits Conf-Dig Tech Papers. 2009 Feb;:428–429. [Google Scholar]
- 13.Starr Life Sciences Corp. VitalView Animal Monitoring Products. [Online] Available: http://starrlifesciences.com/, accessed May 17, 2015.
- 14.Triangle Biosystems International Corp. W-Series. [Online] Available: http://www.trianglebiosystems.com/, accessed May 17, 2015.
- 15.Wentz CT, Bernstein JG, Monahan P, Guerra A, Rodriguez A, Boyden ES. A wirelessly powered and controlled device for optical neural control of freely-behaving animals. J Neural Eng. 2011 Jun;8(4):046021. doi: 10.1088/1741-2560/8/4/046021. [DOI] [PMC free article] [PubMed] [Google Scholar]
- 16.Jow U-M, Kiani M, Huo X, Ghovanloo M. Towards a smart experimental arena for long-term electrophysiology experiments. IEEE Trans Biomed Circuits Syst. 2012 Oct;6(5):414–423. doi: 10.1109/TBCAS.2012.2211872. [DOI] [PMC free article] [PubMed] [Google Scholar]
- 17.Russell DM, McCormick D, Taberner AJ, Malpas SC, Budgett DM. A high bandwidth fully implantable mouse telemetry system for chronic ECG measurement. Proc Annu Int Conf IEEE Eng Med Biol Soc. 2011 Aug-Sep;:7666–7669. doi: 10.1109/IEMBS.2011.6091889. [DOI] [PubMed] [Google Scholar]
- 18.Millar, Inc. TRM Implantable Telemetry System. [Online] Available: http://millar.com/products/telemetry, accessed May 17, 2015.
- 19.Jow U-M, McMenamin P, Kiani M, Manns JR, Ghovanloo M. EnerCage: A smart experimental arena with scalable architecture for behavioral experiments. IEEE Trans Biomed Eng. 2014 Jan;61(1):139–148. doi: 10.1109/TBME.2013.2278180. [DOI] [PMC free article] [PubMed] [Google Scholar]
- 20.Mirbozorgi SA, Bahrami H, Sawan M, Gosselin B. A smart multicoil inductively coupled array for wireless power transmission. IEEE Trans Ind Electron. 2014 Nov;61(11):6061–6070. [Google Scholar]
- 21.Soltani N, Aliroteh MS, Genov R. Cellular inductive powering system for weakly-linked resonant rodent implants. Proc IEEE BioCAS Conf. 2013 Oct-Nov;:350–353. [Google Scholar]
- 22.Eom K, et al. A wireless power transmission system for implantable devices in freely moving rodents. Med Biol Eng Comput. 2014 Jun;52(8):639–651. doi: 10.1007/s11517-014-1169-3. [DOI] [PubMed] [Google Scholar]
- 23.Kilinc EG, Conus G, Weber C, Kawkabani B, Maloberti F, Dehollain C. A system for wireless power transfer of micro-systems in-vivo implantable in freely moving animals. IEEE Sensors J. 2014 Feb;14(2):522–531. [Google Scholar]
- 24.Tecott LH, Nestler EJ. Neurobehavioral assessment in the information age. Nature Neurosci. 2004 May;7(5):462–466. doi: 10.1038/nn1225. [DOI] [PubMed] [Google Scholar]
- 25.Denenberg VH. Open-field behavior in the rat: What does it mean? Ann New York Acad Sci. 1969 Jul;159:852–859. doi: 10.1111/j.1749-6632.1969.tb12983.x. [DOI] [PubMed] [Google Scholar]
- 26.Clarke RL, Smith RF, Justesen DR. An infrared device for detecting locomotor activity. Behavior Res Methods, Instrum, Comput. 1985 Sep;17(5):519–525. [Google Scholar]
- 27.Twining CJ, Taylor CJ, Courtney P. Robust tracking and posture description for laboratory rodents using active shape models. Behavior Res Methods, Instrum, Comput. 2001 Aug;33(3):381–391. doi: 10.3758/bf03195392. [DOI] [PubMed] [Google Scholar]
- 28.Spruijt BM, DeVisser L. Advanced behavioural screening: Automated home cage ethology. Drug Discovery Today, Technol. 2006;3(2):231–237. doi: 10.1016/j.ddtec.2006.06.010. [DOI] [PubMed] [Google Scholar]
- 29.Godden DH, Graham D. ‘Instant’ analysis of movement. J Experim Biol. 1983 Nov;107:505–508. doi: 10.1242/jeb.107.1.505. [DOI] [PubMed] [Google Scholar]
- 30.Noldus LPJJ, Spink AJ, Tegelenbosch RAJ. EthoVision: A versatile video tracking system for automation of behavioral experiments. Behavior Res Methods, Instrum, Comput. 2001 Aug;33(3):398–414. doi: 10.3758/bf03195394. [DOI] [PubMed] [Google Scholar]
- 31.Kato S, Tamada K, Shimada Y, Chujo T. A quantification of goldfish behavior by an image processing system. Behavioural Brain Res. 1996 Oct;80(1–2):51–55. doi: 10.1016/0166-4328(96)00018-6. [DOI] [PubMed] [Google Scholar]
- 32.Fry SN, Bichsel M, Müller P, Robert D. Tracking of flying insects using pan-tilt cameras. J Neurosci Methods. 2000 Aug;101(1):59–67. doi: 10.1016/s0165-0270(00)00253-3. [DOI] [PubMed] [Google Scholar]
- 33.Chrásková J, Kaminsky Y, Krekule I. An automatic 3D tracking system with a PC and a single TV camera. J Neurosci Methods. 1999 May;88(2):195–200. doi: 10.1016/s0165-0270(99)00033-3. [DOI] [PubMed] [Google Scholar]
- 34.Ou-Yang T-H, Tsai M-L, Yen C-T, Lin T-T. An infrared range camera-based approach for three-dimensional locomotion tracking and pose reconstruction in a rodent. J Neurosci Methods. 2011 Sep;201(1):116–123. doi: 10.1016/j.jneumeth.2011.07.019. [DOI] [PubMed] [Google Scholar]
- 35.Whitmire E, Latif T, Bozkurt A. Kinect-based system for automated control of terrestrial insect biobots. Proc 35th Annu Int Conf IEEE EMBS. 2013 Jul;:1470–1473. doi: 10.1109/EMBC.2013.6609789. [DOI] [PubMed] [Google Scholar]
- 36.Tecniplast Corp. Sealsafe Plus Rat. [Online] Available: http://www.tecniplast.it/, accessed May 17, 2015.
- 37.Kiani M, Ghovanloo M. An RFID-based closed-loop wireless power transmission system for biomedical applications. IEEE Trans Circuits Syst II, Exp Briefs. 2010 Apr;57(4):260–264. doi: 10.1109/TCSII.2010.2043470. [DOI] [PMC free article] [PubMed] [Google Scholar]
- 38.Lee H-M, Kwon K-Y, Li W, Ghovanloo M. A power-efficient switched-capacitor stimulating system for electrical/optical deep-brain stimulation. IEEE Int Solid State Circuits Conf Dig Tech Papers. 2014 Feb;:414–415. [Google Scholar]
- 39.Kurs A, Karalis A, Moffatt R, Joannopoulos JD, Fisher P, Soljačić M. Wireless power transfer via strongly coupled magnetic resonances. Science. 2007 Jul;317:83–86. doi: 10.1126/science.1143254. [DOI] [PubMed] [Google Scholar]
- 40.Kiani M, Jow U-M, Ghovanloo M. Design and optimization of a 3-coil inductive link for efficient wireless power transmission. IEEE Trans Biomed Circuits Syst. 2011 Dec;5(6):579–591. doi: 10.1109/TBCAS.2011.2158431. [DOI] [PMC free article] [PubMed] [Google Scholar]
- 41.Chen LL, Lin L-H, Barnes CA, McNaughton BL. Head-direction cells in the rat posterior cortex. Experim Brain Res. 1994 Sep;101(1):24–34. doi: 10.1007/BF00243213. [DOI] [PubMed] [Google Scholar]
- 42.Calton JL, Taube JS. Degradation of head direction cell activity during inverted locomotion. J Neurosci. 2005 Mar;25(9):2420–2428. doi: 10.1523/JNEUROSCI.3511-04.2005. [DOI] [PMC free article] [PubMed] [Google Scholar]
- 43.Moita MAP, Rosis S, Zhou Y, LeDoux JE, Blair HT. Hippocampal place cells acquire location-specific responses to the conditioned stimulus during auditory fear conditioning. Neuron. 2003 Feb;37(3):485–497. doi: 10.1016/s0896-6273(03)00033-3. [DOI] [PubMed] [Google Scholar]
- 44.Lee B, Kiani M, Ghovanloo M. A triple-loop inductive power transmission system for biomedical applications. IEEE Trans Biomed Circuits Syst. 2015 doi: 10.1109/TBCAS.2014.2376965. [DOI] [PubMed] [Google Scholar]
- 45.Lee H-M, Ghovanloo M. An integrated power-efficient active rectifier with offset-controlled high speed comparators for inductively powered applications. IEEE Trans Circuits Syst I, Reg Papers. 2011 Aug;58(8):1749–1760. doi: 10.1109/TCSI.2010.2103172. [DOI] [PMC free article] [PubMed] [Google Scholar]
- 46. (IEEE Standard C95.1-1991).IEEE Standard for Safety Levels With Respect to Human Exposure to Radio Frequency Electromagnetic Fields, 3 kHz to 300 GHz. 1992 [Google Scholar]