Abstract
Background
Recent genomic information has revealed that neuroglobin and cytoglobin are the two principal lineages of vertebrate hemoglobins, with the latter encompassing the familiar myoglobin and α-globin/β-globin tetramer hemoglobin, and several minor groups. In contrast, very little is known about hemoglobins in echinoderms, a phylum of exclusively marine organisms closely related to vertebrates, beyond the presence of coelomic hemoglobins in sea cucumbers and brittle stars. We identified about 50 hemoglobins in sea urchin, starfish and sea cucumber genomes and transcriptomes, and used Bayesian inference to carry out a molecular phylogenetic analysis of their relationship to vertebrate sequences, specifically, to assess the hypothesis that the neuroglobin and cytoglobin lineages are also present in echinoderms.
Results
The genome of the sea urchin Strongylocentrotus purpuratus encodes several hemoglobins, including a unique chimeric 14-domain globin, 2 androglobin isoforms and a unique single androglobin domain protein. Other strongylocentrotid genomes appear to have similar repertoires of globin genes. We carried out molecular phylogenetic analyses of 52 hemoglobins identified in sea urchin, brittle star and sea cucumber genomes and transcriptomes, using different multiple sequence alignment methods coupled with Bayesian and maximum likelihood approaches. The results demonstrate that there are two major globin lineages in echinoderms, which are related to the vertebrate neuroglobin and cytoglobin lineages. Furthermore, the brittle star and sea cucumber coelomic hemoglobins appear to have evolved independently from the cytoglobin lineage, similar to the evolution of erythroid oxygen binding globins in cyclostomes and vertebrates.
Conclusion
The presence of echinoderm globins related to the vertebrate neuroglobin and cytoglobin lineages suggests that the split between neuroglobins and cytoglobins occurred in the deuterostome ancestor shared by echinoderms and vertebrates.
Introduction
Although genomic information accrued over the last decade has demonstrated the existence of globins in all three kingdoms of life [1], far beyond the familiar myoglobin (Mb) and α- and β-globins, it has also unexpectedly expanded the repertory of vertebrate globins. Over a decade ago, Burmester, Hankeln et al. identified neuroglobin (Ngb), expressed primarily in neurons of the central and peripheral nervous systems and eye tissue [2]. Concomitantly, three groups discovered another major globin, cytoglobin (Cygb), expressed mostly in fibroblasts and internal organs [3–5]. Additional globins with more limited distributions were also found, including globin E (GbE), an eye-specific globin present only in birds [6], globin X (GbX) found in amphibians and teleost fish [7], and globin Y (GbY) found so far only in the genome of the frog Xenopus tropicalis [8]. GbX was shown more recently to be present in lampreys, several protostomes, a shark and in reptiles [9], and to also represent a family of membrane-bound globins [10]. Despite more than a decade of intensive research, the functions of Ngb and Cygb remain unclear [11, 12]. Molecular phylogenetic analyses of vertebrate globins agree that GbX is closely related to Ngbs, while Cygbs are related to cyclostome hemoglobins (Hbs), Mb, GbE, GbY and the Hb α- and β-globins [13–17]. The latest addition, is the large chimeric androglobin (Adgb), that appears to be phylogenetically related to Ngb [18]. We report below the results of a molecular phylogenetic analysis of 52 echinoderm Hbs and representative vertebrate Hbs designed to test the hypothesis that Ngb and Cygb-like globins are also present in echinoderms.
Together with chordates and hemichordates, echinoderms, animals with “spiny skin”, form the deuterostome superphylum, one of the two major divisions of animals [19, 20]. All echinoderms share the following characteristics: (a) a pentameral radial symmetry in adults, imposed on a bilateral larval symmetry, (b) a unique water vascular or “ambulacral” system, comprising a network of fluid-filled canals, that serves functions in feeding, gas exchange, and also in locomotion, and (c), a stereom, a mesh-like endoskeleton comprised of calcite (calcium carbonate) plates and pores covered by a thin epidermis [20]. Echinoderms are classified into the free-moving Eleutherozoa, which include the Asteroidea (starfish, ~1750 species), the Echinoidea (sea urchins and sand dollars, about 900 species), the Holothuroidea (sea cucumbers, ~1430 species), the Ophiuroidea (brittle stars, ~2,300 species), and the sessile Pelmatozoa, encompassing the Crinoidea (feather stars and sea lilies, about 1430 species) [21]. Although the approximately 7,000 species of extant echinoderms occur in marine habitats extending from shallow intertidal zones to the deep ocean floor, the majority live in the benthic zone, starting from the shoreline, and extending downward along the continental shelf to the latter’s edge, at a depth of about 200m [21]. Echinoderms also subsume nearly 13,000 extinct species, some dating back to the Cambrian period, that lasted from about 540 to 490 Mya (million years ago), and coincided with a rapid expansion in multicellular life forms, the Cambrian explosion [22].
Although Hbs were recognized to occur in echinoderms early on [23, 24], very little is known about them. Intracellular Hbs occurring in coelomocytes present in the water vascular system (WVS), have been reported in two of the five classes of echinoderms: the holothurians (sea cucumbers) and ophiuroids (brittle stars) [25, 26]. The biochemical properties of the Hbs from the ophiuroids Hemipholis cordifera (elongata) and Ophiactis simplex have been investigated [27–29], as well as of the coelomic Hbs from several sea cucumbers, including Caudina arenicola, Thyonella gemmata and Paracaudina chilensis [27, 30–39]. Furthermore, the amino acid sequences of the latter and the crystal structure of two C. arenicola coelomic Hbs have been determined [40–43]. The gene structures for the Hbs of C. arenicola and the brittle star O. simplex have also been reported [44, 45].
The first annotation of the genome sequence of the echinoid sea urchin Strongylocentrotus purpuratus [46] revealed the presence of a very unusual chimeric, multi-domain globin [47, 48] as well as a single domain globin, that was shown to be characteristic of a new globin family, the chimeric androglobins, which are present in all chordates [18]. The advent of a revised annotation of the sea urchin genome sequence using next generation transcriptome sequence data [48] has necessitated a further analysis of its Hbs.
Results
Sea urchin Hbs
The first annotation of the S. purpuratus genome sequence [46] revealed the presence of a highly unusual, large, chimeric multidomain Hb and of a single domain globin, that was shown subsequently, to define the androglobin family [18], consisting of large (>1500 residues) chimeric proteins with a cysteine proteinase N-terminal and a central, circularly permuted globin domain. Subsequent analysis showed that, in addition to the androglobins, the sea urchin possessed a 16-domain Ngb-like globin [47]. The advent of a more recent annotation of the sea urchin genome, Spur_v3.1 (2011/06/10), informed by next generation transcriptome sequence data [48], has necessitated a revised understanding of its globin genes (see Table 1). The 16-domain protein identified earlier as a Ngb [47] is now understood to comprise a 14-domain protein (XP_001199205.2), and a 416 residue protein (XP_003725467.1), the latter consisting of the two N-terminal globin domains. Furthermore, a new 166 residue globin (XP_003729167.1) was identified, and observed to be homologous to Cygb. The two androglobin isoforms are still present in the new annotation, as is the unique 267 residue single Adgb (XP_001195639.2) (see Table 1).
Table 1. Globins identified in the latest annotation of the S. purpuratus genome sequence, Spur_v3.1 (2011/06/10).
| Identifier | No. of residues | Remarks |
|---|---|---|
| XP_001199205.2 | 2146 | 14 covalently linked globin domains |
| XP_003725467.1 | 416 | 2 covalently linked globin domains and an unknown N-terminal |
| XP_003729167.1 | 166 | New, single domain globin |
| XP_001195639.2 | 267 | Single androglobin domain |
| XP_001186225.2 | 1765 | Androglobin isoform 1 |
| XP_003724134.1 | 1841 | Androglobin isoform 2 |
A MAFFT L-INS-i alignment of the 14 domains of the 2146-residue multidomain protein, the 2 globin domains of the 416 residue protein and sperm whale Mb is provided in S1 Fig, together with the canonical Mb-fold [49]. It is evident that all the globin domains adhere to the Mb-fold and contain the required distal His at position F8. Only the second globin domain of the 416 residue protein, missing helices G and H, can be regarded as defective.
Other echinoderm Hbs
We sought to identify homologs of the S. purpuratus globins in the genomes and transcriptomes of other echinoderms. S1 Table lists the echinoderm species whose genomes/transcriptomes yielded hits in BLASTP and TBLASTN searches using the S. purpuratus globins as queries, including additional echinoid genomes [50–54]. Overall, some 52 echinoderm globin sequences were identified in recently available genomes and transcriptomes (http://echinodb.uncc.edu/), including sequences found in the literature [40, 41, 43, 55]. A MAFFT L-INS-i alignment of the 52 sequences was subjected to the ExPASy Decrease Redundancy Tool (web.expasy.org/decrease_redundancy/), set at 90% identity. The resulting similarity matrix and the remaining 38 sequences are provided in S2 Fig. S2 Table lists the observed locations of introns in selected echinoderm Hbs. The presence of conserved intron positions B12.2 (between positions 2 and 3 of codon 12 in helix B) and G7.0 (between the codons for amino acids 6 and 7 in globin helix G), found in most metazoan globins, provides additional support for their globin identity.
Molecular phylogeny of echinoderm Hbs
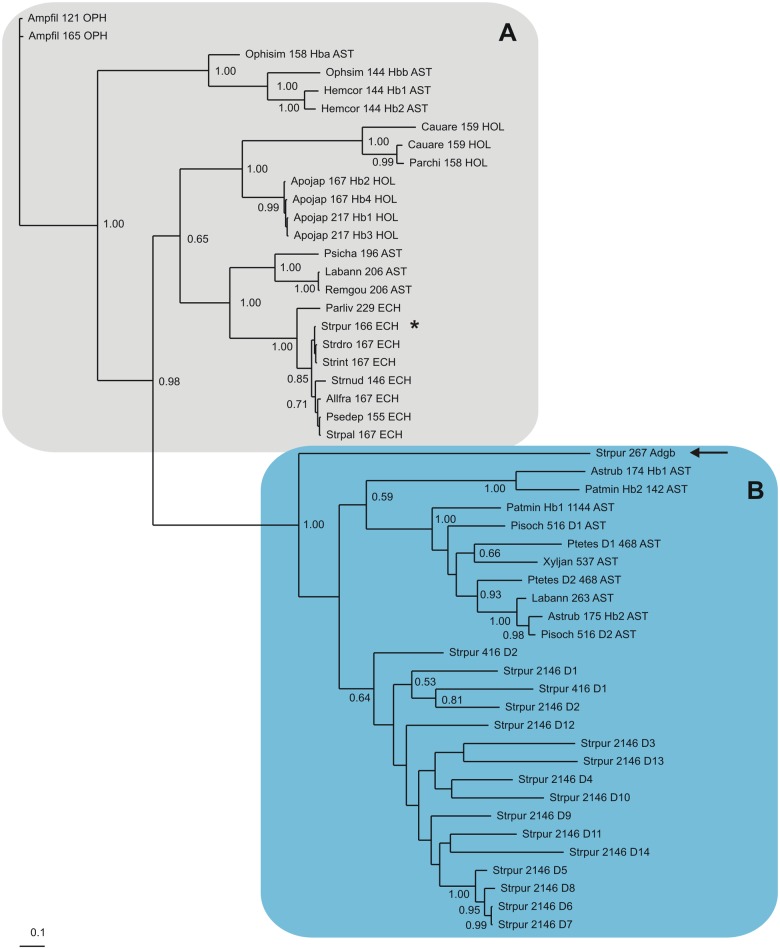
An unrooted Bayesian tree of a MAFFT L-INS-i MSA (GUIDANCE score 0.955) of the 52 echinoderm globins is shown in Fig 1. It demonstrates that the sequences cluster in two approximately equally-sized groups. Group A (labeled in grey) comprises the S. purpuratus 166 residue Hb (XP_003729167.1), and its ophiuroid, holothuroid, asteroid and other strongylocentrotid orthologs. Group B (shaded light blue) is supported with highest Bayesian posterior probability, and includes the domains of the S. purpuratus 2146 residue multidomain (XP_001199205.2) and the 416 residue 2-domain Hb (XP_003725467.1), several homologous asteroid Hbs and the single domain Adgb (XP_001195639.2).
Fig 1. Bayesian phylogenetic tree based on a MAFFT L-INS-i MSA of 52 Echinoderm Hbs.
Relationships between vertebrate and echinoderm Hbs
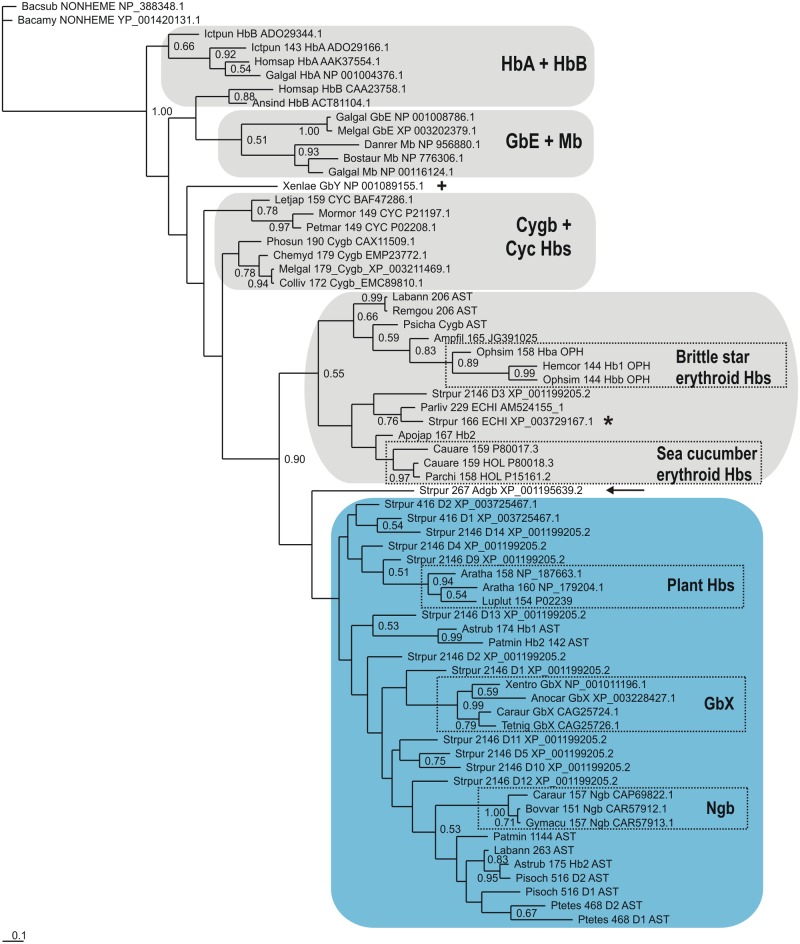
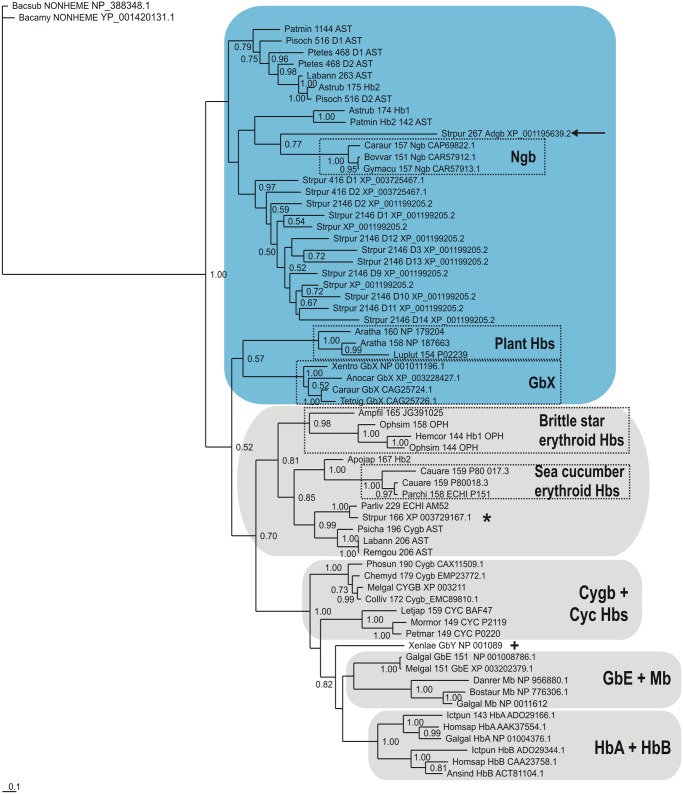
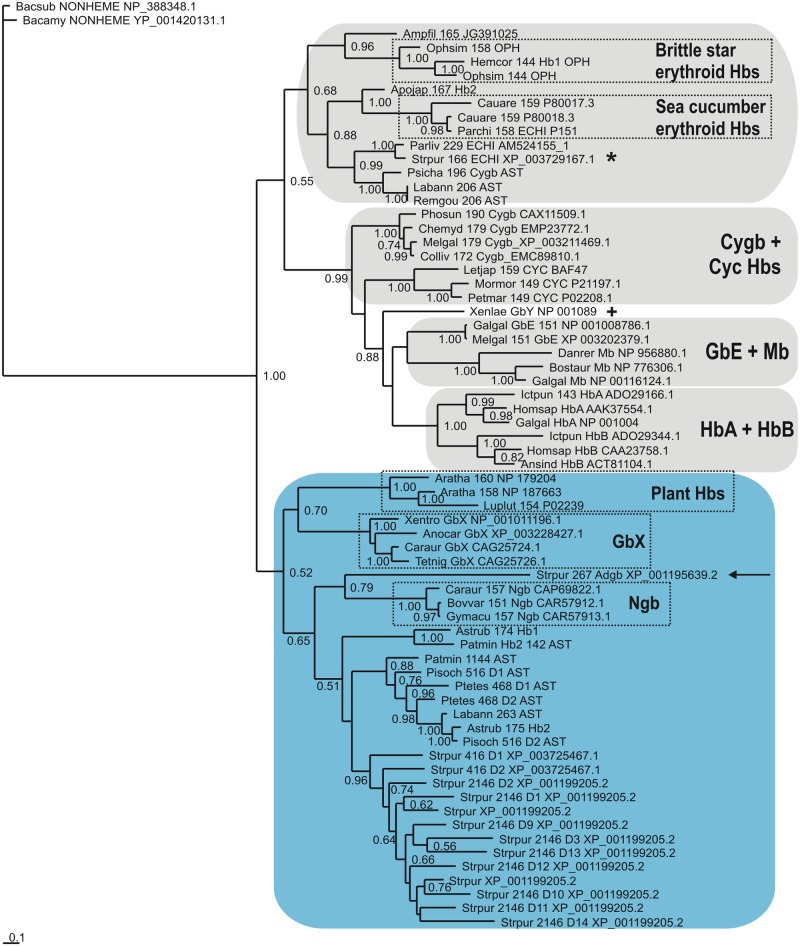
A Bayesian tree based on a MAFFT L-INS-i MSA of 36 echinoderm globins (a reduced set selected upon exclusion of redundant sequences) with 21 vertebrate Hbs (representing the 8 subfamilies) is shown in Fig 2. The sequences are identified by the first 3 letters of the genus and species parts of the binomial, the number of residues, globin subfamily if known, a 3 letter abbreviation of the class and the GenBank identification. We used the nonheme globin from Bacillus subtilis [56] as an outgroup, a successful strategy employed earlier [57, 58]; although this globin exhibits a 3/3 Mb fold, its heme binding cavity is defective due to excessive separation of helical strands. The Cygb branch including GbE, HbA, HbB and the two cyclostome Hbs is clearly separated from the Ngb branch, the latter also including GbX. The Adgb (marked by an arrow) occurs between the GbX’s and the Ngbs, consistent with previous observations [18]. The echinoderm Hbs comprising Group B in Fig 1 cluster next to the Ngbs (shaded light blue), while the echinoderm Hbs from Group A in Fig 1, including the 166 residue globin, XP_003729167.1 (marked by a star), cluster with the Cygbs (shaded grey). This pattern is also observed in trees obtained using alignments generated by T-Coffee Expresso and Clustal Omega, shown in Figs 3 and 4, and the results of analyses obtained using Neighbor Joining and Maximum Likelihood methods were in broad agreement with those of the Bayesian inference method. All our trees reproduce the previously-reported phylogeny of the vertebrate globins, illustrated in S3 Fig. However, due to the high levels of sequence divergence, and relatively short sequence length, sequence-based phylogenies of globins typically feature high statistical uncertainty, irrespective of the alignment method employed, the type of phylogenetic analysis, and the evolutionary models used.
Fig 2. Bayesian phylogenetic tree based on a MAFFT L-INS-i MSA of 36 Echinoderm Hbs and 30 Vertebrate Hbs, using the Bacillus nonheme globin sequence [56], as outgroup.
Fig 3. Bayesian phylogenetic tree based on a T-Coffee Expresso MSA of 36 Echinoderm Hbs and 30 Vertebrate Hbs, using the Bacillus nonheme globin sequence [56], as outgroup.
Fig 4. Bayesian phylogenetic tree based on a Clustal Omega MSA of 36 Echinoderm Hbs and 30 Vertebrate Hbs, using the Bacillus nonheme globin sequence [56], as outgroup.
Structural alignments
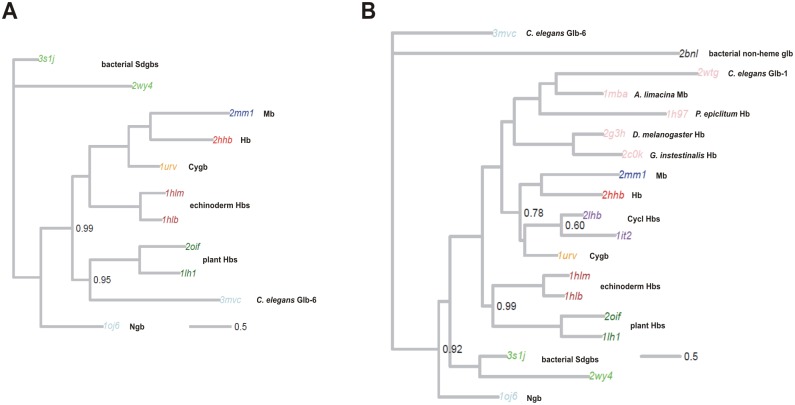
In order to better resolve the uncertain regions of the tree we also generated trees using the StructAlign package [59, 60] which performs joint sampling of alignments and phylogenies and structural superpositions, under a joint evolutionary model for sequences and structures. Since the globin structures are highly conserved, this method allows for more accurate and reliable alignments to be generated, and reduces the uncertainty associated with the resulting trees. Due to the additional computational complexity associated with this approach, StructAlign inference was carried out on smaller datasets containing a selection of representative structures. The two C. arenicola coelomic Hb structures (PDB: 1hlb, 1hlm) were initially combined with a set of 9 additional Hb structures, representing vertebrate Ngb (1oj6), Cygb (1urv), Mb (2mm1), HbB (2hhb), plant Hbs (1lhl, 2oif), bacterial SDgbs (2wy4, 3s1j), and an invertebrate nerve globin (3mvc). In order to assess sensitivity to the choice of dataset, analysis was also re-run after adding in a set of protostome Hbs (1mba, 2wtg, 3g3h, 2c0k, 1h97), as well as two cyclostomes (2lhb, 1it2), and a bacterial nonheme globin (2bnl) as an outgroup. The consensus trees are shown in Fig 5. In both cases the C. arenicola globins are placed between the plant and Cygb clades, recapitulating the pattern seen in the sequence-based trees.
Fig 5. (A) Consensus tree generated by StructAlign, which carries out joint Bayesian inference of alignments and trees under a joint model of sequence and structure evolution.
The structures used here correspond to echinoderm coelomic Hbs (1hlb,1hlm), vertebrate Ngb (1oj6), Cygb (1urv), Mb (2mm1), HbA (2hhb) C. elegans Ngb (3mvc), plant Hbs (2oif, 1lh1), and two bacterial SDgbs (3s1j,2wy4). (B) Tree generated using a larger dataset, consisting of the aforementioned structures augmented with cyclostome Hbs (2lhb, 1it2) A. limacina Mb (1mba), D. melanogaster Hb (2g3h), G. intestinalis Hb (1c0k), C. elegans Glb-1 (2wtg), C. lacteus Ngb (2xki), and an bacterial non-heme globin (1bnl) as an outgroup.
Fig 6 displays a maximum likelihood structural superposition of the echinoderm structure 1hlm (brown) with the Cygb structure 1urv (blue), as generated by StructAlign. In most places there is a very close correspondence between the structures, with some noticeable deviations at helix D, and the C-terminal end of helix G (as labelled). A maximum likelihood structural superposition of the 1urv structure (red) with the extension containing Cygb structure 2dc3 (cyan) essentially results in similar results (S4 Fig).
Fig 6. Structural superposition of the echinoderm structure 1hlm (brown) with the cytoglobin structure 1urv (blue).
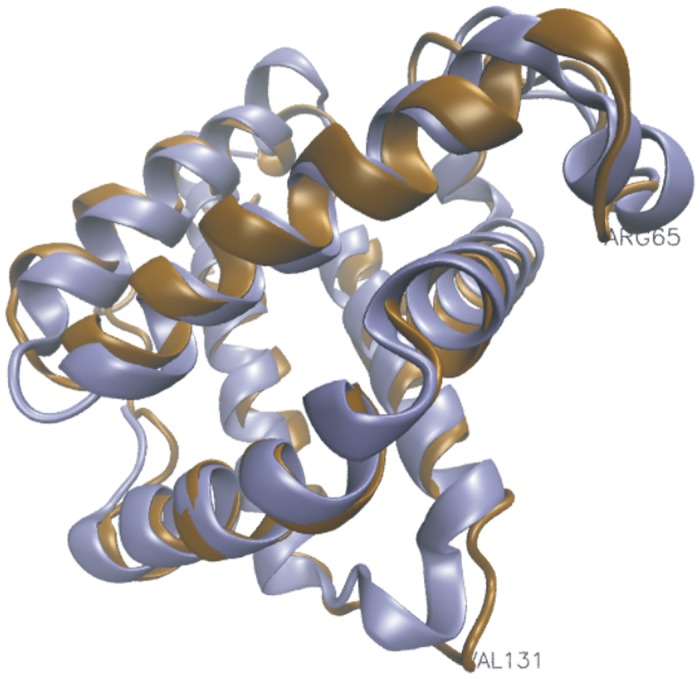
The two structures show a very close correspondence, with some localized deviations, such as at helix D, which is disordered in 1hlm (marked by Arg65), and at the C-terminal end of helix G (marked by Val131).
In order to further investigate the structural features influencing the placement of these two echinoderms closer to Cygb, we conducted an analysis of the per-site root-mean square deviation (RMSD) for pairwise comparisons between the echinoderm structures and Ngb (1oj6) and Cygb (1urv) structures. As shown in Fig 7, the average pairwise RMSD is lower when comparing the echinoderms with 1urv (1.53Å vs. 1.73Å with 1oj6), and the length of the aligned region is also longer (145 residues, versus 141 for 1oj6). There are also some localized regions of higher structural deviation when comparing to 1oj6, for example in between helices C and D, where there is a 2-residue insertion (N45, G46) in 1oj6. The latter difference could have functional implications for the flexibility of the CD corner and formation of the hexacoordinate state. It can also be seen that there are some regions of higher structural deviation with respect to 1urv, especially at the ends of helix G.
Fig 7. Analysis of average per-site root mean square deviation (RMSD) between the echinoderm structures (1hlb, 1hlm) and the Ngb (1oj6) and Cygb (1urv) structures.
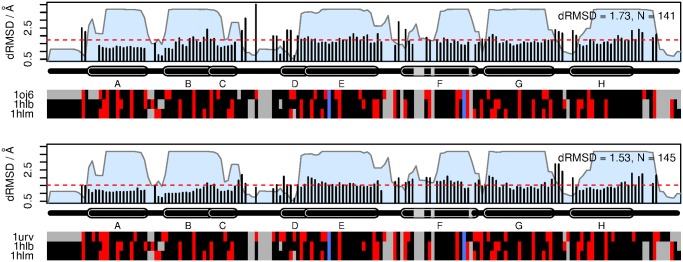
Structural deviation was computed from each of the echinoderms to the target structure of interest as described in the Methods section, using the consensus alignment generated on the larger structural dataset; the mean of these two values computed for each column. Colored blocks at the bottom indicate charged (red) and non-charged (black) residues. Gaps are shown in grey, and the proximal and distal histidines are shown in blue. Helix locations are annotated above, and named using standard conventions. Overall RMSD for each plot is computed as the mean of the squared contributions from each site, and is indicated by the dashed red line. The blue areas underneath indicate the confidence associated with each column in the multiple alignment, as outputted by StructAlign.
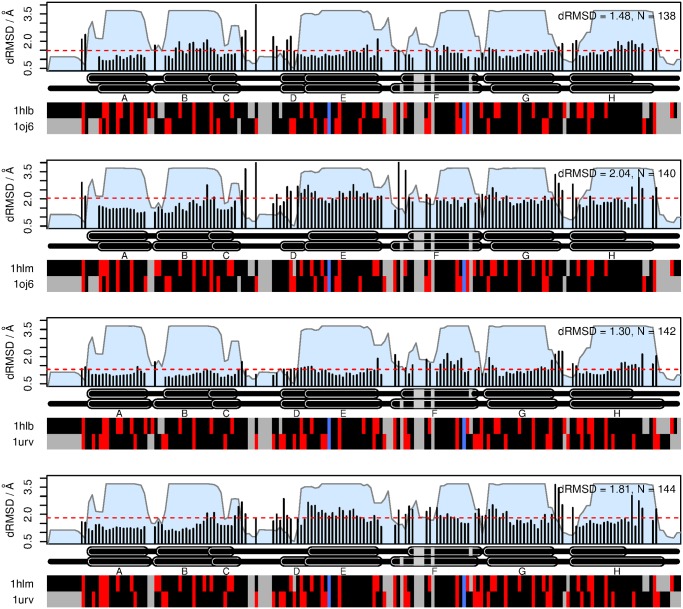
To examine these features in further detail, we conducted individual pairwise comparisons with the two echinoderm structures (Fig 8). These analyses illustrate that the two structures differ significantly in their similarity to Ngb and Cygb, with the structure 1hlm showing a higher overall deviation to both structures (2.04Å and 1.81Å vs. 1.48Å and 1.30Å for 1hlb). There are also more localized differences, such as the large divergence in 1hlm with respect to 1oj6 at the N-terminal end of helix F, and the divergence with respect to both 1oj6 and 1urv at the C-terminal ends of helices G and H. It should also be noted that the D helix is missing in 1hlm, due to the shifted position of the heme group [42].
Fig 8. Analysis of pairwise per-site root mean square deviation (RMSD) between the echinoderm structures (1hlb, 1hlm) and the Ngb (1oj6) and Cygb (1urv) structures.
Colored blocks at the bottom indicate charged (red) and non-charged (black) residues. Gaps are shown in grey, and the proximal and distal histidines are shown in blue. Helix locations are annotated above, and names using standard conventions. Overall RMSD for each plot is computed as the mean of the squared contributions from each site, and is indicated by the dashed red line. The blue areas underneath indicate the confidence associated with each column in the multiple alignment, as outputted by StructAlign.
In summary, while the sequence-only trees place these two echinoderms very close to each other in the tree, there are clear differences in the structures of these proteins, which affect their relative structural similarity to other clades in the tree. Nevertheless, the joint sequence-structure model in StructAlign consistently places these globins between the plant and cytoglobin clades with high posterior probability, providing additional evidence to support the placement of the Group A echinoderms at this position in the tree.
Discussion
Properties of echinoderm hemoglobins
The only echinoderm Hbs that have been studied previously are the coelomic Hbs of sea cucumbers (C. arenicola, P. chilensis) and of brittle stars (H. cordifera [elongata], O. simplex). It is worth noting that only 3 species out of some 2,000 existing brittle star species have been comprehensively investigated and shown to possess coleomic Hb [28]. The coelomocytes circulate in the water vascular system (WVS) [42, 44–46], and are anucleate in the brittle star H. cordifera. Although at least 3 Hbs all having a mass of ca. 16,000 were observed in H. cordifera [34], only two Hbs were found in the coelomocytes of another brittle star O. simplex [27]. The moderate oxygen affinity and cooperativity of oxygen binding of both are consonant with a proposed oxygen transport role.
In holothurians (sea cucumbers), the Hbs are contained within nucleated coelomocytes present within the body cavities, including perivisceral coelom, WVS, and hemal system [37, 44]. In general, the sea cucumbers appear to have several Hbs, with C. arenicola expressing as many as a dozen [38, 44]. Holothurian Hbs exhibit ligand-linked association, existing as homo- or heterodimers when oxygenated and aggregating into tetramers and possibly higher order polymers upon deoxygenation [30, 37, 38], leading to minimal cooperativity, whose physiological role remains unclear. The moderate oxygen binding affinities are again concordant with a transport/storage function [37]. Nothing is known about the biochemical properties of sea urchin and starfish Hbs.
Relationships between vertebrate and echinoderm Hbs
The Bayesian tree based on a MAFFT MSA of echinoderm Hbs (Fig 1), shows them to split into two approximately equal groups of sequences. The trees based on MAFFT, T-CoffeeExpresso and Clustal Omega MSAs of echinoderm and vertebrate Hbs, provided in Figs 2, 3 and 4, respectively, clearly demonstrate the approximately equal division of echinoderm sequences into vertebrate Ngb-like and Cygb-like groups. The previously reported phylogeny of the vertebrate Hbs [14] is reproduced in all our trees, and the sea urchin single domain Adgb (marked by an arrow) is consistently placed next to the Ngb, as found previously [18]. Along with its homologs in the other echinoderm genomes, the S. purpuratus 166 residue Hb (XP_003729167.1), marked by a star in Figs 2, 3 and 4, is placed in the Cygb lineage (shaded grey), while the 2146 residue multidomain Hb (XP_001199205.2) and the 416 residue 2-domain Hb (XP_003725467.1) cluster with the Ngbs (shaded light blue). The two multidomain Hbs are reminiscent of some arthropod Hbs, such as the 9-domain Hb of the brine shrimp Artemia and the 2-domain Hbs of the cladoceran Daphnia [61], whose affiliation to vertebrate Hbs remains to be determined. Recent studies of vertebrate globin phylogeny by Hoffman, Storz and Opazo have shown that in addition to Ngb, there are four distinct vertebrate-specific lineages: (A) Cygb and cyclostome Hbs (Cyc Hbs) (B) Mb and GbE, (C) GbY, and (D), the Hb α- and β-globins [13–17]. We recover the latter four clades in our trees (Figs 2, 3 and 4). GbY is marked by a cross, and the remaining clades are shaded in grey. The brittle star coelomic (erythroid) Hbs cluster separately from the sea cucumber coelomic Hbs, suggesting an independent evolution from a Cygb-like globin lineage. Storz et al. have suggested a convergent cooption scenario for the evolution of erythroid oxygen transport in cyclostomes and jawed vertebrates, i.e. independent evolution of red cell Hbs in both groups [14]. The coelomic Hbs of C. arenicola and P. chilensis are placed close to Cygb in all the trees we generated, supporting the hypothesis that the erythroid oxygen binding function may have evolved independently in echinoderms from a hexacoordinate Cygb.
Although the Ngb-like echinoderm globins are clearly identified, the remaining echinoderm globins appear to be affiliated only with lineage A of Hoffman et al, the Cygb + Cyc Hb globin lineage. No echinoderm globin clusters with any of the remaining three lineages, Mb + GbE, GbY, or the Hb α- and β-globins. Hence, it remains to be established whether the four lineages identified in vertebrates and cyclostomes occur also in echinoderms. The presence of echinoderm globins related to vertebrate Ngbs and Cygbs, evidence for the Ngb and Cygb lineages in echinoderms, suggests that the emergence of the Cygb and Ngb lineages occurred in the ancestor shared by the vertebrates and echinoderms.
Methods
Identification of globin sequences
Putative globins and globin domains were identified from the SUPERFAMILY globin gene assignments (http://supfam.mrc-lmb.cam.ac.uk) [62], and via BLASTP and psiblasT [63], and tblastn searches of the GenBank protein and nucleotide databases. All putative globins were subjected to a FUGUE search [64] (http://www-cryst.bioc.cam.ac.uk), a stringent test of whether a given sequence is a globin [65–68]. Given a query sequence, FUGUE scans a database of structural profiles, calculates the sequence-structure compatibility scores for each entry, using environment-specific substitution tables and structure-dependent gap penalties, and produces a list of potential homologs and alignments. FUGUE assesses the similarity between the query and a given structure via the Z score, the number of standard deviations above the mean score obtained by chance: the default threshold Z = 6.0 corresponds to 99% probability [64].
Multiple sequence alignment and myoglobin-fold criteria
MSA’s were carried out using some of the following algorithms: PROBCONS [69], MAFFT 6.833 [70], Clustal Omega [71], T-Coffee Expresso [72], and MUSCLE 3.7 [73], available at EMBL-EBI (www.ebi.ac.uk/Tools/). The resulting alignments were checked manually for the conservation of the F8 His. Their quality was assessed using GUIDANCE [74]. This algorithm assesses the quality of the MSA via a GUIDANCE score that reflect the robustness of an alignment to guide-tree uncertainty [75]. Furthermore, it also allows the removal of columns from the MSA below a cutoff score (default 0.93). We subjected our MSA’s to several rounds of column trimming until the MSA Guidance scores converged.
All known globin sequences exhibit the Mb-fold [49], the pattern of predominantly hydrophobic residues at 36 conserved, solvent-inaccessible positions, including 33 intra-helical residues defining helices A through H (A8, A11-12, A15, B6, B9-10, B13-14, C4, E4, E7-8, E11-12, E15, E18-19, F1, F4, G5, G8, G11-12-13, G15-16, H7-8, H11-12, H15, and H19), the two inter-helical residues at CD1 and FG4, and the invariant His at F8. Our criteria for a satisfactory globin required a FUGUE Z score >6, a His at the proximal F8 position and presence of helices BC through G.
Molecular phylogeny
Bayesian inference analyses were carried out employing MrBayes version 3.2.2 [76], and the WAG model of amino acid evolution [77], assuming a gamma distribution of evolution rates, as indicated by a ProtTest analysis of the alignment [78]. Two parallel runs, each consisting of four chains were run simultaneously for up to 10x106 generations and trees were sampled every 1000 generations. The final average standard deviations of split frequencies were stationary in all analyses and posterior probabilities were estimated on the final 60–80% trees. The CIPRES web portal was used for the Bayesian analyses [79]. In all Bayesian trees (Figs 1, 2, 3 and 4) support values at branches represent Bayesian posterior probabilities (>0.5). The sequences are identified by the first 3 letters of the genus and species parts of the binomial, the number of residues, globin subfamily if known and a 3 letter abbreviation of the Echinoderm class (AST—Asteroid; ECH—Echiuroid; HOL—Holothuroid; OPH—Ophiuroid).
Maximum likelihood-based (ML) phylogenetic analyses were performed using RAxML version 7.2.3 [80] assuming the WAG model and gamma distribution of substitution rates. The resulting trees were tested by bootstrapping with 100 replicates. Neighbor joining (NJ) analyses were performed using MEGA version 5.2 [81]. Distances were corrected for superimposed events using the Poisson method. All positions containing alignment gaps and missing data were eliminated only in pairwise sequence comparisons (pairwise deletion option). The reliability of the branching pattern was tested by bootstrap analysis with 1000 replications.
In carrying out analyses of echinoderm sequences with globins from other metazoans, we used at least 3 sequences as representatives of each of the Hb subfamilies. For example in the case of vertebrate globins we used at least 3 sequences to represent the Ngbs, Cygbs, Mbs, HbA, HbB, etc: primate, rodent, bird, reptile, amphibian, fish (ray-finned and sharks) and the cyclostome Hbs (lamprey, hagfish) (S3 Table).
Structural analysis
Analyses using the Bayesian model for the joint evolution of sequence and structure were carried out using the StructAlign plugin [59, 60], as part of the StatAlign package [60]. Four independent MCMC chains were run, starting from different initial configurations. The smaller dataset was run for a burn-in period of 1m iterations, followed by a sampling period of 1m iterations, generating 5,000 samples at intervals of 200 iterations for alignments, trees, and model parameters; the larger structural dataset was run for a burn-in period of 10m iterations, and a sampling period of 50m iterations, generating 250,000 samples at intervals of 200 iterations. The sampled trees were used to generate majority consensus trees.
Per-site root-mean square deviation was computed based on the summary alignment generated by StructAlign. For two structures A and B, this is calculated using the following expression
Where d ij(A) is the distance between alpha carbons for residues i and j in structure A, and n is the number of aligned residues, with the sum running over all residues j that are aligned between the two structures. Overall RMSD was computed as the root of the mean of the squared contributions for each alignment column. Use of interresidue distances rather than coordinates allows for the key structural differences to be highlighted without requiring a specific choice of rotational superposition for the structures.
Supporting Information
The Mb fold template [49] consists of predominantly hydrophobic residues at 37 positions, defining helices A through H: A8, A11, A12, A15, B6, B9, B10, B13, B14, C5, CD1, CD4, E4, E7, E8, E11, E12, E15, E18, E19, F1, F4, F8, FG4, G5, G8, G11, G12, G13, G15, G16, H7, H8, H11, H12, H15, and H19. The distal His at E7 and the proximal His at F8 are in red.
(DOC)
(DOC)
(PDF)
(BMP)
(DOC)
(DOCX)
(DOC)
Acknowledgments
We thank the two anonymous reviewers for helpful comments.
Data Availability
All relevant data are within the paper and its Supporting Information files.
Funding Statement
This material is based upon work supported by the National Science Foundation under Grant Number 1036416, "Collaborative Research: Assembling the Echinoderm Tree of Life". The funder had no role in study design, data collection and analysis, decision to publish, or preparation of the manuscript.
References
- 1. Vinogradov SN, Hoogewijs D, Bailly X, Arredondo-Peter R, Guertin M, Gough J, et al. Three globin lineages belonging to two structural classes in genomes from the three kingdoms of life. Proc Natl Acad Sci U S A. 2005;102(32):11385–9. [DOI] [PMC free article] [PubMed] [Google Scholar]
- 2. Burmester T, Weich B, Reinhardt S, Hankeln T. A vertebrate globin expressed in the brain. Nature. 2000;407(6803):520–3. [DOI] [PubMed] [Google Scholar]
- 3. Burmester T, Ebner B, Weich B, Hankeln T. Cytoglobin: a novel globin type ubiquitously expressed in vertebrate tissues. Mol Biol Evol. 2002;19(4):416–21. 11919282 [DOI] [PubMed] [Google Scholar]
- 4. Kawada N, Kristensen DB, Asahina K, Nakatani K, Minamiyama Y, Seki S, et al. Characterization of a stellate cell activation-associated protein (STAP) with peroxidase activity found in rat hepatic stellate cells. J Biol Chem. 2001;276(27):25318–23. [DOI] [PubMed] [Google Scholar]
- 5. Trent JT 3rd, Hargrove MS. A ubiquitously expressed human hexacoordinate hemoglobin. J Biol Chem. 2002;277(22):19538–45. [DOI] [PubMed] [Google Scholar]
- 6. Kugelstadt D, Haberkamp M, Hankeln T, Burmester T. Neuroglobin, cytoglobin, and a novel, eye-specific globin from chicken. Biochem Biophys Res Commun. 2004;325(3):719–25. [DOI] [PubMed] [Google Scholar]
- 7. Roesner A, Fuchs C, Hankeln T, Burmester T. A globin gene of ancient evolutionary origin in lower vertebrates: evidence for two distinct globin families in animals. Mol Biol Evol. 2005;22(1):12–20. [DOI] [PubMed] [Google Scholar]
- 8. Fuchs C, Burmester T, Hankeln T. The amphibian globin gene repertoire as revealed by the Xenopus genome. Cytogenet Genome Res. 2006;112(3–4):296–306. [DOI] [PubMed] [Google Scholar]
- 9. Droge J, Makalowski W. Phylogenetic analysis reveals wide distribution of globin X. Biol Direct. 2011;6:54 10.1186/1745-6150-6-54 [DOI] [PMC free article] [PubMed] [Google Scholar]
- 10. Blank M, Wollberg J, Gerlach F, Reimann K, Roesner A, Hankeln T, et al. A membrane-bound vertebrate globin. PLoS One. 2011;6(9):e25292 10.1371/journal.pone.0025292 [DOI] [PMC free article] [PubMed] [Google Scholar]
- 11. Burmester T, Hankeln T. What is the function of neuroglobin? J Exp Biol. 2009;212(Pt 10):1423–8. 10.1242/jeb.000729 [DOI] [PubMed] [Google Scholar]
- 12. Hankeln T, Ebner B, Fuchs C, Gerlach F, Haberkamp M, Laufs TL, et al. Neuroglobin and cytoglobin in search of their role in the vertebrate globin family. J Inorg Biochem. 2005;99(1):110–9. [DOI] [PubMed] [Google Scholar]
- 13. Hoffmann FG, Opazo JC, Hoogewijs D, Hankeln T, Ebner B, Vinogradov SN, et al. Evolution of the globin gene family in deuterostomes: lineage-specific patterns of diversification and attrition. Mol Biol Evol. 2012;29(7):1735–45. 10.1093/molbev/mss018 [DOI] [PMC free article] [PubMed] [Google Scholar]
- 14. Hoffmann FG, Opazo JC, Storz JF. Gene cooption and convergent evolution of oxygen transport hemoglobins in jawed and jawless vertebrates. Proc Natl Acad Sci U S A. 2010;107(32):14274–9. 10.1073/pnas.1006756107 [DOI] [PMC free article] [PubMed] [Google Scholar]
- 15. Hoffmann FG, Opazo JC, Storz JF. Differential loss and retention of cytoglobin, myoglobin, and globin-E during the radiation of vertebrates. Genome Biol Evol. 2011;3:588–600. 10.1093/gbe/evr055 [DOI] [PMC free article] [PubMed] [Google Scholar]
- 16. Storz JF, Opazo JC, Hoffmann FG. Phylogenetic diversification of the globin gene superfamily in chordates. IUBMB Life. 2011;63(5):313–22. 10.1002/iub.482 [DOI] [PMC free article] [PubMed] [Google Scholar]
- 17. Storz JF, Opazo JC, Hoffmann FG. Gene duplication, genome duplication, and the functional diversification of vertebrate globins. Mol Phylogenet Evol. 2013;66(2):469–78. 10.1016/j.ympev.2012.07.013 [DOI] [PMC free article] [PubMed] [Google Scholar]
- 18. Hoogewijs D, Ebner B, Germani F, Hoffmann FG, Fabrizius A, Moens L, et al. Androglobin: a chimeric globin in metazoans that is preferentially expressed in Mammalian testes. Mol Biol Evol. 2012;29(4):1105–14. 10.1093/molbev/msr246 [DOI] [PMC free article] [PubMed] [Google Scholar]
- 19. Hyman LH. The Invertebrates, Volume IV: Echinodermata: MCGRAW-HILL; 1955. [Google Scholar]
- 20. Lawrence JM. A functional biology of echinoderms.: The John Hopkins University Press, Baltimore; 1987. [Google Scholar]
- 21.Mulcrone RS. "Echinodermata" (On-line), Animal Diversity Web, University of Michigan Museum of Zoology2005. Available from: http://animaldiversity.ummz.umich.edu/accounts/Echinodermata/.
- 22. Bottjer DJ, Davidson EH, Peterson KJ, Cameron RA. Paleogenomics of echinoderms. Science. 2006;314(5801):956–60. [DOI] [PubMed] [Google Scholar]
- 23. Foettinger A. Sur l’existence de l’hemoglobine chez les echinoderms. Arch Biol Paris. 1880;1:405–15. [Google Scholar]
- 24. Lankester ER. A contribution to the knowledge of haemoglobin. Proc Roy Soc Lond. 1872;21:70–81. [Google Scholar]
- 25. Manwell C. Comparative physiology: blood pigments. Annu Rev Physiol. 1960;22:191–244. [DOI] [PubMed] [Google Scholar]
- 26. Smith VJ. Echinoderms 1981. In: Vertebrate Blood Cells [Internet]. New York: Academic Press London; [513–64]. [Google Scholar]
- 27. Christensen AB, Colacino JM, Bonaventura C. Functional and biochemical properties of the hemoglobins of the burrowing brittle star Hemipholis elongata say (Echinodermata, Ophiuroidea). Biol Bull. 2003;205(1):54–65. [DOI] [PubMed] [Google Scholar]
- 28. Hajduk SL, Cosgrove WB. Hemoglobin in an Ophiuroid, Hemipholis elongata . American Zoologist. 1975;15(3):808-. WOS:A1975AK01600139 [Google Scholar]
- 29. Mangum CP. Respiratory function of red blood cell hemoglobins of six animal phyla. Adv Comp Environ Physiol. 1992;13:118–45. [Google Scholar]
- 30. Baker SM, Terwilliger NB. Hemoglobin structure and function in the rat-tailed sea cucumber, Paracaudina chilensis . Biological Bulletin. 1993;185(1):115–22. WOS:A1993LT68700011 [DOI] [PubMed] [Google Scholar]
- 31. Bonaventura C, Bonaventura J, Kitto B, Brunori M, Antonini E. Functional consequences of ligand-linked dissociation in hemoglobin from the sea cucumber Molpadia arenicola . Biochim Biophys Acta. 1976;428(3):779–86. [DOI] [PubMed] [Google Scholar]
- 32. Christensen AB. The properties of the hemoglobins of Ophiactis simplex (Echinodermata, Ophiuroidea). Am Zool. 1998;38:120A. [Google Scholar]
- 33. Manwell C. Oxygen equilibrium of Cucumaria miniata hemoglobin and the absence of the Bohr effect. J Cell Comp Physiol. 1959;53:75–83. [DOI] [PubMed] [Google Scholar]
- 34. Manwell C. Sea cucumber sibling species: polypeptide chain types and oxygen equilibrium of hemoglobin. Science. 1966;152(3727):1393–6. [DOI] [PubMed] [Google Scholar]
- 35. Parkhurst LJ, Steinmeier RC. Kinetics of carbon monoxide binding to the cooperative dimeric hemoglobin from Thyonella gemmata. Analysis of carbon monoxide equilibrium results. Biochemistry. 1979;18(21):4651–6. [DOI] [PubMed] [Google Scholar]
- 36. Steinmeier RC, Parkhurst LJ. Oxygen and carbon monoxide equilibria and the kinetics of oxygen binding by the cooperative dimeric hemoglobin of Thyonella gemmata . Biochemistry. 1979;18(21):4645–51. [DOI] [PubMed] [Google Scholar]
- 37. Terwilliger RC. Oxygen equilibrium and subunit aggregation of a holothurian hemoglobin. Biochim Biophys Acta. 1975;386(1):62–8. [DOI] [PubMed] [Google Scholar]
- 38. Terwilliger RC, Read KR. The hemoglobin of the holothurian echinoderm, Molpadia oolitica Pourtales. Comp Biochem Physiol B. 1972;42(1):65–72. [DOI] [PubMed] [Google Scholar]
- 39. Terwilliger RC, Terwilliger NB. Structure and function of holothurian hemoglobins In: Burke RD, Mladenov PV, Lamert P, Parsley RL, editors. Echinoderm Biology: Proceedings from the 6th international echinoderm conference. Rotterdam: Balkema; 1998. p. 589–95. [Google Scholar]
- 40. Mauri F, Omnaas J, Davidson L, Whitfill C, Kitto GB. Amino acid sequence of a globin from the sea cucumber Caudina (molpadia) arenicola . Biochimica Et Biophysica Acta. 1991;1078(1):63–7. WOS:A1991FR99200011 [DOI] [PubMed] [Google Scholar]
- 41. McDonald GD, Davidson L, Kitto GB. Amino acid sequence of the coelomic C globin from the sea cucumber Caudina (Molpadia) arenicola . J Protein Chem. 1992;11(1):29–37. [DOI] [PubMed] [Google Scholar]
- 42. Mitchell DT, Kitto GB, Hackert ML. Structural analysis of monomeric hemichrome and dimeric cyanomet hemoglobins from Caudina arenicola . J Mol Biol. 1995;251(3):421–31. [DOI] [PubMed] [Google Scholar]
- 43. Suzuki T. Amino acid sequence of a major globin from the sea cucumber Paracaudina chilensis . Biochimica Et Biophysica Acta. 1989;998(3):292–6. WOS:A1989AW60900010 [DOI] [PubMed] [Google Scholar]
- 44. Christensen AB, Christensen EF. Comparison of ophiactid brittle stars possessing hemoglobin using intronic variation In: Johnson C, editor. Echinoderms in a Changing World. London: Taylor & Francis; 2013. p. 127–9. [Google Scholar]
- 45. Kitto GB, Thomas PW, Hackert ML. Evolution of cooperativity in hemoglobins: What can invertebrate hemoglobins tell us? Journal of Experimental Zoology. 1998;282(1–2):120–6. WOS:000075476900013 [PubMed] [Google Scholar]
- 46. Sea Urchin Genome Sequencing C, Sodergren E, Weinstock GM, Davidson EH, Cameron RA, Gibbs RA, et al. The genome of the sea urchin Strongylocentrotus purpuratus. Science. 2006;314(5801):941–52. [DOI] [PMC free article] [PubMed] [Google Scholar]
- 47. Bailly X, Vinogradov SN. The bilatarian sea urchin and the radial starlet sea anemone globins share strong homologies with vertebrate neuroglobins In: Bolognesi M, di Prisco G, Verde C, editors. Dioxygen Binding and Sensing Proteins. New York: Springer Verlag; 2008. [Google Scholar]
- 48. Tu Q, Cameron RA, Worley KC, Gibbs RA, Davidson EH. Gene structure in the sea urchin Strongylocentrotus purpuratus based on transcriptome analysis. Genome Res. 2012;22(10):2079–87. 10.1101/gr.139170.112 [DOI] [PMC free article] [PubMed] [Google Scholar]
- 49. Bashford D, Chothia C, Lesk AM. Determinants of a protein fold. Unique features of the globin amino acid sequences. J Mol Biol. 1987;196(1):199–216. [DOI] [PubMed] [Google Scholar]
- 50. Cameron RA, Samanta M, Yuan A, He D, Davidson E. SpBase: the sea urchin genome database and web site. Nucleic Acids Res. 2009;37(Database issue):D750–4. 10.1093/nar/gkn887 [DOI] [PMC free article] [PubMed] [Google Scholar]
- 51. Du H, Bao Z, Hou R, Wang S, Su H, Yan J, et al. Transcriptome sequencing and characterization for the sea cucumber Apostichopus japonicus (Selenka, 1867). PLoS One. 2012;7(3):e33311 10.1371/journal.pone.0033311 [DOI] [PMC free article] [PubMed] [Google Scholar]
- 52. Kober KM, Bernardi G. Phylogenomics of strongylocentrotid sea urchins. BMC Evol Biol. 2013;13:88 10.1186/1471-2148-13-88 [DOI] [PMC free article] [PubMed] [Google Scholar]
- 53. Kondo M, Akasaka K. Current Status of Echinoderm Genome Analysis—What do we Know? Curr Genomics. 2012;13(2):134–43. [DOI] [PMC free article] [PubMed] [Google Scholar]
- 54. Rowe ML, Elphick MR. The neuropeptide transcriptome of a model echinoderm, the sea urchin Strongylocentrotus purpuratus . Gen Comp Endocrinol. 2012;179(3):331–44. 10.1016/j.ygcen.2012.09.009 [DOI] [PubMed] [Google Scholar]
- 55. Lechauve C, Jager M, Laguerre L, Kiger L, Correc G, Leroux C, et al. Neuroglobins, pivotal proteins associated with emerging neural systems and precursors of metazoan globin diversity. J Biol Chem. 2013;288(10):6957–67. 10.1074/jbc.M112.407601 [DOI] [PMC free article] [PubMed] [Google Scholar]
- 56. Murray JW, Delumeau O, Lewis RJ. Structure of a nonheme globin in environmental stress signaling. Proc Natl Acad Sci U S A. 2005;102(48):17320–5. [DOI] [PMC free article] [PubMed] [Google Scholar]
- 57. Smith DR, Vinogradov SN, Hoogewijs D. Hemoglobins in the genome of the cryptomonad Guillardia theta . Biol Direct. 2014;9(1):7 [DOI] [PMC free article] [PubMed] [Google Scholar]
- 58. Vinogradov SN, Tinajero-Trejo M, Poole RK, Hoogewijs D. Bacterial and Archaeal Globins—a Revised Perspective. Biochim Biophys Acta. 2013;1834(9):1789–800. 10.1016/j.bbapap.2013.03.021 [DOI] [PubMed] [Google Scholar]
- 59. Challis CJ, Schmidler SC. A stochastic evolutionary model for protein structure alignment and phylogeny. Mol Biol Evol. 2012;29(11):3575–87. 10.1093/molbev/mss167 [DOI] [PMC free article] [PubMed] [Google Scholar]
- 60. Herman JL, Challis CJ, Novak A, Hein J, Schmidler SC. Simultaneous Bayesian estimation of alignment and phylogeny under a joint model of protein sequence and structure. Mol Biol Evol. 2014;31(9):2251–66. 10.1093/molbev/msu184 [DOI] [PMC free article] [PubMed] [Google Scholar]
- 61. Weber RE, Vinogradov SN. Nonvertebrate hemoglobins: functions and molecular adaptations. Physiol Rev. 2001;81(2):569–628. [DOI] [PubMed] [Google Scholar]
- 62. Wilson D, Pethica R, Zhou Y, Talbot C, Vogel C, Madera M, et al. SUPERFAMILY—sophisticated comparative genomics, data mining, visualization and phylogeny. Nucleic Acids Res. 2009;37(Database issue):D380–6. 10.1093/nar/gkn762 [DOI] [PMC free article] [PubMed] [Google Scholar]
- 63. Schaffer AA, Aravind L, Madden TL, Shavirin S, Spouge JL, Wolf YI, et al. Improving the accuracy of PSI-BLAST protein database searches with composition-based statistics and other refinements. Nucleic Acids Res. 2001;29(14):2994–3005. [DOI] [PMC free article] [PubMed] [Google Scholar]
- 64. Shi J, Blundell TL, Mizuguchi K. FUGUE: sequence-structure homology recognition using environment-specific substitution tables and structure-dependent gap penalties. J Mol Biol. 2001;310(1):243–57. [DOI] [PubMed] [Google Scholar]
- 65. Hoogewijs D, Dewilde S, Vierstraete A, Moens L, Vinogradov SN. A phylogenetic analysis of the globins in fungi. PLoS One. 2012;7(2):e31856 10.1371/journal.pone.0031856 [DOI] [PMC free article] [PubMed] [Google Scholar]
- 66. Vinogradov SN, Bailly X, Smith DR, Tinajero-Trejo M, Poole RK, Hoogewijs D. Microbial eukaryote globins. Adv Microb Physiol. 2013;63:391–446. 10.1016/B978-0-12-407693-8.00009-1 [DOI] [PubMed] [Google Scholar]
- 67. Vinogradov SN, Fernandez I, Hoogewijs D, Arredondo-Peter R. Phylogenetic relationships of 3/3 and 2/2 hemoglobins in Archaeplastida genomes to bacterial and other eukaryote hemoglobins. Mol Plant. 2011;4(1):42–58. 10.1093/mp/ssq040 [DOI] [PubMed] [Google Scholar]
- 68. Vinogradov SN, Hoogewijs D, Bailly X, Arredondo-Peter R, Gough J, Dewilde S, et al. A phylogenomic profile of globins. BMC Evol Biol. 2006;6:31 [DOI] [PMC free article] [PubMed] [Google Scholar]
- 69. Do CB, Mahabhashyam MS, Brudno M, Batzoglou S. ProbCons: Probabilistic consistency-based multiple sequence alignment. Genome Res. 2005;15(2):330–40. [DOI] [PMC free article] [PubMed] [Google Scholar]
- 70. Katoh K, Standley DM. MAFFT multiple sequence alignment software version 7: improvements in performance and usability. Mol Biol Evol. 2013;30(4):772–80. 10.1093/molbev/mst010 [DOI] [PMC free article] [PubMed] [Google Scholar]
- 71. Sievers F, Wilm A, Dineen D, Gibson TJ, Karplus K, Li W, et al. Fast, scalable generation of high-quality protein multiple sequence alignments using Clustal Omega. Mol Syst Biol. 2011;7:539 10.1038/msb.2011.75 [DOI] [PMC free article] [PubMed] [Google Scholar]
- 72. Tommaso P, Moretti S, Xenarios I, Orobitg M, Montanyola A, Chang JM, et al. T-Coffee: a web server for the multiple sequence alignment of protein and RNA sequences using structural information and homology extension. Nucleic Acids Res. 2011;39:W13–W7. WOS:000292325300003 10.1093/nar/gkr245 [DOI] [PMC free article] [PubMed] [Google Scholar]
- 73. Edgar RC. MUSCLE: multiple sequence alignment with high accuracy and high throughput. Nucleic Acids Res. 2004;32(5):1792–7. [DOI] [PMC free article] [PubMed] [Google Scholar]
- 74. Penn O, Privman E, Ashkenazy H, Landan G, Graur D, Pupko T. GUIDANCE: a web server for assessing alignment confidence scores. Nucleic Acids Res. 2010;38(Web Server issue):W23–8. 10.1093/nar/gkq443 [DOI] [PMC free article] [PubMed] [Google Scholar]
- 75. Penn O, Privman E, Landan G, Graur D, Pupko T. An alignment confidence score capturing robustness to guide tree uncertainty. Mol Biol Evol. 2010;27(8):1759–67. 10.1093/molbev/msq066 [DOI] [PMC free article] [PubMed] [Google Scholar]
- 76. Ronquist F, Teslenko M, van der Mark P, Ayres DL, Darling A, Hohna S, et al. MrBayes 3.2: efficient Bayesian phylogenetic inference and model choice across a large model space. Syst Biol. 2012;61(3):539–42. 10.1093/sysbio/sys029 [DOI] [PMC free article] [PubMed] [Google Scholar]
- 77. Whelan S, Goldman N. A general empirical model of protein evolution derived from multiple protein families using a maximum-likelihood approach. Mol Biol Evol. 2001;18(5):691–9. [DOI] [PubMed] [Google Scholar]
- 78. Abascal F, Zardoya R, Posada D. ProtTest: selection of best-fit models of protein evolution. Bioinformatics. 2005;21(9):2104–5. [DOI] [PubMed] [Google Scholar]
- 79. Miller MA, Pfeiffer W, Schwartz T. Creating the CIPRES Science Gateway for inference of large phylogenetic trees Proceedings of the Gateway Computing Environments Workshop (GCE), 14 November New Orleans, LA: 2010:1–8. [Google Scholar]
- 80. Stamatakis A, Hoover P, Rougemont J. A rapid bootstrap algorithm for the RAxML Web servers. Systematic Biology. 2008;57(5):758–71. 10.1080/10635150802429642 [DOI] [PubMed] [Google Scholar]
- 81. Tamura K, Peterson D, Peterson N, Stecher G, Nei M, Kumar S. MEGA5: molecular evolutionary genetics analysis using maximum likelihood, evolutionary distance, and maximum parsimony methods. Mol Biol Evol. 2011;28(10):2731–9. 10.1093/molbev/msr121 [DOI] [PMC free article] [PubMed] [Google Scholar]
Associated Data
This section collects any data citations, data availability statements, or supplementary materials included in this article.
Supplementary Materials
The Mb fold template [49] consists of predominantly hydrophobic residues at 37 positions, defining helices A through H: A8, A11, A12, A15, B6, B9, B10, B13, B14, C5, CD1, CD4, E4, E7, E8, E11, E12, E15, E18, E19, F1, F4, F8, FG4, G5, G8, G11, G12, G13, G15, G16, H7, H8, H11, H12, H15, and H19. The distal His at E7 and the proximal His at F8 are in red.
(DOC)
(DOC)
(PDF)
(BMP)
(DOC)
(DOCX)
(DOC)
Data Availability Statement
All relevant data are within the paper and its Supporting Information files.


