Abstract
Certain types of implanted medical devices depend on oxygen supplied from surrounding tissues for their function. However, there is a concern that the tissue associated with the foreign body response to implants may become impermeable to oxygen over the long term and render the implant nonfunctional. We report oxygen flux recordings from electrochemical oxygen sensor devices with wireless telemetry implanted in subcutaneous porcine tissues. The devices remained implanted for up to 13 weeks and were removed with adjacent tissues at specified times for histologic examination. There are four main observations: (1) In the first few weeks after implantation, the oxygen flux to the sensors, or current density, declined to a sustained mean value, having unsynchronized cyclic variations around the mean; (2) The oxygen mass transfer resistance of the sensor membrane was negligible compared to that of the tissue, allowing for a sensitive estimate of the tissue permeability; (3) The effective diffusion coefficient of oxygen in tissues was found to be approximately one order of magnitude lower than in water; and (4) Quantitative histologic analysis of the tissues showed a mild foreign body response to the PDMS sensor membrane material, with capillaries positioned close to the implant surface. Continuous recordings of oxygen flux indicate that the tissue permeability changes predictably with time, and suggest that oxygen delivery can be sustained over the long term.
Keywords: Tissue permeability, oxygen mass transfer, long-term implants
I. Introduction
What is the rate of oxygen delivery to a medical device implanted in subcutaneous tissues over the long term? And, What is the permeability to oxygen of tissues that surround implants? These questions are central to the function of implanted devices that depend on the transport of oxygen from the subcutaneous tissues in which they are implanted, such as biosensors for oxygen and other analytes [1,2], polymer-encapsulated pancreatic islets for use in diabetes [3,4], tissue engineered devices containing metabolically active cells [5,6], and implantable electronic devices [7] or fuel cells that rely on the transport of oxygen and metabolic fuels from the tissue environment.
All implants elicit some degree of foreign body response in the surrounding tissues that may be expected to affect tissue permeability [8,9]. The characteristics and magnitude of this response can depend on many things, such as: the properties of the implant and the extent to which it releases even small amounts of irritants into the tissues, such as toxic organic and metallic species, residual sterilants, and ionic current; the type of tissue in which the device is implanted and the local mechanical stresses; the means of introduction of the implant into the tissue; and other factors. The resulting foreign body response may include some or all of the following features: a localized formation of dense and granular tissue, remodeling of the local microvasculature near the tissue-implant interface, the infiltration of granulocytes and macrophages, the development of chronic localized inflammation and tissue edema, and even the formation of a pocket of fluid transudate. Minimizing these affects by proper selection and preparation of implant materials, optimal design and placement of the implant, and the use of appropriate manufacturing and sterilization methods is a common goal.
Although the development of some degree of foreign body response seems unavoidable, little is known about the resulting permeability of the tissues adjacent to implants and how the tissue permeability changes with time. It is necessary to establish quantitative methods for measuring tissue permeability as a basis for the selection of biomaterials and for assessment of the effects of the tissue response on implant function.
Several approaches have been used previously to evaluate the effective permeability of foreign body tissues to oxygen. In one study, a perfusion chamber was implanted against the rat abdominal omentum, having a hydrogel membrane in contact with the tissue on one side and perfused with buffer on the other side [10]. After a 28-day period for stabilization of the tissue neovascularization, samples were collected from the buffer and the oxygen concentration was assayed. The overall permeability to oxygen was estimated to be, 9.4 × 10⁻⁴ cm·s−1 observed by transport through both the tissues and membrane, and separately in vitro through the membrane alone, leading to the conclusion that the oxygen mass transfer resistance of the tissue is comparable to the resistance of the hydrogel membrane. The use of a membrane that is substantially more permeable than the tissue would have been advantageous to assess the limiting mass transfer resistance of the tissue, independent of membrane properties.
An alternative approach based on modeling has also been used to predict the oxygen distribution in tissues around implants. Models have been based the assumption that oxygen distributions can be inferred from tissue structural features seen by post-mortem histologic examination [11,12]. This approach is, however, limited by several factors, including: the lack of an unambiguous means of defining the local oxygen distribution; incorporating the heterogeneous properties of living tissues, such as intermittent microvascular blood flow, diffusion and metabolic consumption of oxygen; and including changes in these properties with time.
Microarchitectural features on the surface of implants have been used to encourage the development of microvascularization at the tissue-implant interface [13], and have enabled maintenance of neovascularization for over 330 days in one study [14]. For comparison, the effective diffusion coefficient of glucose in such fibrotic tissue capsules implanted subcutaneously in rats was estimated to be one to two orders of magnitude lower than the diffusion coefficient in water [15].
We describe here the use of an oxygen sensor device having a wireless RF telemetry system that was implanted in the subcutaneous tissues of pigs to analyze, in conjunction with histology studies, the permeability of foreign body tissues to oxygen over the long term.
II. Methods
II.A. Implant Description
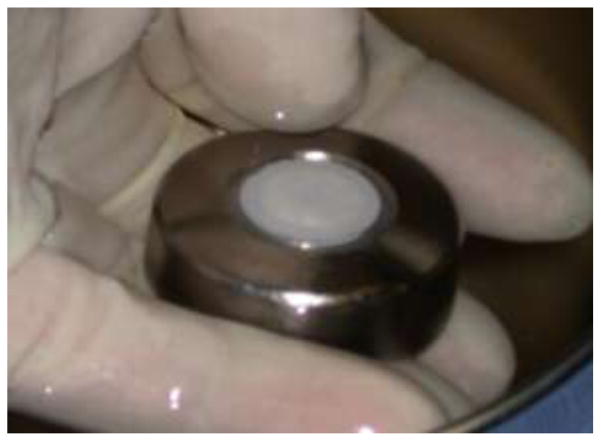
The implant is shown in Figure 1. The ceramic disc on the upper surface is composed of an imbedded sensor array of 300-μm diameter platinum disc sensing electrodes, Ag/AgCl potential reference electrodes, and platinum counter electrodes [2]. The electrodes and disc surface are covered by a thin electrolyte layer and a smooth, 25-μm thick membrane of medical grade polydimethylsiloxane (PDMS). A diffusion-limited reaction, O2 + 2H2O + 4e− → 4OH−, occurs quantitatively at the electrode surface at an applied cathodic potential of −500 mV vs. the Ag/AgCl reference electrode [16]. The pore-free hydrophobic PDMS membrane is permeable to oxygen but not to polar molecules, and prevents current passage into the tissues.
Figure 1.
Oxygen sensor array with integrated wireless telemetry system at implantation. The electrodes are imbedded into a ceramic disc that is hermetically sealed into the titanium housing. The electrodes are covered by a PDMS membrane. The implant is 3.4 cm in diameter and 1.5 cm thick.
The ceramic disc with the sensors is fused into a hermetically sealed titanium housing that contains individual potentiostats for each sensor and a wireless, battery powered telemetry system with a projected 2-year lifetime. The telemetry system samples the currents from individual sensors, converts the samples into multiplexed segments, and transmits the segments as a train of radio frequency signals at regular 2-minute intervals to an external receiver where they are decoded and archived. Inactive implants having identical mass, shape and materials, but lacking internal sensing and telemetry electronics, were used for serial removal and collection of histology samples. Eleven devices with a total of 60 functional sensors and 20 inactive sensors were implanted at four dorsal subcutaneous tissue locations for thirteen weeks in four 20-kg adult female Yucatan minipigs. The PDMS membrane and titanium materials have been evaluated previously in standard cell culture tests [17]. Implants were sterilized using a validated chemical sterilization procedure [18]. The hermetic wireless telemetry system makes possible long-term recordings in animals without infection-prone percutaneous electrical leads.
In related studies, analogous sensors for glucose based on immobilized glucose oxidase coupled dual oxygen sensors have functioned as implants in subcutaneous tissues of pigs for periods as long as 520 days [2]. This sensor system and has also been implanted in humans for extended periods with similar results.
II.B. Implantation Procedure
All procedures involving animals were consistent with AAALAC guidelines [19] and approved by the UCSD Animal Subjects Committee. The implantation procedure emphasized blunt dissection to avoid bleeding and minimize damage to the tissue and lymphatics. Implant locations were chosen on the dorsal skin of the pigs, offset on either side of the midline at a minimum of 15 cm from each other. A 5 cm long, 1 to 2 cm deep incision was made in each location, exposing the dermal layers. Using blunt dissection to ensure minimal damage to the fascia, a pocket was formed between the sub-dermal fat and underlying muscle. Implants were inserted into the pockets with the PDMS surface facing ventrally and the titanium surface facing dorsally. With the properly seated implant inside, the skin was sutured and a povidone-iodine topical antiseptic and sterile dressing were applied. A dual-lumen Hickman catheter (Bard Access Systems) for blood sampling and fluid infusion was placed into the central vena cava with access ports exposed at the midscapular region. The catheter was routinely flushed with a dilute heparin solution to maintain patency.
II.C. Explantation
The animals were given a combination of general and local anesthetics, and an incision was made in the skin, exposing the implant underneath. Tissue samples were excised from regions of the pocket adjacent to the PDMS and titanium surfaces and placed in histological fixative. The incision was sutured and wound site treated with antiseptic. No severe abnormalities, defects or injuries were seen in any of the procedures, indicating healthy tissue and implant pocket. Sterile technique was used in all procedures.
II.D. Model of Oxygen Flux
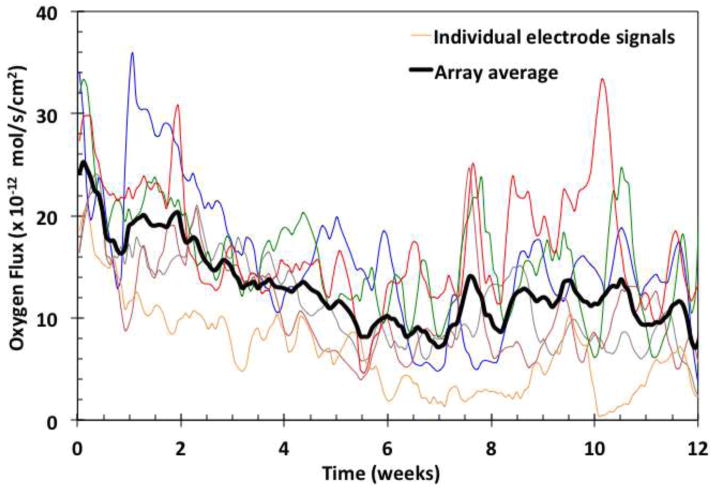
The observed oxygen flux (shown in Figure 2) is described by the product of four terms given sequentially in the descriptive equation below: (1) a quasi-steady state term containing mass transfer parameters and the local oxygen concentration; (2) an exponential decay term; (3) an oscillatory term corresponding to observed cyclic oxygen fluctuations; and (4) a term for the bias or background current produced in the absence of oxygen. Summed over J sensors having K oscillations, the normalized oxygen flux, which is equivalent to the transient current density, is described by
Figure 2.
Examples of individual signals (color) and their moving average (black). Data points were collected from each of the oxygen electrodes every 2 minutes.
| (1) |
where n is the number of electrons per oxygen molecule reduced at the electrode surface, F is the Faraday constant, A is the effective electrode area (with corrections for edge effects [20]), and co is the mean tissue oxygen concentration. Bij , the dimensionless mass transfer Biot number [21], is the ratio of the sensor-specific permeability of the tissue Pj to the permeability of the sensor membrane Pm , or Bij = Pj/Pm . Pm was determined from measurements in the gas phase [22]. The effective permeability of the tissue is given by Pj =hj/δ, where hj is the mass transfer coefficient within the tissue, and δ is the effective diffusional length in the tissue. The mass transfer coefficient represents all mechanisms of oxygen transport that occur in the tissues, including convection to the implant site via the local microvasculature, partial consumption by metabolic processes, and diffusion from the local capillaries to the sensor membrane surface. The magnitude of decay is Mj , where 0 < Mj <1, and τdj is the sensor-specific decay time. The k-th period of oscillation for the j-th sensor is Tj,k with its respective offset time toj,k, where tdj > Tj,k > Toj,k. The sensor-specific background current CJ is typically negligible.
II.E. Immunological Markers
Immunohistochemical stains known to be effective in pigs were used to identify endothelial cells, macrophages and granulocytes in fixed tissue samples. Endothelial cells were labeled using purified mouse anti-rat CD31 unconjugated antibodies (BD Biosciences, Inc.) [23]. Purified mouse anti-CD4+ antibodies (Biosciences, Inc.) [24], which label porcine cells of monocyte/macrophage linage [25] were used to identify macrophages. Anti-pig 6D10 unconjugated antibodies (Abcam, Inc.) [26] were used to label granulocytes [27]. The effectiveness of these markers and their usefulness to identify specific porcine cells was confirmed by a study described in the Appendix.
II.F. Tissue Histology and Quantification
The subcutaneous tissue was fixed for 24 hours in either 10% neutral buffered formalin (Fisher Scientific) for standard histological staining, or in tris-based zinc buffer (BD PharMingen IHC Zinc Fixative, BD Biosciences) for immunohistochemical processing. The use of isotonic fixatives and a slow dehydration protocol using graded alcohols and xylene minimized tissue shrinkage and maintained the proportions of salient features during sectioning and staining. Staining was completed using a horseradish peroxidase/chromogen conjugated enzymatic detection kit (Abcam, Inc.) with goat anti-mouse IgG biotinalated antibodies. Counterstaining was carried out with Mayer’s hematoxylin solution (Sigma-Aldrich).
Slides were viewed on an Olympus VANOX-S slide microscope. Imaging was performed using an Olympus E-30 DSLR with a microscope lens mount. Exposure and sensitivity settings were adjusted during imaging of the segments to maintain consistent camera sensitivity by setting the light intensity to maintain a fixed target output signal based on the internal light meter of the camera.
Regions of interest used for quantification were imaged with a magnification factor of 0.14 μm/pixel. Full resolution images were captured in a raster pattern and were stitched together using software (Adobe Photoshop, Adobe, Inc.). After digital stitching of the images, brightness and contrast levels were adjusted to maintain consistency between slides of a given stain.
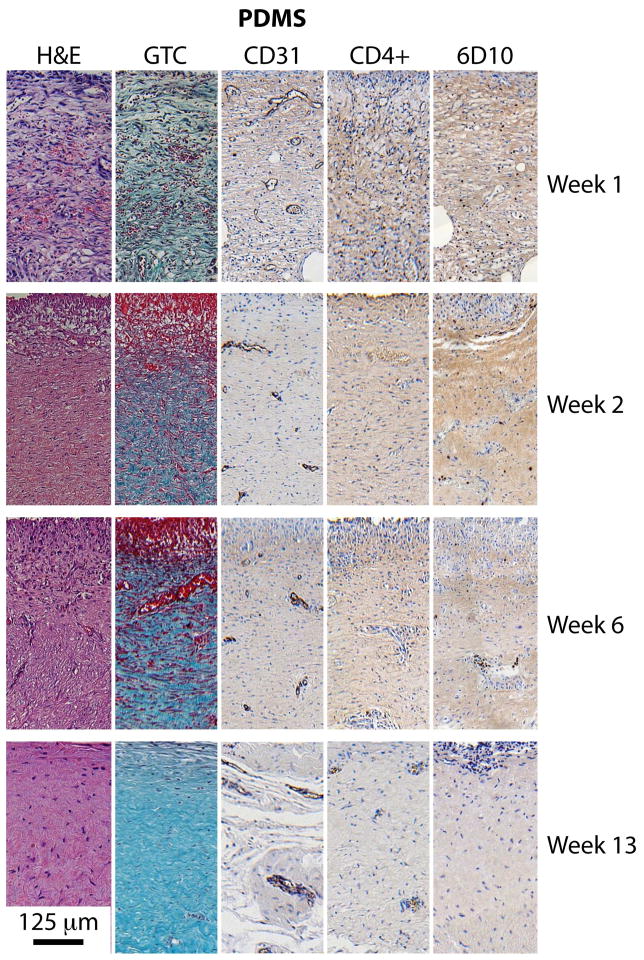
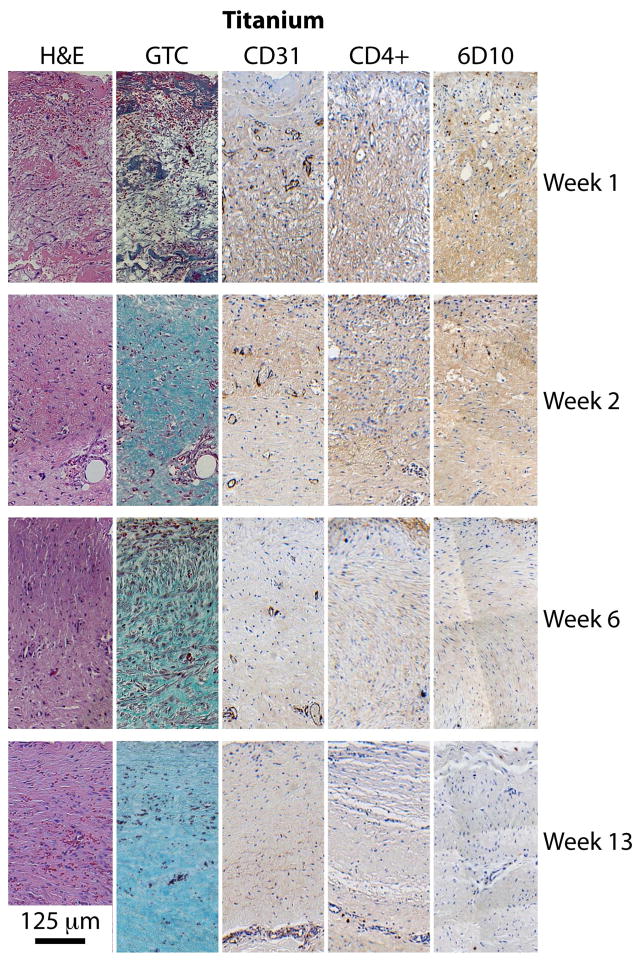
Once a slide was digitally imaged, five regions of 250 μm width and 500 μm depth from the sensor surface were selected for quantitative analysis. From these five regions, one was chosen as reference based on quality of staining and representative feature content. Examples of these regions for each of the five staining methods at four time points (weeks 1, 2, 6 and 13) are presented in Figures 5 and 6 for tissues adjacent to PDMS sensor membrane and titanium control surfaces, respectively.
Figure 5.
Tissue morphology and composition over the course of 13 weeks implantation. Tissues adjacent to the PDMS membrane. Each panel has dimensions of 250μm x 500μm, and the implant surface is at the top.
Figure 6.
Tissues adjacent to titanium container as a control.
Each analyzed region was first split into RGB color channels and passed through a median filter to reduce noise and preserve edges. Histograms of each channel were equalized to the corresponding channel of the reference region, and the image was then reconstructed. The reconstructed image was segmented into 25 μm-deep increments descending from the sensor surface. Thresholds for RGB and NTSC channels were chosen and applied to each slice. Thresholds were manually chosen for every image and verified by comparing to the original image without threshold filtering. The area, solidity ratio, eccentricity ratio, and orientation of the remaining regions were calculated. All image processing and quantification was performed using MatLab algorithms written specifically for this application.
III. Results
III.A Oxygen Flux Recordings
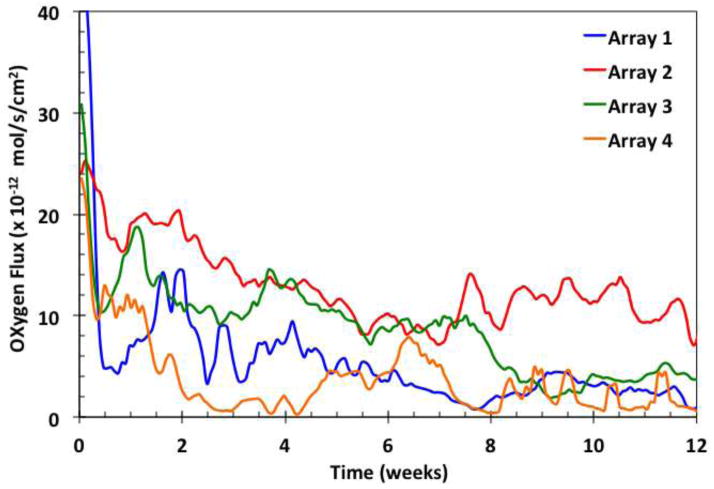
Examples of the oxygen flux from individual sensors of a typical implant are shown in Figure 2 as a function of time in weeks, with individual sensor recordings in respective colors and their moving average in black. There is a gradual decay of the moving average during the first six weeks, with an overlay of unsynchronized, sustained oscillations around the moving average value. The signal oscillations and decay trends reflect the use of the relatively permeable sensor membrane, which was chosen to produce a high degree of sensitivity to oxygen mass transfer in the tissues. The oscillations may be a result of variations in local oxygen concentration, and have been analyzed elsewhere [28]. The signals also contain rapid, small magnitude transients [29], which were removed by filtering. Examples of signal moving averages of sensors in arrays from individual implants are shown in Figure 3.
Figure 3.
Examples of moving averages of signals from four sensor arrays, each with six individual sensors.
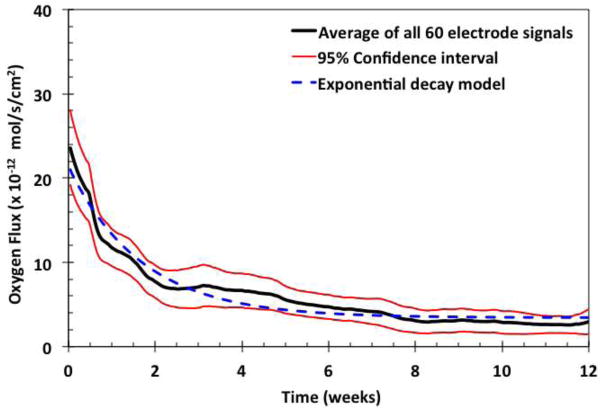
Figure 4 shows the moving average of all signals and the respective 95% confidence intervals. The exponential decay of the average flux is shown by the broken blue line, where the curve fits the equation , where X is approximately 20 × 10−12 mole·s−1·cm−2, Y is approximately 4 × 10⁻¹² mole·s−1·cm−2 (corresponding to about 1×10⁻⁹ amp ), and k is approximately 0.16 week−1 . This fit to the exponential equation indicates that it takes about 3 weeks for the averaged oxygen flux to drop to about 37% of its original value, and thereafter the signal typically approaches an asymptotic average value at 20% of its original value. This exponential decay of tissue permeability may coincide with the time-course of stabilization of the foreign body response.
Figure 4.
Moving average of all sensor signals. Moving averages of sixty electrodes (black) with 95% confidence intervals (red), fitted to an exponential decay curve (broken blue line).
From these experiments, three characteristic types of signal decay were distinguished. Type 1 decay (seen in about 60% of the active sensors) showed an initial drop within 6 to 8 weeks, followed by a sustained value at about 50% of the original signal. Type 2 decay (observed in about 30% of sensors) showed slow decay over 1 to 2 weeks followed by a sustained signal at about 20% of original level. The final signal values of both groups were similar in absolute terms (1×10⁻⁹ amp ), even though the percentage decay and initial values were different. Type 3 decay (seen in < 10% of sensors) showed a slow, monotonic decay over the entire implant period for unknown reasons. These sensors were not included in the analysis.
III.B. Tissue Sample Collection
Tissue samples were harvested with inactive sensors at weeks 1, 2, 6 and with active sensors at week 13, and sectioned in planes normal to the implant surface. The tissue response to the implant was divided into three zones corresponding to the active sensor site at 13 weeks (n = 11), control sites adjacent to inactive sensors at weeks 1 through 6 (n = 5); and control sites adjacent to the titanium housing at weeks 1 through 6 (n = 6). Titanium is a widely accepted control material [9].
III.C. Quantitative Immunohistochemical Analysis
Immunohistochemically stained tissue slices shown in Figures 5 and 6 display markers for various tissue components, including: general morphology and composition (H&E), collagen (GTC), endothelial cells (CD31), macrophages (CD4+), and tissue granulocytes (6D10). The CD31-labeled tissue slices demonstrated microvessels of various dimensions and shapes. Stain intensity was found to be conserved among the variously sized features, which permitted the identification of smaller capillaries. Macrophages stained with CD4+ and granulocytes stained with 6D10 were observable qualitatively, as shown in the Appendix and easily identified computationally, although found in very few numbers and sporadically distributed. No obvious trends could be discerned from CD4+ or 6D10-stained sections.
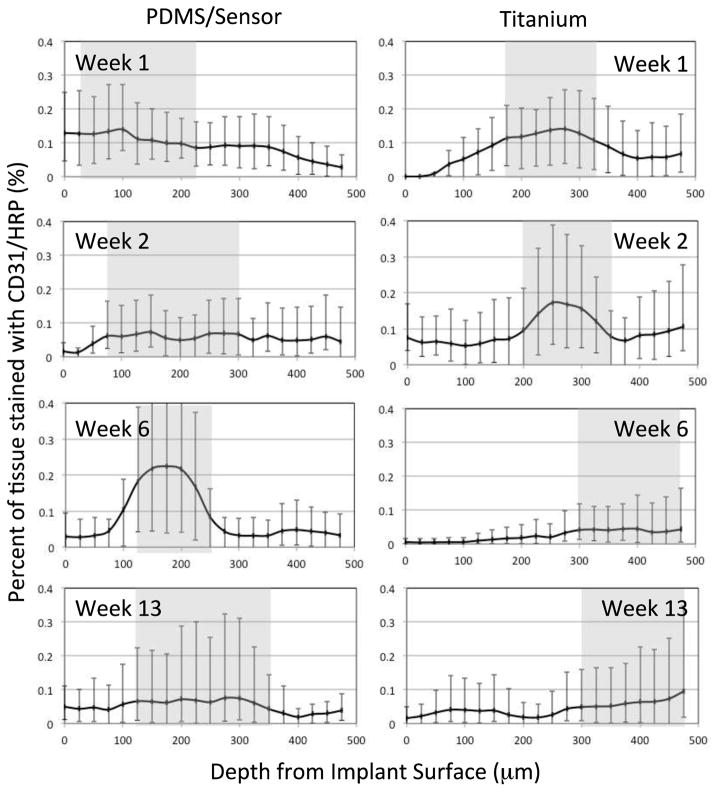
Scaled digital photographs of the type shown in Figure 5 and 6 were processed to calculate the capillary density distribution. Figure 7 summarizes the results from tissue sections adjacent to the PDMS membrane of active and inactive sensors and to titanium control surfaces, stained with CD31 antibodies to indicate vascular endothelial cells. The results obtained at 1, 2, 6, and 13 weeks are reported as the percentage of tissue stained per unit depth from the implant surface, with the tissue region having 50% of the available stain shaded gray. The tissue sections are 25 μm thick and the error bars represent maximal and minimal values. These results show that the highest density of capillaries and other microvessels indicated by the gray band were initially found within approximately 20 to 225 μm from the PDMS membrane (Week 1), but were found within 75 (Week 2) to 350 μm (Week 13) later. By comparison, the highest density of microvascular structures adjacent to the titanium surface were found within approximately 175 to 350 μm during the first two weeks, and at 300 to 475 μm thereafter. The implant materials faced opposite directions (PDMS ventrally, titanium dorsally), and contacted different tissue strata: the PDMS surface was against at the relatively vascular, muscle-rich interior, whereas the titanium surface was against vascular-poor adipose tissue, which may partially explain the differences. Regardless, a similar shift in distribution occurred in both cases, likely as a result of fibrous tissue deposition in front of the implant.
Figure 7.
Quantification of endothelial cell density from CD31 antibody-stained slides as a function of distance from the implant surface. Percentage of 25 x 250 μm tissue sections stained as a function of depth from the implant edge. Shaded areas represent the tissue region having at least 50% of available staining. (Error bars represent minimum and maximum values).
Similar results were found for implants located in various subcutaneous sites in the pigs, including the shoulder, midsection and rear, sites that might be expected to differentially influence the healing process due to possible differences in mechanical environment. There were no statistical differences in capillary density at these different locations (minimum p < 0.12).
III.D. Nuclear and Collagen Density
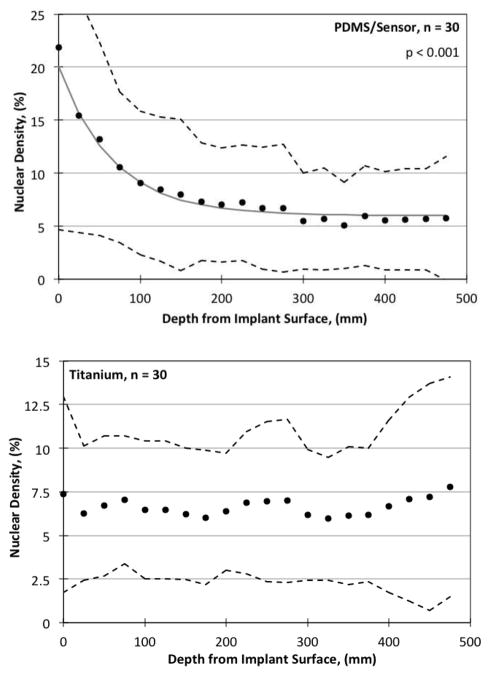
Nuclear density values as a function of depth from the implant surface on Week 13 are summarized for all implants in Figure 8. Filled circles represent the data, and the 10% and 90% data intervals are shown by the broken lines. Image quantification was performed for nuclear density on the H&E stained slides, done by isolating the dark purple/black nuclei from the red/pink/light purple background. Linear regressions were performed on the percent nuclear density both as a function of time and depth, and R2 and p values for the student t-test were calculated for each. For tissues adjacent to PDMS, an exponential decrease in nuclear density was found with respect to depth (p < 0.001), but no trend was found with time. For tissues adjacent to titanium, a linear increase in nuclear density was found as a function of time (p < 0.001) (not shown), but no trend was found with respect to depth (p < 0.01).
Figure 8.
Nuclear density quantified via H&E staining as a function of distance from the implant surface. (Above) PDMS surface. Solid points are averaged values for n points, error bars represent ± S.D., the R2 values are for the linear regression fit, and the p values are from the Student’s t-test. Broken lines are the 10th and 90th percentage signal limits. (Below) Titanium control surface.
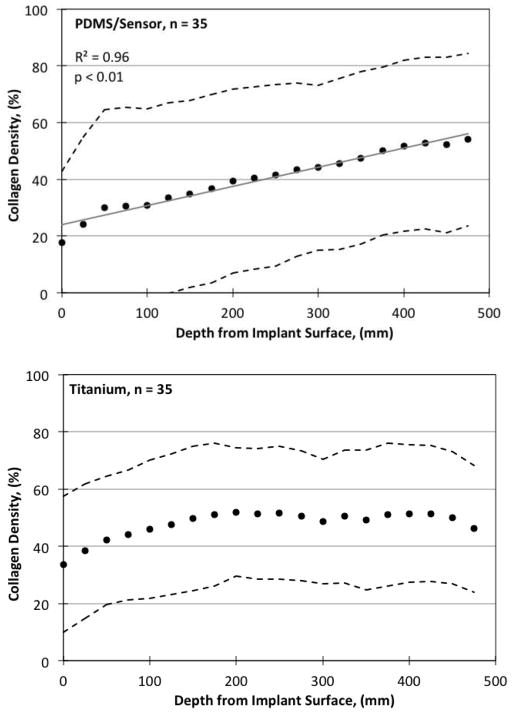
Collagen density as a function of depth from the implant surface is shown at Week 13 in Figure 9. Collagenous material appeared blue/green in GTC-stained slide images and was readily isolated from the remaining pink/red/purple background. For tissues adjacent to PDMS, there was a strong trend both with time (p < 0.001, not shown), and a less prominent, yet statistically significant trend with depth (p < 0.01). For tissues adjacent to titanium, a positive trend found was found for collagen density with time (p < 0.001). There were differences in the degree of fibrosis between tissues adjacent to the active sensors compared to titanium, but no significant differences between tissues adjacent to active versus inactive sensors. All other features showed no statistically significant differences.
Figure 9.
Collagen density quantified by GTC staining as a function of distance from the implant surface. (Above) PDMS surface. (Below) Titanium control surface.
There was a mild fibro-histocytic reaction with associated mild inflammation consisting mainly of histocytes/macrophages, some lymphocytes, and eosinophils in the cavity lining adjacent to the sensor region. There was also mild (< 2 mm) to moderate (3 to 5 mm) fibrosis/fibrous thickening, with mild to moderate fibroblastic activity of the cavity wall surrounding the implant, but no adverse tissue response or neoplasia. Overall, histologic observations were consistent with a typical tissue response expected for an otherwise benign implant of the same size and shape.
IV. Discussion
IV.A. Sensor Stability
To preclude the possibility that the overall changes in individual signals were due to changes in the sensors themselves, a method was developed for sensor-by-sensor comparison of the sensitivity to oxygen prior to implantation and after explantation [22]. This method is based on oxygen measurements in the gas phase, where concentration boundary layers are absent, as an alternative to typical measurements in the liquid phase where precise control of boundary layers for rapidly diffusing species such as oxygen is difficult, and reproducibility of flux measurements is limited. For the vast majority of sensors, which showed no significant differences in sensitivity to oxygen pre-implantation vs. post-explantation, it can be inferred that the sensors remained stable and quantitatively accurate while implanted. Signals from the few sensors that showed statistically significant differences were disregarded. This demonstrable stability of sensors implies that changes in the signal can only have been due to variations in tissue oxygenation or permeability.
IV.B. Oxygen Flux Measurements and Mass Transfer Properties
After the signal decay, the asymptotic oxygen flux was approximately 4×10⁻¹² mole·s−1·cm−2 (Figure 4), with temporal variations about the moving average value. Assuming a mean tissue oxygen concentration of co= 4.0 × 10⁻⁸ mole·cm −3 (corresponding to PO2 = 40mmHg [30]), the steady average oxygen flux gives an estimate of 8.1×10 −5 cm·s −1 for tissue permeability, with a range of 4 to 20 ×10 −5 cm·s −1 . The permeability of the PDMS sensor membrane, determined from studies in the gas phase [22], is 6.45 ×10⁻³ cm·s −1. This gives a value of approximately 0.01 for Bij , the ratio of permeability of the tissue to that of the sensor membrane, or confirming that the tissue permeability is clearly limiting, supporting the conclusion that the signal is sensitive to tissue properties such as encapsulation, variable microvascular perfusion and oxygen oscillations.
The thickness of the oxygen gradient zone in tissues can be estimated as follows. We assume that diffusion is the rate-limiting transport mechanism, and that the main oxygen gradient zone extends from 125 to 350μm adjacent to the PDMS membrane, with a mean of 225μm , (shown by the gray zone at Week 13 in Figure 7). The effective diffusivity of oxygen in tissues given by D = Pδ therefore ranges from 1.8×10⁻⁶ cm−2 · s−1to 2.8×10⁻⁶ cm2 · s−1 , or approximately 8 to 12% of its value in water [31]. The accuracy of this estimate is most sensitive to the deduced length of the diffusion zone in tissues, but the estimate is comparable to values obtained by certain other methods [10,32,33]. For reference, the diffusivity of oxygen in the hydrophilic cellulosic membrane Cuprophane PT-150 is 2.9×10⁻⁶ cm−2 ·s−1 , or 13% of its value in water [31].
IV.C. Signal Decay
The signal decay indicated by values of Mj in Equation (1) ranges from 50 to 80%. As the implantation process temporarily exposes the tissue to atmospheric oxygen, the early phase of decay may correspond to restoration of the microvascular integrity and the reestablishment of normal local tissue oxygen levels. Subsequent decay may be due to a reduction in tissue permeability, corresponding to a reduction in oxygen diffusivity in tissues due to the increase in collagen density. From in vitro studies of materials with high collagen content, the diffusion coefficient of oxygen has been reported to be reduced by as much as 50% [33]. A distancing of the capillaries away from the interface and simultaneous functional adaptation or accomidation of the microvasculature [34] may have also contributed to the decay.
IV.D. Oscillations
The observation of the unsynchronized oscillatory behavior was unanticipated, and not detectable by previous static oxygen sampling methods. Other oscillations at higher frequencies (minutes to hours) corresponding to daily breathing patterns were also observed, but filtered [29]. The cause of the longer oscillations reported here is unknown, but may have been due to a cyclic infiltration of oxygen-consuming immune cells not detected histologically because of the timing of tissue sample collection. It is also plausible that as the animals grew over the course of this study, the tissue in front of the implants was compressed, thereby cyclically attenuating the signals. Further study of oxygen oscillations in tissues may lead to physiologic and metabolic insights.
IV.E. Foreign Body Response
The modest foreign body response observed here may be due, in part, to several unique features of the implant. First, the PDMS membrane and titanium materials have been extensively evaluated in standard in vitro testing, and devices release few irritants [18]. Second, the electrode system was completely isolated electrically from the body, and tissue irritation due to current flux is precluded. Third, although oxygen is quantitatively consumed at the electrode surface, the oxygen concentration at the membrane-tissue interface was non-zero and there was no evidence of local necrosis. Fourth, there was deposition of collagen near the sensor-tissue interface and possible accommodation of the microcirculation, but the tissue apparently remained permeable to oxygen over the long term.
There may also be contributions to the modest foreign body response from the implantation site and insertion method. In the subcutaneous site, the implant remains untethered and relatively isolated from mechanical forces and motion, compared to possible alternative implant sites. This may reduce fibrous deposition associated with static and dynamic mechanical stresses, and mechanically support the microvasculature. The method of implantation based on forming a pocket by blunt dissection emphasizes spreading and stretching of the tissue, rather than incision. This approach likely produces much less damage to the microvasculature and lymphatics, and minimizes the release of blood-borne and intracellular stimulants of tissue activation and inflammation.
Although the current density decayed during first weeks, there remained a sustained average oxygen flux at predictable levels over the 13-week period, and presumably beyond. This calls into question the frequently made assumption that the encapsulation process inevitability blocks the access of small molecules to an implant [35]. However, these results may be due in part to the very mild foreign body response elicited from the implant materials used. These results serve for comparison, but do not imply that other implants which release antigens, cellular fragments, current, metabolic products or other irritants may be expected to perform similarly.
V. Conclusions
The formation of a relatively avascular and collagen-rich foreign body response to an implant may be a universal process. It has been assumed that the resulting tissue becomes impermeable to oxygen over the long term, rendering implants that depend on oxygen supply from the tissues nonfunctional. The sensor-telemetry system used here allowed continuous and sensitive recording of oxygen flux over a 13-week period to test this assumption. The average oxygen flux decayed exponentially to an asymptotic value during the first few weeks, then remained constant to the end of the study, and contained sustained, non-synchronized oscillations. A histologic analysis showed a mild foreign body response, with capillaries close to the implant surface. The mass transfer analysis confirmed that a predictable and sustained supply of oxygen to implanted devices over the long term is feasible.
Acknowledgments
The authors thank the following individuals: A. Chaudhari, P.C. Chen and I. Hueck for their contributions towards the processing of histology samples and image quantification algorithms, A. Mizisin and J. Goor for discussions regarding histology analysis and interpretation.
Funding: This work was supported in part by NIH grants DK64570 and DK77101 to UCSD and DK77254 to GlySens. The content is solely the responsibility of the authors and does not necessarily represent the official views of the National Institute of Diabetes and Digestive and Kidney Diseases or the NIH.
VI. Appendix
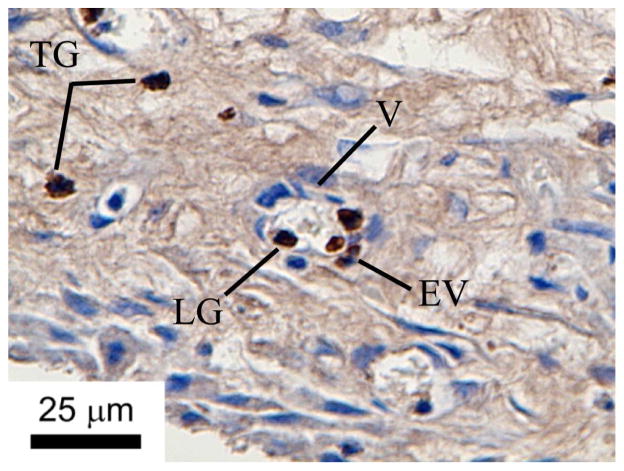
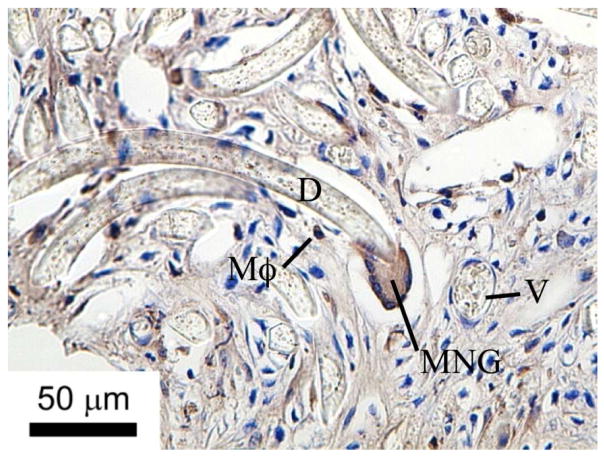
6D10 and CD4+ antibodies that crossreact with porcine antigens are shown to mark granulocytes and macrophages, respectively (see text for protocols). These results demonstrate that porcine granulocytes and macrophages are clearly visible in in the histological sections using the methods described herein, when present.
Figure A1.
Granulocytes labeled with 6D10 antibodies in porcine tissues. TG = tissue granulocytes; LG = lumen granculocyte; EV = extravasated vessel granulocyte; V = vessel.
Figure A2.
Subcutaneous tissue macrophages labeled with CD4 antibodies in porcine tissue. Tissue engulfing embedded Dacron fibers. D = Dacron fiber; V = vessel; Mϕ = macrophage; MNG = multinucleated giant cells.
Footnotes
Author Contributions: LSK collected, processed and analyzed histological samples. JTL, JYL and TLR designed and built the devices and collected the signals. JYL and JTL performed device implantation and removal. DAG carried out the mass transfer analysis. All authors contributed to the preparation of the manuscript. This work is based on LSK’s PhD thesis.
Competing Interests: DAG is founder and consultant to GlySens Incorporated, an arrangement approved by UCSD in accordance with its conflict of interest policies. He is a co-inventor of patents related to the device reported here. JYL is the president and CEO of GlySens Incorporated and a co-inventor of patents related to the device. DAG, JTL, JYL, and TLR have equity interests in GlySens. GlySens is the owner and developer of the device and licensee of intellectual property for some aspects of the technology from UCSD.
Publisher's Disclaimer: This is a PDF file of an unedited manuscript that has been accepted for publication. As a service to our customers we are providing this early version of the manuscript. The manuscript will undergo copyediting, typesetting, and review of the resulting proof before it is published in its final citable form. Please note that during the production process errors may be discovered which could affect the content, and all legal disclaimers that apply to the journal pertain.
References
- 1.Clark LC., Jr Monitor and control of blood and tissue O2 tensions. Trans Amer Soc Artif Intern Organs. 1956;2:41–48. [Google Scholar]
- 2.Gough DA, Kumosa LS, Lin JT, Routh TL, Lucisano JY. Function of an implanted tissue glucose sensor for more than 1 year in animals. Sci Transl Med. 2010;2:42ra53. doi: 10.1126/scitranslmed.3001148. [DOI] [PMC free article] [PubMed] [Google Scholar]
- 3.Dionne KE, Colton CK, Yarmush ML. Effect of hypoxia on insulin secretion by isolated rat and canine islets of langerhans. Diabetes. 1993;42:12–21. doi: 10.2337/diab.42.1.12. [DOI] [PubMed] [Google Scholar]
- 4.Wang T, Lacik I, Brissovà M, Anilkumar AV, Prokop A, Hunkeler D, et al. An encapsulation system for the immunoisolation of pancreatic islets. Nat Biotechnol. 1997;15:358–62. doi: 10.1038/nbt0497-358. [DOI] [PubMed] [Google Scholar]
- 5.Avgoustiniatos ES, Colton CK. Effect of external oxygen mass transfer resistance on viability of immunoisolated tissue. Ann N Y Acad Sci. 1997;831:145–167. doi: 10.1111/j.1749-6632.1997.tb52192.x. [DOI] [PubMed] [Google Scholar]
- 6.Dulong J-L, Legallais C. What are the relevant parameters for the geometrical optimization of an implantable bioartificial pancreas? Trans ASME. 2005;127:1054–60. doi: 10.1115/1.2073407. [DOI] [PubMed] [Google Scholar]
- 7.Mercier PP, Lysaght AC, Bandyopadhyay S, Chandrakasan AP, Stankovic KM. Energy extraction from the biologic battery in the inner ear. Nat Biotechnol. 2012;30:1240–1243. doi: 10.1038/nbt.2394. [DOI] [PMC free article] [PubMed] [Google Scholar]
- 8.Anderson JM. Biological responses to materials. Ann Rev Mater Res. 2001;31:81–110. [Google Scholar]
- 9.Ratner BD, Hoffman AS, Schoen FJ, Lemons JE, editors. Biomaterials Science: An Introduction to Materials in Medicine. 2. San Diego, CA: Elsevier; 2004. p. 537. [Google Scholar]
- 10.Ding Z, Fournier RL. Oxygen and inulin transport measurements in a planar tissue-engineered bioartificial organ. Tissue Eng. 2001;1:25–36. doi: 10.1089/107632702753503027. [DOI] [PubMed] [Google Scholar]
- 11.Sharkawy AA, Klitzman B, Truskey GA, Reichert WM. Engineering the tissue which encapsulates subcutaneous implants. I. Diffusion properties. J Biomed Mater Res. 1997;37(3):401–412. doi: 10.1002/(sici)1097-4636(19971205)37:3<401::aid-jbm11>3.0.co;2-e. [DOI] [PubMed] [Google Scholar]
- 12.Sharkawy AA, Klitzman B, Truskey GA, Reichert WM. Engineering the tissue which encapsulates subcutaneous implants. II. Plasma-tissue exchange properties. J Biomed Mater Res. 1998;40:586–597. doi: 10.1002/(sici)1097-4636(19980615)40:4<586::aid-jbm10>3.0.co;2-e. [DOI] [PubMed] [Google Scholar]
- 13.Brauker JH, Carr-Brendel VK, Martinson LA, Crudele J, Johnston WD, Johnson RC. Neovascularization of synthetic membranes directed by membrane architecture. J Biomed Mater Res. 1995;29:1517–1524. doi: 10.1002/jbm.820291208. [DOI] [PubMed] [Google Scholar]
- 14.Padera RF, Colton CK. Time course of membrane microarchitecture-driven neovascularization. Biomaterials. 1996;17:277–284. doi: 10.1016/0142-9612(96)85565-7. [DOI] [PubMed] [Google Scholar]
- 15.Freeman CL, Mayhan KG, Picha GJ, Colton CK. A study of the mass transport resistance of glucose across rat capsular membranes. Matls Res Soc Symp Proc. 1989;110:773–778. [Google Scholar]
- 16.Jacq J, Bloch O. Formation d’eau oxygenee au cours de la reduction electrochimique de l’oxygenen in milieu alcalin sur differentes cathodes. Electrochim Acta. 1964;9:551. [Google Scholar]
- 17.In vitro tests for cytotoxicity, sensitization, irritation, and genotoxicity.
- 18.ANSI/AAMI/ISO, 14160 - Sterilization of single-use medical devices incorporating materials of animal origin—validation and routine control of sterilization by liquid chemical sterilants. 1998.
- 19.Grossblatt N, editor. Guide for the Care and Use of Laboratory Animals. Natl. Acad. Press; Washington, D.C: 1996. [Google Scholar]
- 20.Jablecki M. PhD Thesis. University of California; San Diego: 2002. Analysis of key parameters in glucose sensors. [Google Scholar]
- 21.Incropera FP, DeWitt DP, Bergman TL, Lavine AS. Fundamentals of Heat and Mass Transfer. 6. John Wiley & Sons; New York, NY: 2007. [Google Scholar]
- 22.Makale M, Jablecki MC, Gough DA. Mass transfer and gas-phase calibration of implanted oxygen sensors. Anal Chem. 2004;76:1773–1777. doi: 10.1021/ac0352169. [DOI] [PubMed] [Google Scholar]
- 23.Biosciences, Inc. data sheet: Anti-CD31 550300 [Google Scholar]
- 24.Abcam, Inc. data sheet: Anti-CD4 [clone74-12-4] :ab25276. [Google Scholar]
- 25.Wood GS, Warner NI, Warnke RA. Anti-Leu-3/T4 antibodies react with cells of monocyte/macrophage and Langerhans lineage. J Immunol. 1983;131(1):212–216. [PubMed] [Google Scholar]
- 26.Abcam, Inc. data sheet: Anti-Granulocytes antibody [ clone 6D10] :ab67425. [Google Scholar]
- 27.Pérez C, Revilla C, Alvarez B, Chamano S, Corea E, et al. Phenotypic and functional characterization of porcine granulocyte developmental stages using two new markers. Dev Comp Immunol. 2007;31(3):296–306. doi: 10.1016/j.dci.2006.06.002. [DOI] [PubMed] [Google Scholar]
- 28.Kumosa LS. PhD Thesis. University of California; San Diego: 2011. Long-term oxygen sensor implantation in the porcine subcutaneous environment. [Google Scholar]
- 29.Moshirvaziri S. PhD Thesis. University of California; San Diego: 2010. Characterization of short-term oxygen sensor signal response. [Google Scholar]
- 30.Tsai AG, Johnson PC, Intaglietta M. Oxygen gradients in the microcirculation. Physiol Rev. 2002;83:933–963. doi: 10.1152/physrev.00034.2002. [DOI] [PubMed] [Google Scholar]
- 31.Gough DA, Lepoldt JK. A novel rotated disc electrode and time lag method for characterizing mass transport in liquid-membrane systems. AIChE J. 1980;26:1013–1019. [Google Scholar]
- 32.MacDougall JDB, McCabe M. Diffusion coefficient of oxygen through tissues. Nature. 1967;215:1173–1174. doi: 10.1038/2151173a0. [DOI] [PubMed] [Google Scholar]
- 33.Ramanujan S, Pluen A, McKee T, Brown EB, Boucher Y, Jain R. Diffusion and convection in collagen gels: implications for transport in the tumor interstitium. Biophys J. 2002;83(3):1650–60. doi: 10.1016/S0006-3495(02)73933-7. [DOI] [PMC free article] [PubMed] [Google Scholar]
- 34.Pries AR, Reglin B, Secomb TW. Structural adaptation of microvascular networks. Oxygen gradients in the microcirculation. Physiol Rev. 2002;83:933–963. [Google Scholar]
- 35.Wisniewski N, Klitzman B, Miller B, Reichert WM. Decreased analyte transport through implanted membranes: differentiation of biofouling from tissue effects. J Biomed Mater Res. 2001;57(4):513–521. doi: 10.1002/1097-4636(20011215)57:4<513::aid-jbm1197>3.0.co;2-e. [DOI] [PubMed] [Google Scholar]


