Abstract
Reading speed for English text is slower for text oriented vertically than horizontally. Yu, Park, Gerold, and Legge (2010) showed that slower reading of vertical text is associated with a smaller visual span (the number of letters recognized with high accuracy without moving the eyes). Three possible sensory determinants of the size of the visual span are: resolution (decreasing acuity at letter positions farther from the midline), mislocations (uncertainty about the relative position of letters in strings), and crowding (interference from flanking letters in recognizing the target letter). In the present study, we asked which of these factors is most important in determining the size of the visual span, and likely in turn in determining the horizontal/vertical difference in reading when letter size is above the critical print size for reading. We used a decomposition analysis to represent constraints due to resolution, mislocations, and crowding as losses in information transmitted (in bits) about letter recognition. Across vertical and horizontal conditions, crowding accounted for 75% of the loss in information, mislocations accounted for 19% of the loss, and declining acuity away from fixation accounted for only 6%. We conclude that crowding is the major factor limiting the size of the visual span, and that the horizontal/vertical difference in the size of the visual span is associated with stronger crowding along the vertical midline.
Keywords: visual span, crowding, reading, vertical text, acuity, mislocation
Introduction
Reading is an essential daily activity heavily reliant on vision. Extensive research conducted on the psychophysics of reading in the past two decades suggests that the size of the visual span, the number of letters in text that can be recognized reliably without moving the eyes, is a sensory bottleneck limiting reading speed (Legge, 2007; Legge et al., 2007; Legge, Mansfield, & Chung, 2001; Pelli et al., 2007; Yu, Cheung, Legge, & Chung, 2007). A visual-span profile, a plot of letter-recognition performance (proportion correct) as a function of letter position relative to fixation, is measured with a letter-recognition task using trigrams (strings of three random letters), and depicts the sensory information available for letter recognition during reading. A possible causal connection between visual-span size and reading speed has been demonstrated in an ideal-observer model (Legge, Hooven, Klitz, Mansfield, & Tjan, 2002; Legge, Klitz, & Tjan, 1997). Strong correlation between the two measurements has been revealed empirically in many studies (e.g., Legge et al., 2007; Yu et al., 2007; Yu, Park, Gerold, & Legge, 2010). Quantitatively, an increase of one letter recognized perfectly in the visual span represents an increase of 4.7 bits of information and is associated with an increase in reading speed by about 40% (Legge et al., 2007).
The size of the visual span may be limited by three sensory properties: (a) decreasing resolution (letter acuity decreasing away from the midline), (b) mislocations (errors in the sequence of letters due to uncertainty about relative position of letters in strings, and (c) crowding (the interfering effects of flanking letters) (Legge, 2007). In the present study, we investigated how these factors influence changes in the size of the visual span through a decomposition analysis.
Letter acuity decreases linearly with eccentricity (Anstis, 1974) following the relationship: S = S0 (1 + E/E2), where S is the acuity letter size at retinal eccentricity E (distance from fovea), S0 (typically near 0.083° or 5 min-arc) represents the letter size at acuity threshold at central fovea, and E2, a constant (about 1.5°–2.5°: Coates, Chin, & Chung, 2013; Herse & Bedell, 1989; Latham & Whitaker, 1996), stands for the retinal eccentricity at which acuity size is twice that of S0. For a given letter size, we can calculate the eccentricity E at which the letter size is at the acuity threshold, and then estimate the number of letters that can be fit into the space within the eccentricity of E. For example, given a letter size of 0.55°, an isolated letter in Courier font can be identified accurately up to about 11 character positions from fixation (assuming that letter-to-letter spacing follows the standard, 1.16 × x width, and E2 = 1.5). This example implies that acuity would only limit the visual span for letters more than 10 letter spaces from the midline.
Crowding refers to the adverse interference of neighboring objects on target identification (Levi, 2008; Pelli, Palomares, & Majaj, 2004; Whitney & Levi, 2011). Letters presented in text are normally flanked by other letters, resulting in a reduction in recognition performance due to crowding. Crowding is prominent in peripheral vision (Bouma, 1970; Flom, Weymouth, & Kahneman, 1963). The greater the distance of the flanked letter is from fixation, the more crowding results (as demonstrated in Figure 3B). It has been proposed that crowding is the key process responsible for the slow reading speeds exhibited in peripheral vision (Pelli et al., 2007). While the investigation of the underlying mechanism of crowding is ongoing, it has been suggested that crowding reflects a failure in the object recognition process beyond the feature detection stage and probably at the feature integration stage (Chung, Levi, & Legge, 2001; He, Cavanagh, & Intriligator, 1996; Levi, Hariharan, & Klein, 2002; Pelli et al., 2004). For a letter in text, the extent of crowding depends on whether the letter is flanked on one or both sides. It is known that flankers on the outward side (away from the fovea) produce more crowding than letters on the inward side (Bouma, 1973). Our method for compiling visual-span profiles (see Methods) averages over these cases. However, we are able to dissect the visual-span profile into sub-profiles revealing the differences in letter recognition associated with the different flanker configurations (see examples in Figure 4).
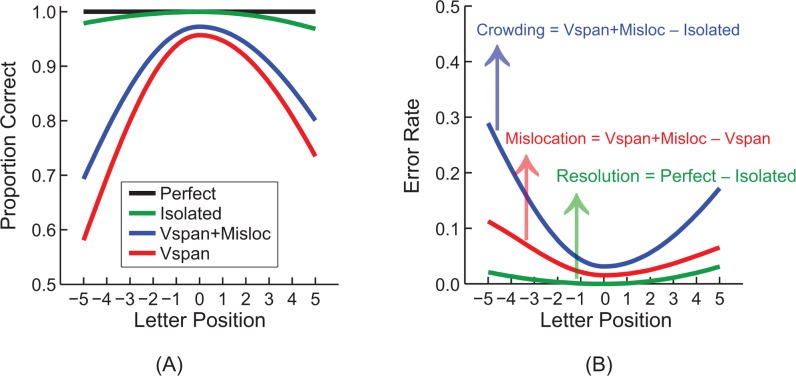
Figure 3.
(A) Sample profiles (proportion correct plotted as a function of letter position) used in the decomposition analysis—the perfect profile corresponds to 100% recognition performance; the isolated profile is for the recognition of single letters; the visual-span profile (the red curve labeled as “Vspan”) is for the identification performance in the trigram test; and the mislocation-corrected visual-span profile (the blue curve labeled as “Vspan+Misloc”) is for the trigram identification performance without considering localization accuracy. (B) Examples of difference curves (error rate plotted as a function of letter position). The green curve is obtained by subtracting the isolated-letter profile from the perfect profile. The area under the green curve shows the reduction in performance due to decreased acuity. The blue curve, a plot of the difference between the isolated-letter profile and the mislocation-corrected visual-span profile, represents the effect of crowding. The red curve shows the decrease in performance due to mislocation errors.
Figure 4.
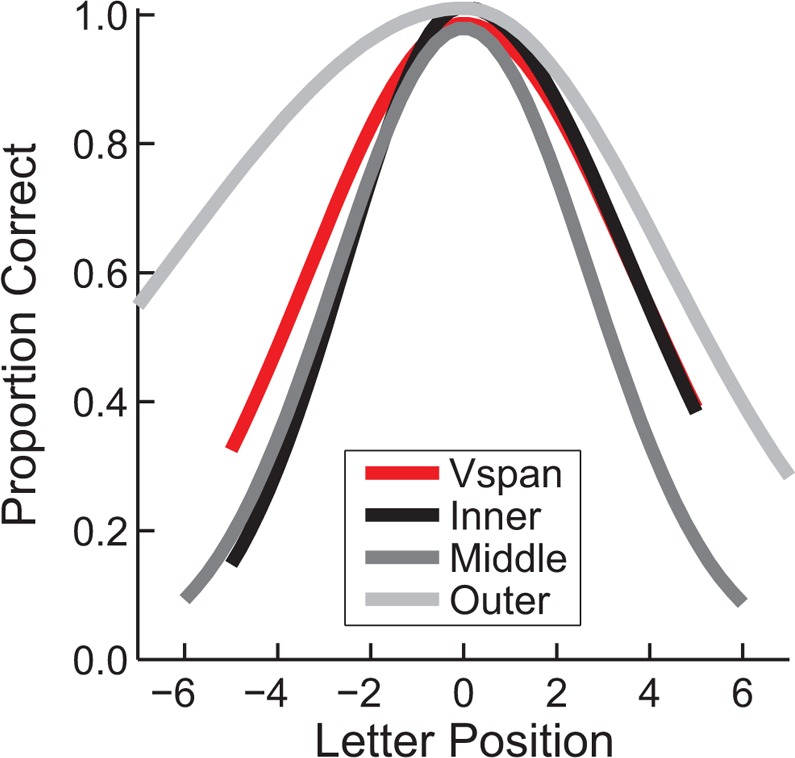
Examples of a visual-span profile and its three sub-profiles. The inner, middle, and outer curves are separate profiles obtained in the trigram test, one for each of the three within-trigram letter positions.
Word recognition requires not only correct identification of the letters but also accurate recognition of the spatial arrangement of letters. In the visual-span measurement, a letter is scored as correct only when its identity is reported at the correct letter position. Errors in the spatial order of letters are termed mislocations and affect the size of the visual span. This kind of confusion has been analyzed separately from identification errors (Strasburger & Malania, 2013; Zhang, Zhang, Liu, & Yu, 2012). It has been shown that the coding of letter position becomes less precise with increasing eccentricity resulting in inaccurate reporting of the spatial order of letters (Chung & Legge, 2009).
It is likely that crowding and mislocations represent errors in position labeling at two different bottom-up stages of letter recognition. Crowding may reflect a failure in segmenting one letter from its neighbors because of errors in assigning positions to the sensory features of the letters. The result would be inappropriate spatial pooling or scrambling of features between letters (Pelli et al., 2004). Mislocations may indicate errors in assigning positions to letters after they have been identified. This view is consistent with the proposal that position errors for features should be distinguished from position errors for letters (Strasburger, Rentschler, & Jüttner, 2011). Here, we adopt a decomposition analysis (He, Legge, & Yu, 2013) that will help us understand sensory constraints at three sequential stages of information processing culminating in the formation of the visual span: (a) availability of raw sensory information for letter recognition (letter acuity measurements); (b) segmentation of features into clusters representing letters (crowding measurements); and (c) labeling letters with appropriate position signals (mislocation measurements). The results of the decomposition analysis can help us better explain why reading speed and visual-span size change with spatial layout and physical properties of letters (Legge et al., 2001), and ultimately lead us to a better understanding of the processes involved in letter recognition and reading.
Yu et al. (2010) compared reading speeds and visual-span sizes for four text formats (Figure 1). Reading speed for marquee text (upright letters arranged in a vertical column) was 42% of horizontal reading speed, and the reading speeds for 90° clockwise or counterclockwise rotation of text lines were 55% of the horizontal speed. They also found that the slower reading of vertical text is associated with reduced visual-span size for the vertical formats. In the present study, we applied a decomposition analysis of the visual-span profiles to determine the factors accounting for this difference.
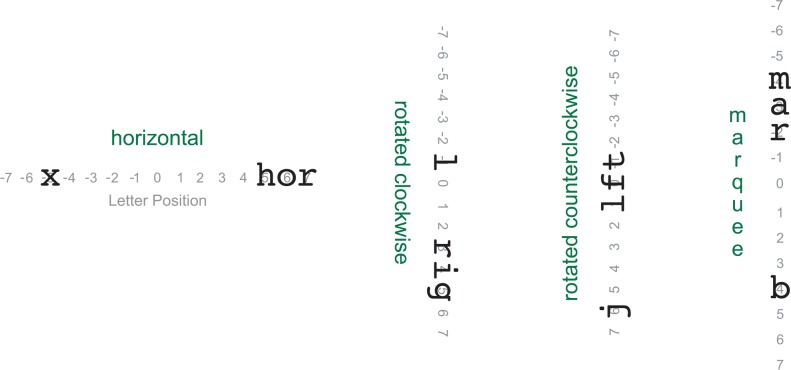
Figure 1.
Examples of isolated letters and trigrams presented in the four text formats: horizontal, rotated clockwise, rotated counterclockwise, and marquee. Position 0 represents the location of the fixation point. Each stimulus was presented either at fixation, or at a letter position left or right of the midline for the horizontal text format, or above or below the midline for the three vertical text formats. For each format, there were 13 tested letter positions (ranging from −6 to 6). In the horizontal condition, the trigram “hor” is located in letter position 6 with the three letters presented at positions 5 (“h”), 6 (“o”), and 7 (“r”) to the right of the midline, respectively. The isolated letter “x” is positioned at slot −5. For the rotated clockwise condition, the trigram “rig” is presented at position 4 and the letter string covers letter positions 3 to 5 along the vertical midline. The same positioning rule is applied to the marquee condition. The position of marquee trigram “mar” is −3 in the upper visual field, indicating that letters “m” and “r” are at positions −4, and −2, respectively. Unlike the other two vertical formats, the rotated counterclockwise condition has trigram letters arranged from bottom to top. The trigram “lft” is presented at position 0, with the letter “l” at position 1 and the letter “t” at position −1.
Our results indicated that the narrower visual spans in the vertical direction were due to greater crowding along the vertical midline than the horizontal midline. Although stronger crowding along the vertical versus the horizontal midline was present in the data described by Toet and Levi (1992), these authors did not explicitly comment on this asymmetry in crowding. We are not aware of other reports of this asymmetry in the literature. To confirm this crowding asymmetry, we conducted an auxiliary experiment with a traditional method to assess crowding along the horizontal and vertical midlines.
The main goal of this study is to determine the contributions of sensory factors accounting for the difference in horizontal and vertical visual spans.
Methods
Participants
Ten normally-sighted, native-English-speaking young adults (aged 19 to 27) were recruited from the University of Minnesota. All subjects signed an IRB-approved consent form before beginning testing. None of them had prior experience with the vertical text stimuli used in this study.
Apparatus and stimuli
The experimental stimuli were generated and presented on a Sony Trinitron color graphic display (model: GDM-FW900; refresh rate: 76 Hz; resolution: 1600 × 1024) by a Power Mac G4 computer (model: M8570; Apple, Inc., Cupertino, CA) running MATLAB 5.2.1 with the Psychophysics Toolbox extensions (Brainard, 1997; Pelli, 1997). The stimuli were 26 lowercase alphabet letters in Courier font, a serif font with fixed width. All stimuli were rendered as black characters on a white background (87.7cd/m2) with Weber contrast higher than −99%. The print size (defined as the height of the lowercase letter x) was 0.55° of visual angle that exceeds the critical print size (the smallest print size at which subjects can read at their maximum reading speed) for all four text formats (Yu et al., 2010). A viewing distance of 40 cm was used.
Subjects read randomly selected isolated letters and strings of three random letters (trigrams) presented in four different formats: horizontal, rotated clockwise (90°), rotated counterclockwise (90°), and marquee (shown in Figure 1). Marquee text is composed of upright letters arranged vertically. Standard center-to-center letter spacing (used in normal Courier text), defined as 1.16 times the width of the lowercase letter x, was used in the horizontal, rotated clockwise, and rotated counterclockwise conditions. There is no existing standard for letter spacing of marquee formatted text. Following the previous study on vertical reading by Yu et al. (2010), we adopted the minimum nonoverlapping letter spacing (1.67 × x-width) as the standard for marquee text. Note that this letter spacing is still 44% larger than the other three text formats (see Discussion section for further comments).
Measuring visual-span profiles and isolated-letter profiles
We measured two types of letter-recognition profiles, visual-span profiles and isolated-letter profiles. Stimuli used for the measurement of visual-span profiles were trigrams, random strings of three letters selected from the 26 lowercase English letters with replacement. The exposure duration for each trigram was 105 ms. Subjects were asked to fixate at the center of the display (between two green dots) and identify all three letters of each trigram. Trigrams were centered at 13 different letter positions (at fixation, and six positions to the left and right of the midline for horizontal text and six positions above and below the midline for vertical texts). To obtain isolated-letter profiles, randomly-selected single letters were used as stimuli. The testing conditions were the same as in the trigram task.
Figure 1 shows examples of isolated letters and trigrams in four different text formats. For the horizontal text format, letter slots along a horizontal line were labeled by negative or positive numbers to indicate positions to the left or right of the midline. For the three vertical formats, letter positions were distributed along a vertical line. Consistent with our previous study (Yu et al., 2010), we assigned positive numbers to indicate letter positions in the lower visual field and negative numbers to the upper visual field. The positions of isolated letters and of the middle letter within trigrams ranged from −6 to 6. Within each trigram, the center letter of the trigram is referred to as the middle letter; the one farthest from the midline is labeled as the outer letter, and the one nearest the middle as the inner letter.
For each letter position, we accumulated data from the inner, middle, and outer letters of the trigrams presented at that location, and calculated the proportion of letters that were correctly recognized as shown on the left vertical scale of Figure 2. These proportions correct were plotted as a function of letter position to form a visual-span profile. Each visual span profile was based on four blocks of 65 trigram trials (13 letter positions × 5 trials per position). Only data within letter positions −5 to 5 were analyzed for constructing the visual-span profile since the rest of the positions have fewer data points collected (absence of inner letters for positions −6 and 6, and absence of both inner and middle letters for positions −7 and 7). The left side of the profile corresponds to the left visual field in the horizontal format and the upper visual field in the three vertical formats, while the data on the right side of the profiles are from the right horizontal visual field and the lower vertical visual field.
Figure 2.
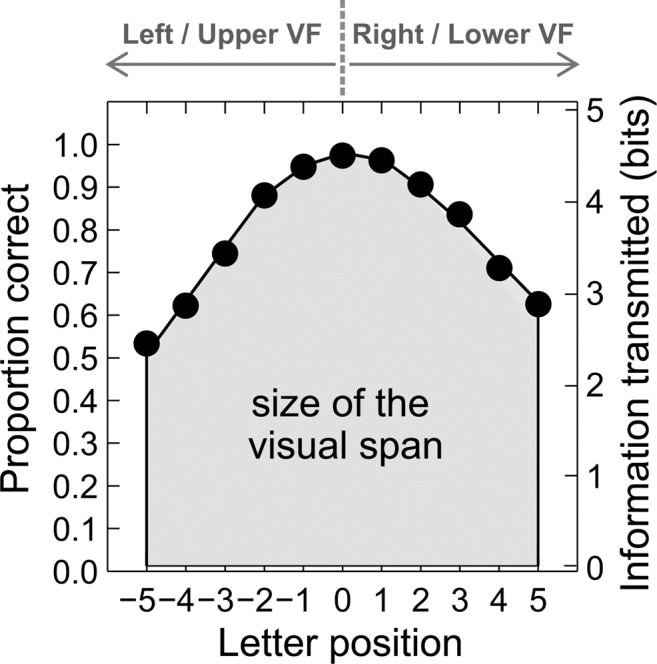
A sample visual-span profile—a plot of letter-recognition accuracy (proportion correct) as a function of letter position. The right vertical scale shows a conversion from proportion correct to information transmitted in bits. The area under the curve indicates the size of the visual span.
A split Gaussian function was used to fit each visual span profile with three parameters: peak amplitude, standard deviation for the left side of the profile, and right-side standard deviation (Legge et al., 2001). The right vertical scale in Figure 2 shows the conversion from proportion correct for letter recognition to bits of information transmitted. Perfect letter recognition performance (i.e., 100% accuracy) corresponds to the maximum amount (4.7 bits) of information transmitted, while the minimum (0 bits) is obtained when the performance is at chance accuracy (1 out of 26 = 3.8%). The conversion was calculated using letter confusion matrices (Beckmann & Legge, 2002). The size of the visual span is quantified by summing up the amount of information transmitted by the profile covering letter positions −5 to 5 (see Figure 2).
Similar to the visual-span profile, an isolated-letter profile is a plot of recognition performance for isolated letters (rather than trigrams) as a function of letter position left and right of the midline. Each profile was developed based on the data collected from four blocks of 130 isolated-letter trials. This means that for each of the 13 positions, the proportion correct of single letter recognition was computed based on 40 trials.
Reporting direction is likely to be a factor influencing subject's performance. To examine the effect of reporting direction, we asked subjects to report the three letters of each trigram in one of two reporting directions: normal or reversed. The “normal” reporting direction was from left to right for the horizontal format, from top to bottom for the marquee and rotated clockwise formats, and from bottom to top for the rotated counterclockwise format. The trigram data were analyzed separately for the two reporting directions.
Subjects were tested with 2,080 isolated letter trials and 2,080 trigram trials, which were divided into three sessions, with 16 blocks per session. The block sequence was pseudo-randomized across sessions to minimize any sequencing effects.
Decomposition analysis
Visual-span profiles describe the sensory information available for letter recognition in reading. Resolution, mislocation, and crowding are three factors that may determine the size and shape of the visual-span profiles. Here, we adopt a decomposition analysis to distinguish between these three sensory components (He et al., 2013).
Decomposition analysis utilizes four profiles—a perfect profile, an isolated-letter profile, a visual-span profile, and a mislocation-corrected visual-span profile (shown in Figure 3A). The perfect profile (black line in Figure 3A) is hypothetical and corresponds to 100% recognition performance at all letter positions. The isolated-letter profile (green line in Figure 3A) shows the availability of front-end sensory information for single letter recognition. The width of the isolated-letter profile is determined by the eccentricity at which letters of a given size reach their local acuity limit in peripheral vision and is related to factors such as the decline in photoreceptor and ganglion cell density. The difference between the perfect profile and isolated-letter profile represents the reduction in performance due to reduced acuity (green curve in Figure 3B). The reduction in isolated letter recognition could also be due to a non-upright letter orientation (see Discussion for more details).
Visual-span profiles1 (red line in Figure 3A) are created by presenting trigrams rather than isolated letters. Because these profiles are based on multiple letters presented simultaneously, visual-span profiles are subject to mislocation errors and to crowding effects in addition to the resolution limitations observed for isolated-letter profiles. We can tease out the separate effects of mislocation and crowding by comparing trigram performance with two scoring methods: by requiring that the letter's identity and position be named correctly (visual-span profile, red line in Figure 3A), and by the more lenient criterion of scoring the letter correct even if it is identified out of order (mislocation-corrected visual-span profile, blue line in Figure 3A). By considering the difference between these two methods of scoring, we can separate the effects of mislocation from that of crowding and resolution: as shown in Figure 3B, the red curve, a plot of the difference between the mislocation-corrected visual-span profile and the standard visual-span profile, represents the isolated effect of mislocations. Similarly, we can isolate the effects of crowding (blue curve in Figure 3B) by considering the difference between the mislocation-corrected visual-span profile (where the effect of mislocations has been eliminated) and the isolated letter profile. The areas under these difference curves (resolution, crowding, and mislocation curves) represent the information lost due to the three sensory components, respectively.
Applying decomposition analysis to the visual-span profile and its sub-profiles (inner, middle, and outer letter profiles)
Figure 4 shows examples of a visual-span profile and its three sub-profiles (the inner, middle, and outer profiles). Since there is no outer letter presented at position 0, the outer-letter profiles were plotted based on the performance at letter positions −7 to −1 and 1 to 7. The middle-letter profiles were plotted for letter positions −6 to 6, and the inner-letter profiles cover only the letter positions −5 to 5. As described in the decomposition analysis above, performance for each sub-profile can be parsed into effects of resolution, mislocations, and crowding.
Auxiliary experiment: Comparing crowding on the horizontal and vertical midlines
As shown in the Results section, we found stronger crowding along the vertical midline than the horizontal midline. However, it is unclear whether this asymmetry in crowding generalizes to stimuli other than letters. Two properties of our letter stimuli, not typical of targets in other crowding studies, may have accounted for the asymmetry—for vertical conditions, letters were either rotated 90° or separated by a letter spacing larger than the horizontal standard. We conducted an auxiliary experiment to determine whether the crowding asymmetry we observed generalizes to more typical crowding stimuli.
Six normally sighted young adults participated in the two-session auxiliary experiment. In both sessions, the Landolt broken ring (Sloan C) stimulus was used as the target. In each trial, subjects chose the facing direction of the gap in the ring from among eight possibilities (left, right, up, down, and the four diagonals). All the stimuli were black on a white background with a Weber contrast of nearly −100%. The exposure duration was 105 ms. Identification performance was measured at eight retinal locations (2.5° and 5° left and right of the fixation point along the horizontal midline, and above and below the fixation point along the vertical midline). In Session 1, we measured target acuity defined as the target size yielding 90% correct performance in recognition for each of the eight target locations. The averaged target acuities and standard errors obtained at 2.5° eccentricity were 0.29° ± 0.02° (left field), 0.27° ± 0.01° (right), 0.31° ± 0.02° (upper), and 0.32° ± 0.02° (lower). At 5° eccentricity, the average acuities and standard errors were 0.39° ± 0.03° (left), 0.40° ± 0.06° (right), 0.54° ± 0.10° (upper) and 0.47° ± 0.02° (lower). These results reveal that the horizontal midline has better acuity than the vertical midline at 2.5° and 5°, F(1, 5) = 8.11, p = 0.036. Neither a left versus right nor upper versus lower field difference was found. The target size of 0.55° was selected for Session 2 to match the print size used in the main experiment. The target size was larger than all the target acuities except the ones at 5° in the right and upper fields for subject S3 whose data were excluded from Session 2.
Session 2 was devoted to the crowding measurement. Two flankers, Sloan Os, were added to each target in a radial direction. For the targets positioned along the vertical midline, one flanker was placed above the target and the other one below the target. For the horizontal conditions, the two flankers were placed to the left and right of the target. A viewing distance of 40 cm was maintained. The target was presented at one of the eight locations or at the fovea. At the fovea, the target was flanked either vertically or horizontally. To measure the spatial extent of crowding for each condition, we tested five target-flanker center-to-center spacings. For comparison with the letter spacing in the visual-span measurements with letters, the smallest target-flanker spacing used was target size × 1.16. The largest spacing was infinity (isolated target). The other three spacings were target eccentricity × 0.7, × 0.5, and × 0.3. For 2.5° eccentricity, the spacings were 0.638°, 0.75°, 1.25°, 1.75°, and infinity. For 5° eccentricity, the spacings were 0.638°, 1.5°, 2.5°, 3.5°, and infinity. For 0° eccentricity, only two spacings, 0.638° (target size × 1.16) and infinity, were tested.
In the data analysis, we first normalized the performance levels by the maximum proportion correct for each target location and subject. Two crowding related measures were calculated based on the normalized data. One measurement was the difference in recognition accuracy between the isolated target (no crowding) and the flanked target at the smallest spacing (0.638°). The other was the spatial extent of crowding defined as the target-flanker spacing yielding 80% of the maximum performance level in target recognition.
For all experiments, repeated measures analyses of variance (ANOVAs) and t-tests were used to analyze the data. Post-hoc tests were performed as needed.
Results
Measuring visual-span profiles and isolated-letter profiles
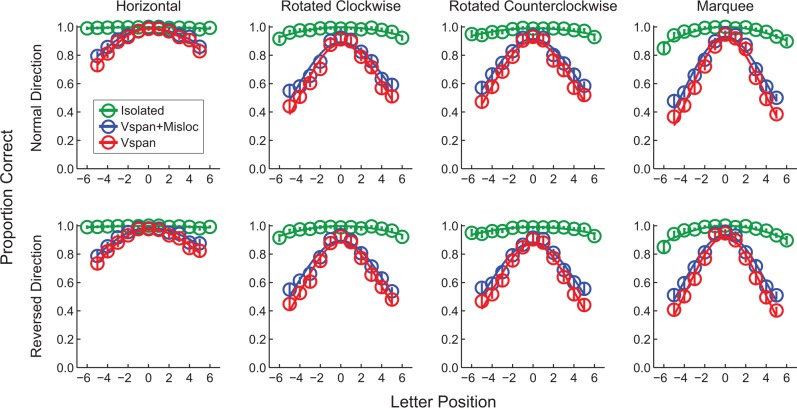
Group data for isolated letter, visual span, and mislocation-corrected visual span profiles are plotted for both normal and reversed reporting directions and for four text formats in Figure 5. The profiles consist of plots of letter-recognition accuracy as a function of letter position. Table 1 lists the group averages of the total amount of information transmitted by the central 11 slots (−5 to +5) in isolated-letter profiles, normal-reading visual-span profiles, and reversed-reading visual-span profiles. Two repeated measures ANOVAs were used to analyze the data, one for the isolated-letter-span size (within-subject factor: text format) and the other for the visual-span size (within-subject factors: reporting direction and text format).
Figure 5.
Isolated-letter profiles, mislocation-corrected visual-span profiles, and visual-span profiles (group average) are shown for both normal and reversed reporting directions in the four text formats. The profiles consist of plots of letter-recognition accuracy as a function of letter position (data are available at 13 positions for isolated-letter profiles and at 11 positions for visual-span profiles). Data for each measurement and condition are fitted with split Gaussians. The error bars indicate standard errors.
Table 1.
Summary of group performance (sum of information transmitted at 11 letter positions [−5 to 5]) for each task and text format (mean ± standard error).
| Horizontal |
Rotated 90° clockwise |
Rotated 90° counterclockwise |
Marquee |
|
| Isolated letter | 50.76 ± 0.06 | 50.07 ± 0.26 | 49.85 ± 0.31 | 49.80 ± 0.21 |
| Visual span, normal direction | 46.06 ± 0.56 | 34.77 ± 1.13 | 36.11 ± 1.21 | 33.22 ± 0.86 |
| Visual span, reversed direction | 45.41 ± 0.88 | 34.63 ± 1.06 | 33.99 ± 1.01 | 34.09 ± 1.02 |
The performance of isolated letter recognition was nearly perfect for all text formats, but recognizing horizontal isolated letters was still slightly better than recognizing isolated vertical letters in each of the other three formats (an average increase of 0.9 bits; significant main effect of text format, F(3, 27) = 8.83, p < 0.0005; significant post-hoc pairwise comparisons, p ≤ 0.01 for all the three horizontal-vertical pairs).
As expected, there was a significant effect of text format on visual-span size, F(3, 27) = 249.20, p < 0.0005. Horizontal text format always led to the best performance (see Table 1). On average, the horizontal visual-span size was 11.3 bits larger than the three vertical formats. There was a significant interaction between the text format and the reporting direction, F(3, 27) = 7.78, p = 0.001. The visual-span size decreased by 2.1 bits when reporting direction was reversed for the rotated counterclockwise condition, F(1, 9) = 12.89, p = 0.006. No reduction was found for the other three text formats.
The sub-profiles (inner, middle, and outer letter profiles) and corresponding analyses are shown in Appendix A.
Decomposition analysis
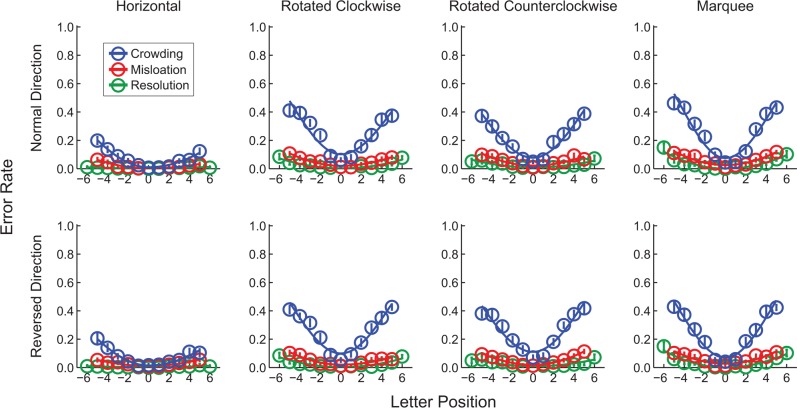
Decomposition analyses were conducted for both normal and reversed reporting directions in the four text formats (Figure 6).
Figure 6.
Decomposition analyses are shown for both normal and reversed reporting directions in the four text formats. The curves are plots of proportion of errors as a function of letter position (data are available at 13 positions for the resolution component profile and at 11 positions for mislocation and crowding profiles). Data for each component and condition are fitted with inverted split Gaussians. The error bars indicate standard errors.
Figure 7 and Table 2 show the distribution of information loss due to different component factors. Across the four text formats, only a small proportion of the total information loss during reading was due to resolution limits. Compared to the horizontal format, all the three vertical text formats suffered more information loss because of acuity reduction (p ≤ 0.01 for all three paired t-tests). There was slightly more information loss in the rotated counterclockwise than in the rotated clockwise condition, t(9) = 2.28, p = 0.048. For mislocation errors, horizontal text again had the least amount of information loss, F(3, 27) = 43.81, p < 0.0005. There were more mislocation errors found in the marquee condition than in the two rotated conditions (p ≤ 0.04 for both paired t-tests). For crowding, we found a significant effect of text format, F(3, 27) = 240.56, p < 0.0005, and an interaction between text format and reporting direction, F(3, 27) = 7.17, p = 0.001. Horizontal text suffered substantially less crowding than the three vertical formats across reporting directions. In addition, the rotated counterclockwise text was slightly less crowded than the rotated clockwise and the marquee texts under the normal reporting direction (p ≤ 0.01). Among the four text formats, only the rotated counterclockwise condition showed an effect of reporting direction on the crowding component, t(9) = 3.69, p = 0.005.
Figure 7.
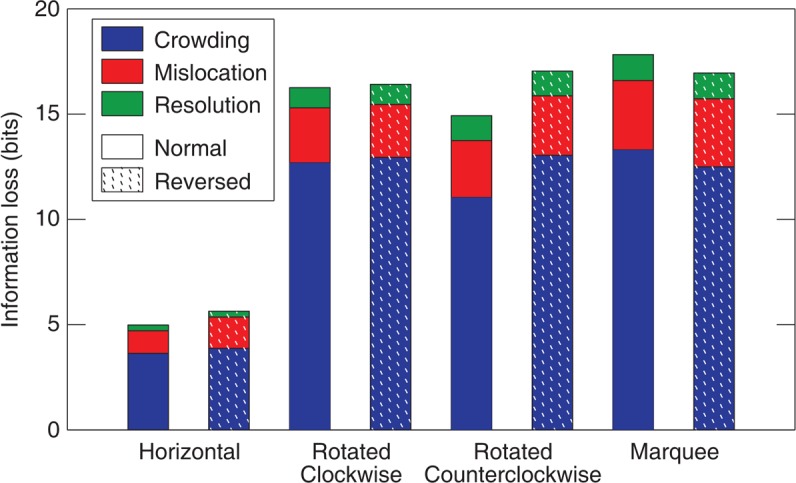
Stacked bar graph showing the distribution of information loss (calculated across the central 11 positions) due to different component factors for each reporting direction and text format.
Table 2.
Summary of decomposition analysis for each reporting direction and text format (mean ± standard error). Component-span size was assessed by summing the information loss due to each component at 11 letter positions (−5 to 5). Notes: * Reporting direction is not applicable for the Resolution profile because it is based on the identification of single letters rather than trigrams.
| Reporting direction |
Horizontal |
Rotated 90° clockwise |
Rotated 90° counterclockwise |
Marquee |
|
| Resolution* | Normal | 0.27 ± 0.06 | 0.96 ± 0.26 | 1.18 ± 0.31 | 1.23 ± 0.21 |
| Reversed | |||||
| Mislocation | Normal | 1.08 ± 0.16 | 2.61 ± 0.16 | 2.70 ± 0.33 | 3.30 ± 0.31 |
| Reversed | 1.49 ± 0.30 | 2.51 ± 0.27 | 2.82 ± 0.20 | 3.23 ± 0.20 | |
| Crowding | Normal | 3.63 ± 0.38 | 12.68 ± 1.00 | 11.04 ± 0.75 | 13.29 ± 0.59 |
| Reversed | 3.87 ± 0.56 | 12.94 ± 0.72 | 13.04 ± 0.75 | 12.49 ± 0.81 | |
| Total | Normal | 4.97 ± 0.56 | 16.26 ± 1.13 | 14.92 ± 1.21 | 17.81 ± 0.86 |
| Reversed | 5.62 ± 0.88 | 16.40 ± 1.06 | 17.04 ± 1.01 | 16.94 ± 1.02 |
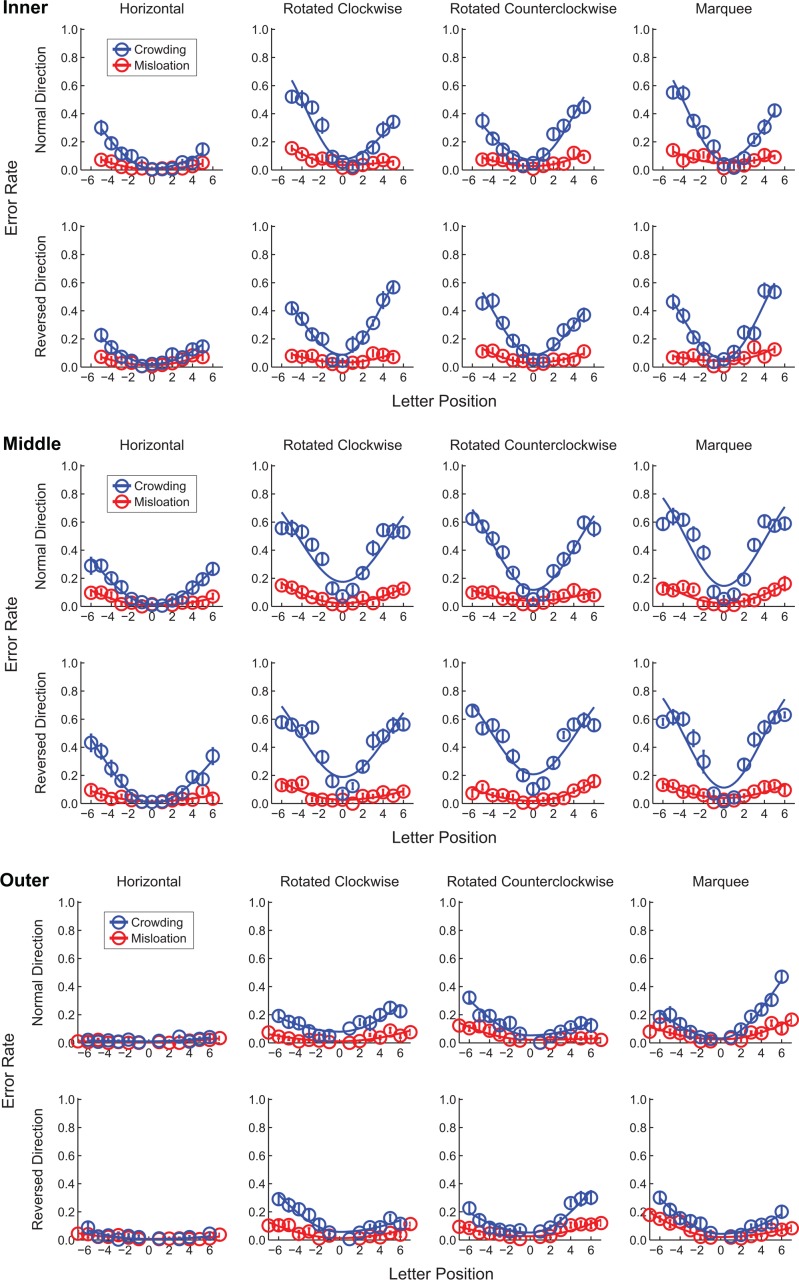
We also applied the decomposition analysis to each of the three sub-profiles, associated with letters in inner, middle, and outer positions (see Appendix B). This analysis allowed us to examine questions such as whether the crowding suffered by middle letters is equal to the sum of the inward and outward crowding effects. Table B1 lists the total amount of crowding on the middle letters from both flankers, and the sum of the separate effects of inward and outward crowding. Figure B2 is a scatter plot of the total amount of crowding for the middle letter against the sum of inward and outward crowding. As shown in Figure B2, the data are closely clustered around the equality line. Statistical tests further confirmed that these two groups of values are equivalent, F(1, 9) = 0.20, p = 0.66. This equality indicates that crowding, when measured as information loss in bits, is additive in the present context. The same analysis was done for the mislocation component, but additivity was not found.
Auxiliary experiment: Comparing crowding on the horizontal and vertical midlines
At the fovea, performance (proportion correct) was near ceiling for both the smallest target-flanker spacing (a mean accuracy of 0.99 ± 0.01 for the horizontal flanking and 0.98 ± 0.01 for the vertical flanking condition) and the largest spacing (i.e., unflanked condition; 0.98 ± 0.00). Apparently, crowding was not present in the foveal conditions measured in this study.
Table 3 lists the mean values of the crowding measurements, the spatial extent of crowding and the amplitude of crowding for the smallest target-flanker spacing (0.638°), at eccentricities 2.5° and 5° for both horizontal and vertical midlines for radially arranged flankers.
Table 3.
Summary of crowding measurements (spatial extent of crowding, and amplitude of crowding along the horizontal and vertical midlines) for each eccentricity and visual field.
| 2.5° eccentricity |
5° eccentricity |
||||||||
| Left |
Right |
Upper |
Lower |
Left |
Right |
Upper |
Lower |
||
| Spatial extent of crowding | Mean | 0.83° | 0.75° | 1.14° | 0.86° | 1.54° | 2.06° | 3.14° | 2.94° |
| SE | 0.13° | 0.08° | 0.13° | 0.05° | 0.26° | 0.37° | 0.27° | 0.16° | |
| Amplitude of crowding | Mean | 0.29 | 0.18 | 0.55 | 0.39 | 0.66 | 0.65 | 0.65 | 0.71 |
| SE | 0.05 | 0.06 | 0.05 | 0.05 | 0.08 | 0.07 | 0.05 | 0.09 | |
It has been found that the spatial extent of crowding is usually near 40%–50% of the target eccentricity (Bouma, 1970; Chung et al., 2001; Whitney & Levi, 2011). The proportionality constants obtained from our results were close to this range (on average, 0.36 at 2.5° eccentricity and 0.48 at 5° eccentricity).
An ANOVA was conducted with the within-subject factors being eccentricity (2.5° and 5°), crowding orientation (horizontal and vertical), and visual field (right vs. left field, or lower vs. upper field). Consistent with many previous findings, crowding increased with eccentricity in both spatial extent and amplitude (p ≤ 0.01). Across eccentricities, the spatial extents of crowding along the vertical midline were larger than the ones measured along the horizontal midline, F(1, 4) = 13.85, p = 0.02. We also found that the amplitude of crowding was larger along the vertical midline compared to the horizontal midline, F(1, 4) = 9.97, p = 0.03. Therefore, both the spatial extent and the amplitude of crowding were greater along the vertical midline (spatial extent: 50% larger across testing conditions; amplitude: 54% stronger) than along the horizontal midline. Our analysis also revealed some two-way interactions that are not discussed here in the interest of brevity.
Discussion
The decomposition analysis allowed us to distinguish between three factors limiting the size of the visual span for reading—acuity, mislocations, and crowding—and to determine the origin of the horizontal/vertical difference. Among the three factors studied, a difference in crowding along the horizontal and vertical midlines was the primary factor accounting for the smaller size of the vertical visual span. Our finding is consistent with the results of a recent study, in which the basis of the improvement in peripheral visual span following training is a large reduction in the adverse effect of crowding and a small reduction in the proportion of mislocation errors (He et al., 2013).
The three sensory components
As discussed in the Introduction, the three sensory components may constrain three sequential stages of information processing. Acuity, limiting recognition even for isolated targets, is at the lowest level. Crowding with an impact on positions of features can occur for targets larger than the acuity limit. Letter mislocations likely follow crowding in the hierarchy. In previous studies, letter position uncertainty has been analyzed separately from letter identification error (crowding) (Chung & Legge, 2009; Strasburger & Malania, 2013; Zhang et al., 2012). Here, mislocation and crowding were also analyzed as two separate factors.
Evidence obtained in the present study is also consistent with distinct mechanisms underlying the mislocation and crowding factors. We found additivity for crowding and lack of additivity for mislocations (See Appendix B). To illustrate this difference, consider the impact of crowding and mislocations on marquee text for normal reporting direction (see Table B1). When we sum the information loss across the 11 letter positions, the crowding-induced reduction is about 20 bits for letters flanked on both sides (i.e., middle letters of trigrams), 14 bits for letters flanked only on the outer side, and 6 bits for letters flanked only on the inner side. The amount of crowding upon the middle letters is equivalent to the sum of the inward and the outward crowding (20 bits). In other words, the crowding suffered by the middle letter can be predicted given an independent measurement of inward and outward crowding. However, the information loss due to mislocation errors for the middle letters (3 bits) was not greater than that for the inner letters (4 bits), let alone the sum from the inner and outer letters (6 bits). Our results are consistent with the proposed hierarchy of the three sensory components.
Interestingly, crowding additivity does not appear to be universal among various visual stimuli. In fact, for target stimuli that differ from the flankers in a single distinct feature such as color, the crowding effect may decrease with an increasing number of flankers (Levi & Carney, 2009; Põder, 2006). It is possible that flankers of this kind can be grouped together separately from the target while the flanker grouping for more complicated stimuli such as randomly selected English letters is much harder.
Chung and Legge (2009) proposed that mislocation errors are due to reduced precision in the coding of letter position in the periphery. The changes of mislocation errors with text format in the present study suggest that the coding of letter position is most precise for the horizontal text and least accurate (most uncertain) for the marquee text. Greater imprecision in position coding for upright letters (marquee) compared to rotated letters may mainly reflect the intrinsic characteristics of marquee text—disruption of the normal orthogonal relationship between letter orientation and word orientation. Another subtle issue may be that for a corresponding number of letter positions away from the midline, the marquee letters are farther from the midline in angular units because of the larger between-letter spacing required. Since proportion of mislocation errors increase gradually with eccentricity (Figure 6), presenting letters further from the fovea may account partially for the poorer position coding. This speculation is also supported by reanalysis of data from Yu et al. (2007). In that study, visual spans were measured for different between-letter spacing conditions in horizontal trigrams, and more mislocations were found for the larger spacing conditions.
Unlike mislocation errors, the amount of crowding did not always seem to be greater for marquee than for rotated texts. However, due to the confounding factor of letter spacing (44% larger for marquee text), crowding may be underestimated in the marquee format.
The effect of letter orientation
For rotated clockwise and counterclockwise vertical conditions, the reduced performance in isolated-letter recognition and crowded letter recognition (shrinkage of the isolated letter span and visual span) could also be due to the extra effort associated with recognizing a non-upright letter, an effect we refer to as “mental rotation” (possibly a combined effect of sparse reading experience with rotated letters and the cognitive process of mentally rotating an image).
The effect of mental rotation can be assessed by comparing the letter recognition accuracy for rotated formats to the accuracy for recognizing standard upright letters while matching the other parameters such as eccentricity along the vertical midline (see Appendix C for detailed analysis). However, this analysis can be done only for the isolated letter recognition but not for the crowded letter recognition because larger letter-to-letter spacing was used to obtain the measurement of crowded marquee (upright) letter recognition.
In Appendix C, we further analyzed the resolution component into two subcomponents—resolution for upright letters (0.86 ± 0.12 bits) and letter rotation (0.10 ± 0.21 bits for rotated clockwise and 0.32 ± 0.25 bits for rotated counterclockwise). The minor amount of information loss due to letter rotation is consistent with previous findings that accuracy and reaction time for single letter recognition is largely independent of letter orientation (Koriat & Norman, 1984, 1989). Nevertheless, word or connected text recognition can be affected by letter orientation (Koriat & Norman, 1984, 1985, 1989). It is possible that letter rotation has a bigger effect on the other two sensory components (crowding and mislocation).
Our results also showed slightly poorer acuity (more information loss due to resolution limits) along the vertical axis than the horizontal midline (0.86 vs. 0.27 bits). This is consistent with previous findings that visual acuity at a given eccentricity is better along the horizontal midline than the vertical midline (Wertheim, 1980). However, in both cases, the contributions to the visual span are minimal.
Crowding differs along the horizontal and vertical midlines
We found significantly stronger crowding along the vertical midline than the horizontal midline. This asymmetry of crowding has also been present, although not discussed, in the data reported by Toet and Levi (1992). Based on the crowding zones measured by Toet and Levi, the vertical midline seems to have larger spatial extent than the horizontal midline at 2.5°, 5°, and 10° eccentricity. In our main experiment, the crowding measurement was the amplitude of crowding rather than its spatial extent. Therefore, in the auxiliary experiment, we measured and compared amplitude and spatial extent of crowding along horizontal and vertical midlines using non-letter stimuli. The findings from the auxiliary study verified that crowding is stronger along the vertical midline than the horizontal midline in terms of both spatial extent and amplitude, and confirmed that the vertical-horizontal crowding asymmetry along midlines generalizes beyond the letter.
Conclusions
This study clarifies the sensory factors underlying the horizontal and vertical differences in the visual span for reading. Based on results from our decomposition analysis, we conclude that crowding and mislocations play important roles in determining the size of visual spans when letter size is larger than the critical print size for reading and in accounting for the horizontal/vertical difference. Among the three components, crowding is the major factor limiting the size of the visual spans for letter recognition, likely playing a key role in limiting reading speed.
Acknowledgments
NIH grant EY002934 (GEL) and EY012810 (STLC) supported this research.
Commercial relationships: none.
Corresponding author: Deyue Yu.
Author: yu.858@osu.edu.
Address: College of Optometry, The Ohio State University, Columbus, Ohio, USA.
Appendix A. Visual-span's sub-profiles
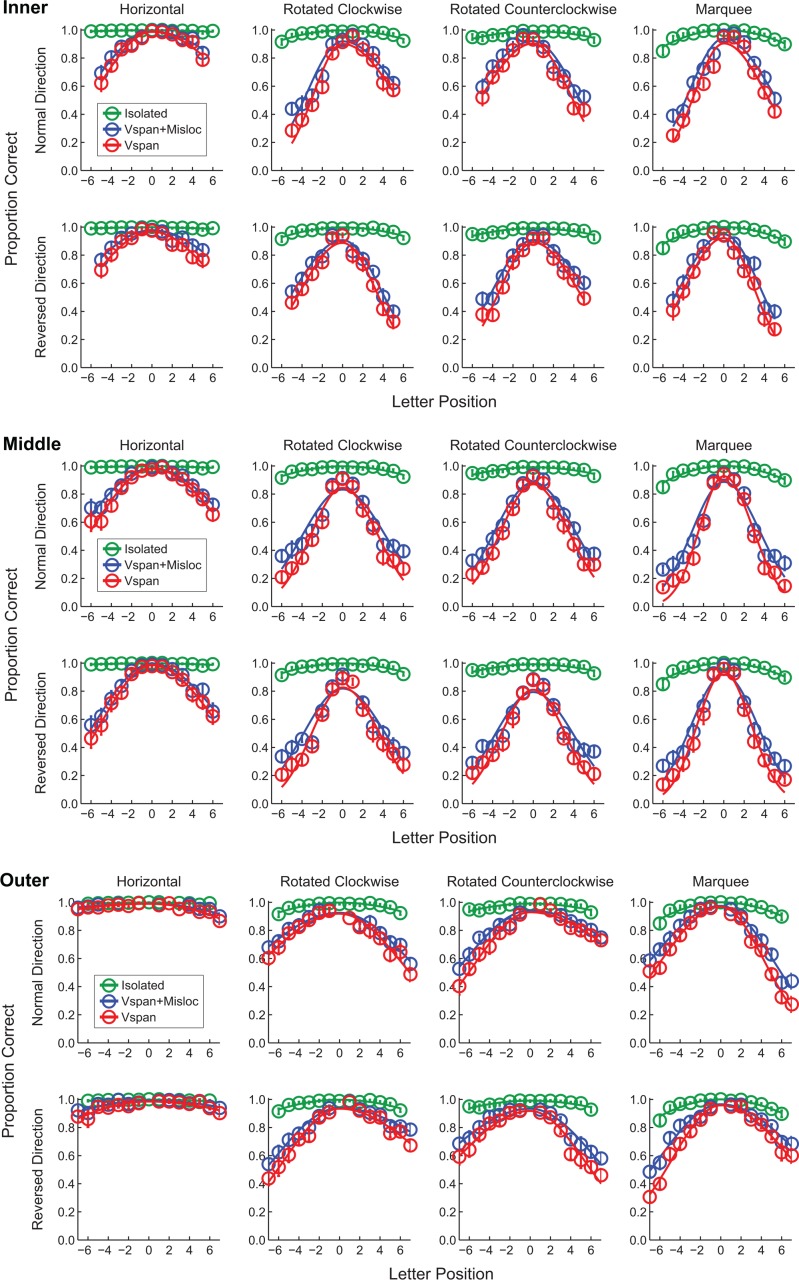
Visual span's sub-profiles (inner, middle, and outer letter profiles) are plotted in Figure A1 (red symbols and curves). Table A1 lists the size of each letter span for different reporting directions and text formats. Each letter span size was calculated as the information transmitted through the sub-profile at 11 letter positions (−5 to 5). Since outer letters cannot be physically presented at letter position 0, estimation of the central point based on curve fitting was made to complete the calculation. Consistent with previous findings (Legge et al., 2001), the outer letters have the broadest profiles and highest recognition accuracy (largest letter span). The middle letters have the narrowest profiles and the lowest accuracy (smallest letter span). The inner letters have similar but slightly better recognition accuracy than the middle letters. This is true for all the four text formats.
Figure A1.
Isolated-letter profiles, and sub-profiles (inner, middle, and outer profiles), and mislocation-corrected sub-profiles (group average) are shown for both normal and reversed reporting directions in the four text formats. The profiles consist of plots of letter-recognition accuracy as a function of letter position. Data for each measurement and condition are fitted with split Gaussians. The error bars indicate standard errors.
Table A1.
Summary of group sub-profile size for each reporting direction and text format (mean ± standard error). Letter-span size is assessed by summing the information transmitted (bits) through each sub-profile at 11 letter positions (−5 to 5).
| Letter position |
Reporting direction |
Horizontal |
Rotated 90° clockwise |
Rotated 90° counterclockwise |
Marquee |
| Inner | Normal | 44.63 ± 0.79 | 33.48 ± 1.20 | 35.60 ± 1.32 | 32.02 ± 0.92 |
| Reversed | 44.14 ± 1.14 | 33.06 ± 1.13 | 33.76 ± 1.32 | 32.63 ± 1.27 | |
| Middle | Normal | 43.82 ± 0.87 | 28.68 ± 1.27 | 30.12 ± 1.41 | 26.82 ± 1.00 |
| Reversed | 42.72 ± 1.29 | 28.33 ± 1.46 | 27.04 ± 0.96 | 27.46 ± 1.42 | |
| Outer | Normal | 49.68 ± 0.23 | 42.35 ± 1.26 | 42.55 ± 1.06 | 40.86 ± 1.02 |
| Reversed | 49.42 ± 0.44 | 42.52 ± 0.86 | 41.25 ± 0.99 | 42.25 ± 0.80 |
Data were analyzed with a repeated measures ANOVAs (three within-subject factors: letter position in trigram, text format, and reporting direction). We found an effect of letter position, F(2, 18) = 4.95, p = 0.019, an effect of reporting direction, F(1, 9) = 14.04, p = 0.005, an interaction between position and reporting direction, F(2, 18) = 39.66, p < 0.0005, and a three-way interaction between position, text format, and reporting direction, F(6, 54) = 36.96, p < 0.0005.
Appendix B. Decomposition analyses for each within-trigram letter position
Figure B1.
Decomposition analyses for each within-trigram letter position are shown for both normal and reversed reporting directions in the four text formats. The curves consist of plots of error rates as a function of letter position. Data for each component and condition are fitted with inverted split Gaussians. The error bars indicate standard errors.
Figure B2.
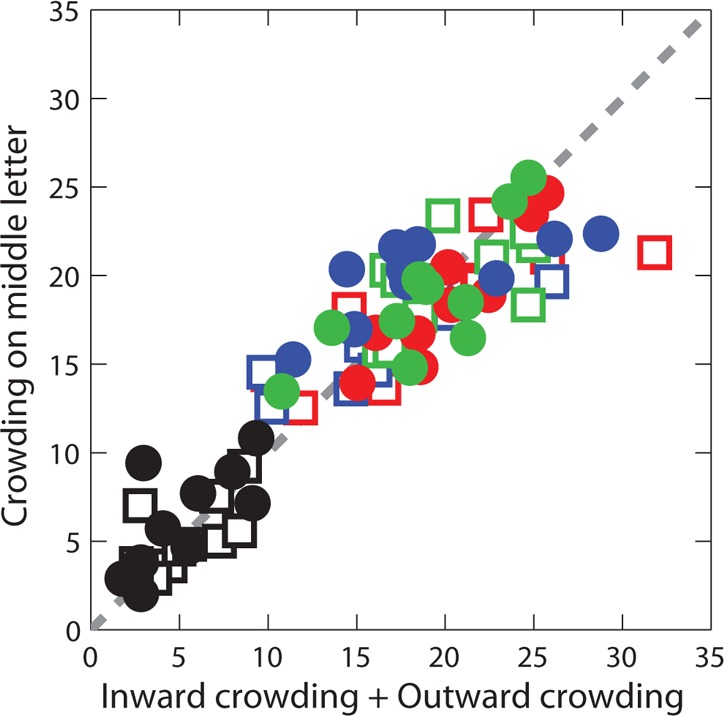
A scatter plot of crowding on the middle letters of trigrams plotted against the sum of inward crowding (crowding on the inner letters) and outward crowding (crowding on the outer letters) for individual subjects. Data are plotted as open squares for the normal reporting direction and filled circles for the reversed reporting direction. Data obtained in the four text formats are represented by black (horizontal), red (rotated clockwise), blue (rotated counterclockwise), and green (marquee) symbols. The gray dashed line is the equality line. Each data point represents the middle-letter crowding and the corresponding total of inward and outward crowding for an individual subject tested for one text format and one reporting direction. Points resting on the gray equality line indicate that inner plus outer crowding is equal to the crowding applied on the middle letters.
Table B1.
Summary of decomposition analysis for each sub-letter profile, reporting direction, and text format (mean ± standard error). Component-span size was assessed by summing the information loss due to each component at 11 letter positions (−5 to 5).
| Letter position |
Reporting direction |
Horizontal |
Rotated 90° clockwise |
Rotated 90° counterclockwise |
Marquee |
|
| Mislocation | Inner | Normal | 1.36 ± 0.27 | 3.33 ± 0.27 | 2.92 ± 0.36 | 3.92 ± 0.53 |
| Reversed | 2.05 ± 0.36 | 2.90 ± 0.38 | 3.30 ± 0.28 | 3.49 ± 0.29 | ||
| Middle | Normal | 1.53 ± 0.26 | 3.13 ± 0.25 | 3.23 ± 0.49 | 3.36 ± 0.24 | |
| Reversed | 1.73 ± 0.39 | 2.87 ± 0.34 | 2.79 ± 0.27 | 3.68 ± 0.33 | ||
| Outer | Normal | 0.32 ± 0.09 | 1.33 ± 0.23 | 1.96 ± 0.38 | 2.55 ± 0.50 | |
| Reversed | 0.67 ± 0.22 | 1.72 ± 0.33 | 2.40 ± 0.35 | 2.45 ± 0.31 | ||
| Inner + Outer | Normal | 1.68 ± 0.24 | 4.67 ± 0.35 | 4.88 ± 0.61 | 6.47 ± 0.90 | |
| Reversed | 2.72 ± 0.54 | 4.63 ± 0.57 | 5.70 ± 0.46 | 5.94 ± 0.32 | ||
| Crowding | Inner | Normal | 4.77 ± 0.60 | 13.26 ± 1.08 | 11.33 ± 1.11 | 13.86 ± 0.74 |
| Reversed | 4.57 ± 0.78 | 14.10 ± 0.86 | 12.79 ± 1.15 | 13.69 ± 1.20 | ||
| Middle | Normal | 5.40 ± 0.63 | 18.27 ± 1.14 | 16.50 ± 0.88 | 19.63 ± 0.84 | |
| Reversed | 6.31 ± 0.93 | 18.87 ± 1.11 | 20.02 ± 0.73 | 18.66 ± 1.20 | ||
| Outer | Normal | 0.76 ± 0.23 | 6.38 ± 1.13 | 5.34 ± 0.62 | 6.39 ± 0.64 | |
| Reversed | 0.68 ± 0.21 | 5.83 ± 0.58 | 6.19 ± 0.83 | 5.10 ± 0.59 | ||
| Inner + Outer | Normal | 5.53 ± 0.71 | 19.64 ± 2.09 | 16.67 ± 1.51 | 20.25 ± 1.14 | |
| Reversed | 5.25 ± 0.88 | 19.94 ± 1.11 | 18.98 ± 1.71 | 18.79 ± 1.35 |
Appendix C. Assessing the effect of mental rotation
We assessed the effect of mental rotation by comparing the letter recognition accuracy for rotated formats to the accuracy for recognizing standard upright letters while matching the other parameters. Along the vertical midline, the nonzero letter positions (i.e., −6 to −1 and 1 to 6) for marquee format are further away from the fixation point than for rotated formats because larger letter spacings (1.67 × instead of 1.16 × x width) were used in marquee text. To generate a profile for upright letters (a plot of letter recognition accuracy as a function of “standard” letter position, i.e., separation of adjacent letter positions by 1.16 × x width), we fit the marquee data with split Gaussians, retrieved the fitted values for each “standard” letter position, and plotted the fitted values as a function of “standard” letter position. As shown in Figure C1, the effect of mental rotation was assessed by subtracting the rotated-letter profile from the upright-letter profile.
Figure C1.

(A) Comparing the isolated-letter profiles for rotated formats (orange circles and curves) to the isolated-letter profile for upright letters (black curves). (B) Effect of mental rotation, as assessed by subtracting the isolated-rotated-letter profile from the isolated-upright-letter profile. Data for each condition are fitted with inverted split Gaussians. The error bars indicate standard errors.
As shown in Table 2, the amount of information loss due to resolution limits was 0.96 bits for rotated clockwise text and 1.18 for rotated counterclockwise text. As we discussed, part of the information loss was induced by mental rotation. Therefore, we further analyzed the component into two subcomponents—resolution for upright letters (0.86 ± 0.12 bits) and letter rotation (0.10 ± 0.21 bits for rotated clockwise and 0.32 ± 0.25 bits for rotated counterclockwise).
Footnotes
To assess mislocation errors, the letters that appeared more than once within the trigram (7.5% of the letters in total) were excluded from the decomposition analysis. The change in visual-span profile following this process is negligible (on average 0.3% difference across letter positions).
Contributor Information
Deyue Yu, Email: yu.858@osu.edu.
Gordon E. Legge, Email: legge@umn.edu.
Gunther Wagoner, Email: gunnar.wagoner@gmail.com.
Susana T. L. Chung, Email: s.chung@berkeley.edu.
References
- Anstis S. M. (1974). Letter: A chart demonstrating variations in acuity with retinal position. Vision Research , 14 (7), 589–592. [DOI] [PubMed] [Google Scholar]
- Beckmann P. J., Legge G. E. (2002). Preneural limitations on letter identification in central and peripheral vision. Journal of the Optical Society of America A: Optics, Image Science, and Vision, 19 (12), 2349–2362. [DOI] [PubMed] [Google Scholar]
- Bouma H. (1970). Interaction effects in parafoveal letter recognition. Nature , 226, 177–178. [DOI] [PubMed] [Google Scholar]
- Bouma H. (1973). Visual interference in the parafoveal recognition of initial and final letters of words. Vision Research, 13 (4), 767–782. [DOI] [PubMed] [Google Scholar]
- Brainard D. H. (1997). The psychophysics toolbox. Spatial Vision , 10, 433–436. [PubMed] [Google Scholar]
- Chung S. T. L., Legge G. E. (2009). Precision of position signals for letters. Vision Research, 49 (15), 1948–1960. doi:10.1016/j.visres. 2009.05.004. [DOI] [PMC free article] [PubMed] [Google Scholar]
- Chung S. T. L., Levi D. M., Legge G. E. (2001). Spatial-frequency and contrast properties of crowding. Vision Research, 41 (14), 1833–1850. [DOI] [PubMed] [Google Scholar]
- Coates D. R., Chin J. M., Chung S. T. L. (2013). Factors affecting crowded acuity: Eccentricity and contrast. Optometry and Vision Science , 90, 628–638. [DOI] [PMC free article] [PubMed] [Google Scholar]
- Flom M. C., Weymouth F. W., Kahneman D. (1963). Visual resolution and contour interaction. Journal of the Optical Society of America, 53 (9), 1026–1032. [DOI] [PubMed] [Google Scholar]
- He S., Cavanagh P., Intriligator J. (1996). Attentional resolution and the locus of visual awareness. Nature , 383 (6598), 334–337. doi:http://dx.doi.org/10.1038/383334a0. [DOI] [PubMed] [Google Scholar]
- He Y., Legge G. E., Yu D. (2013). Sensory and cognitive influences on the training-related improvement of reading speed in peripheral vision. Journal of Vision, 13 (7): 3 1–14, http://www.journalofvision.org/content/13/7/14, doi:10.1167/13.7.14. [PubMed] [Article] [DOI] [PMC free article] [PubMed] [Google Scholar]
- Herse P. R., Bedell H. E. (1989). Contrast sensitivity for letter and grating targets under various stimulus conditions. Optometry and Vision Science, 66 (11), 774–781. [DOI] [PubMed] [Google Scholar]
- Koriat A., Norman J. (1984). What is rotated in mental rotation? Journal of Experimental Psychology. Learning, Memory, and Cognition, 10 (3), 421–434. [DOI] [PubMed] [Google Scholar]
- Koriat A., Norman J. (1985). Reading rotated words. Journal of Experimental Psychology: Human Perception and Performance, 11 (4), 490. [DOI] [PubMed] [Google Scholar]
- Koriat A., Norman J. (1989). Why is word recognition impaired by disorientation while the identification of single letters is not? Journal of Experimental Psychology: Human Perception and Performance, 15 (1), 153–163. [DOI] [PubMed] [Google Scholar]
- Latham K., Whitaker D. (1996). Relative roles of resolution and spatial interference in foveal and peripheral vision. Ophthalmic and Physiological Optics , 16, 49–57. [PubMed] [Google Scholar]
- Legge G. E. (2007). Psychophysics of reading in normal and low vision. Mahweh, NJ: : Erlbaum. [Google Scholar]
- Legge G. E., Cheung S. H., Yu D., Chung S. T. L., Lee H. W., Owens D. P. (2007). The case for the visual span as a sensory bottleneck in reading. Journal of Vision , 7 (2): 3 1–15, http://www.journalofvision.org/content/7/2/9, doi:10.1167/7.2.9. [PubMed] [Article] [DOI] [PMC free article] [PubMed] [Google Scholar]
- Legge G. E., Hooven T. A., Klitz T. S., Mansfield J. S., Tjan B. S. (2002). Mr. Chips 2002: New insights from an ideal-observer model of reading. Vision Research , 42, 2219–2234. [DOI] [PubMed] [Google Scholar]
- Legge G. E., Klitz T. S., Tjan B. S. (1997). Mr. Chips: An ideal-observer model of reading. Psychological Review , 104, 524–553. [DOI] [PubMed] [Google Scholar]
- Legge G. E., Mansfield J. S., Chung S. T. L. (2001). Psychophysics of reading. XX. Linking letter recognition to reading speed in central and peripheral vision. Vision Research, 41 (6), 725–743. [DOI] [PubMed] [Google Scholar]
- Levi D. M. (2008). Crowding—An essential bottleneck for object recognition: A mini-review. Vision Research , 48 (5), 635–654. doi:http://dx.doi.org/10.1016/j.visres.2007.12.009. [DOI] [PMC free article] [PubMed] [Google Scholar]
- Levi D. M., Carney T. (2009). Crowding in peripheral vision: Why bigger is better. Current Biology , 19 (23), 1988–1993. [DOI] [PMC free article] [PubMed] [Google Scholar]
- Levi D. M., Hariharan S., Klein S. A. (2002). Suppressive and facilitatory spatial interactions in peripheral vision: Peripheral crowding is neither size invariant nor simple contrast masking. Journal of Vision , 2 (2): 3 167–177, http://www.journalofvision.org/content/2/2/3, doi:10.1167/2.2.3. [PubMed] [Article] [DOI] [PubMed] [Google Scholar]
- Pelli D. G. (1997). The VideoToolbox software for visual psychophysics: Transforming numbers into movies. Spatial Vision , 10, 437–442. [PubMed] [Google Scholar]
- Pelli D. G., Palomares M., Majaj N. J. (2004). Crowding is unlike ordinary masking: Distinguishing feature integration from detection. Journal of Vision , 4 (12): 3 1136–1169, http://www.journalofvision.org/content/4/12/12, doi:10.1167/4.12.12. [PubMed] [Article] [DOI] [PubMed] [Google Scholar]
- Pelli D. G., Tillman K. A., Freeman J., Su M., Berger T. D., Majaj N. J. (2007). Crowding and eccentricity determine reading rate. Journal of Vision, 7 (2): 3 1–36, http://www.journalofvision.org/content/7/2/20, doi:10.1167/7.2.20. [PubMed] [Article] [DOI] [PubMed] [Google Scholar]
- Põder E. (2006). Crowding, feature integration, and two kinds of “attention.” Journal of Vision, 6 (2): 3 163–169, http://www.journalofvision.org/content/6/2/7, doi:10.1167/6.2.7. [PubMed] [Article] [DOI] [PubMed] [Google Scholar]
- Strasburger H., Malania M. (2013). Source confusion is a major cause of crowding. Journal of Vision, 13 (1): 3 1–20, http://www.journalofvision.org/content/13/1/24, doi:10.1167/13.1.24. [PubMed] [Article] [DOI] [PubMed] [Google Scholar]
- Strasburger H., Rentschler I., Jüttner M. (2011). Peripheral vision and pattern recognition: A review. Journal of Vision, 11 (5): 3 1–82, http://www.journalofvision.org/content/11/5/13, doi:10.1167/11.5.13. [PubMed] [Article] [DOI] [PMC free article] [PubMed] [Google Scholar]
- Toet A., Levi D. M. (1992). The two-dimensional shape of spatial interaction zones in the parafovea. Vision Research, 32 (7), 1349–1357. [DOI] [PubMed] [Google Scholar]
- Wertheim T. (1980). Peripheral visual acuity: Th. Wertheim. American Journal of Optometry and Physiological Optics, 57 (12), 915–924. [PubMed] [Google Scholar]
- Whitney D., Levi D. M. (2011). Visual crowding: A fundamental limit on conscious perception and object recognition. Trends in Cognitive Sciences , 15 (4), 160–168. doi:10.1016/j.tics.2011.02.005. [DOI] [PMC free article] [PubMed] [Google Scholar]
- Yu D., Cheung S. H., Legge G. E., Chung S. T. L. (2007). Effect of letter spacing on visual span and reading speed. Journal of Vision , 7 (2): 3 1–10, http://www.journalofvision.org/content/7/2/2 , doi:10.1167/7.2.2. [PubMed] [Article] [DOI] [PMC free article] [PubMed] [Google Scholar]
- Yu D., Park H., Gerold D., Legge G. E. (2010). Comparing reading speed for horizontal and vertical English text. Journal of Vision, 10 (2): 3 1–17, http://www.journalofvision.org/content/10/2/21, doi:10.1167/10.2.21. [PubMed] [Article] [DOI] [PMC free article] [PubMed] [Google Scholar]
- Zhang J.-Y., Zhang G.-L., Liu L., Yu C. (2012). Whole report uncovers correctly identified but incorrectly placed target information under visual crowding. Journal of Vision, 12 (7): 3 1–11, http://www.journalofvision.org/content/12/7/5, doi:10.1167/12.7.5. [PubMed] [Article] [DOI] [PubMed] [Google Scholar]


