

SUMMARY
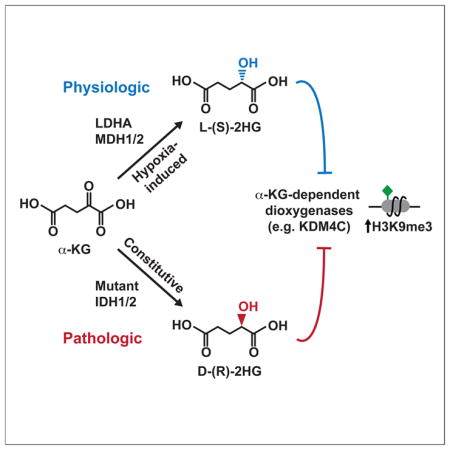
Somatic mutations in isocitrate dehydrogenase 1 or 2 (IDH1/2) contribute to the pathogenesis of cancer via production of the ‘oncometabolite’ D-2-hydroxyglutarate (D-2HG). Elevated D-2HG can block differentiation of malignant cells by functioning as a competitive inhibitor of alpha-ketoglutarate (α-KG)-dependent enzymes, including Jumonji family histone lysine demethylases. 2HG is a chiral molecule that can exist in either the D- or L- enantiomer. Although cancer-associated IDH1/2 mutations produce D-2HG, biochemical studies have demonstrated that L-2HG also functions as a potent inhibitor of α-KG-dependent enzymes. Here we report that under conditions of oxygen limitation, mammalian cells selectively produce L-2HG via enzymatic reduction of α-KG. Hypoxia-induced L-2HG is not mediated by IDH1 or IDH2, but instead results from promiscuous substrate usage primarily by lactate dehydrogenase A (LDHA). During hypoxia, the resulting increase in L-2HG is necessary and sufficient for the induction of increased methylation of histone repressive marks, including histone 3 lysine 9 (H3K9me3).
Keywords: metabolite, chromatin, epigenetic, histone mark, glioblastoma, tumor, stem cell
Graphical abstract
INTRODUCTION
In addition to fueling cellular growth and proliferation, nutrients and metabolic intermediates can influence cellular responses to physiologic perturbations (Vander Heiden et al., 2009). The potential impact that specific metabolites can exert on cell responsiveness was exemplified by the identification of recurrent somatic mutations in isocitrate dehydrogenase 1 and 2 (IDH1/2) in a variety of human cancers (Losman and Kaelin, 2013). IDH1/2 are NADP+-dependent enzymes that normally catalyze oxidative decarboxylation of isocitrate to α-ketoglutarate (α-KG). Cancer-associated mutations in IDH1/2 result in a gain-of-function activity enabling conversion of α-KG to D-2-hydroxyglutarate (D-2HG) (Ward and Thompson, 2012). D-2HG has been proposed to function as an ‘oncometabolite’ via its ability to inhibit a number of α-KG-dependent enzymes, including Jumonji histone lysine demethylases. In particular, D-2HG-mediated inhibition of epigenetic modifying enzymes promotes repressive chromatin structure that impairs expression of genes required for normal differentiation in response to inductive growth factors/cytokines.
Of note, 2HG is a chiral molecule that can exist in either the D-(R)- or L-(S)-enantiomeric conformation. While IDH1/2 mutants exclusively produce D-2HG, biochemical evidence indicates that L-2HG can potently inhibit many α-KG-dependent enzymes, including epigenetic modifiers (Chowdhury et al., 2011; Koivunen et al., 2012; Xu et al., 2011). Normal cells without IDH1/2 mutations produce small quantities of both D- and L-2HG via metabolic pathways that remain poorly understood. The evolutionarily conserved D- and L-2-hydroxyglutarate dehydrogenases (D2HGDH and L2HGDH) prevent accumulation of D- and L-2HG, respectively, by catalyzing their conversion back to α-KG (Linster et al., 2013). Homozygous germline loss-of-function mutations of D2HGDH or L2HGDH result in 2HG acidurias, disorders characterized by systemic elevation of D- or L-2HG (Kranendijk et al., 2012). Patients with 2HG acidurias suffer from significant developmental abnormalities resulting in premature death. Systemic elevations of L-2HG arising from inherited mutations of L2HGDH have been associated with brain tumors (Moroni et al., 2004). Likewise, the recent identification of recurrent L2HGDH loss in kidney cancer further supports a potential oncogenic role for deregulated L-2HG (Shim et al., 2014).
The 2HG acidurias demonstrate that physiologic D- and L-2HG levels must be tightly regulated by D2HGDH and L2HGDH in order to prevent 2HG-mediated pathology. These findings also raised the possibility that controlled physiologic production of D- or L-2HG might modulate specific cellular functions. In this study, we identify a novel metabolic pathway whereby IDH1/2-wildtype cells selectively produce L-2HG via enzymatic reduction of α-KG during hypoxia. Hypoxia-induced L-2HG does not depend on either IDH1 or IDH2, but instead arises via promiscuous substrate usage by lactate dehydrogenase A (LDHA), with additional contributions from malate dehydrogenase 1 and 2 (MDH1/2). Structural modeling of the active site of LDHA demonstrates the spatial constraints for substrate binding that dictate how LDHA-mediated reduction of α-KG gives rise to L-2HG. Moreover, we show that L-2HG is necessary and sufficient for enhanced trimethylation of histone 3 lysine 9 (H3K9me3) that occurs in response to hypoxia. Thus, we propose that hypoxia-induced L-2HG represents a metabolic signaling intermediate that conveys information about the metabolic state of the cell via modulation of epigenetic marks in the nucleus.
RESULTS
L-2-Hydroxglutarate Accumulates in Hypoxic Cells
A previous report indicated that some cells accumulate 2HG under conditions of oxygen limitation (Wise et al., 2011). Indeed, we identified a generalizable phenomenon wherein mammalian cells accumulate 2HG in response to hypoxia (Figure 1A). We used gas chromatography-mass spectrometry (GC-MS) to measure intracellular 2HG in IDH1/2-wildtype cell lines cultured in normoxia (21% oxygen) versus hypoxia (0.5% oxygen). In all cases, we observed a substantial increase of 2HG in hypoxia, ranging from 5 to 25 fold depending on the type of cell (Figure 1A). Quantification of intracellular 2HG levels demonstrated an absolute concentration of 304 +/- 81 μM (mean +/- SD; Figures S1A and S1B show the standard curve and calculations for a representative experiment). Standard methods for measuring metabolites by GC-MS do not distinguish enantiomeric species, thus total 2HG measured in these assays includes both D- and L-2HG.
Figure 1. L-2-Hydroxyglutarate (L-2HG) Production in Response to Hypoxia.

(A) The indicated cells were cultured for 24 to 48 hr in 21% or 0.5% oxygen (O2). Total intracellular 2HG was measured by gas chromatography-mass spectrometry (GC-MS) and normalized to total protein to control for input. The 2HG level for each cell type in 21% O2 is arbitrarily set to 1 to illustrate fold change. Graphs show mean +/- SD of triplicate samples. (B and C) SF188 cells were stably infected with lentiviruses expressing non-targeting shRNA (Cont), shRNAs targeting D2HGDH (D2, D3, D4, D5), or shRNAs targeting L2HGDH (L2, L3, L4). Cells were cultured for 48 hr in 21% or 0.5% O2, and 2HG was measured as in (A). Western blots show expression of HIF1α, D2HGDH, L2HGDH, and S6 protein (loading control). (D) Metabolites from hypoxic SF188 cells were divided into 4 fractions, then spiked with reference standards of D-2HG, L-2HG, a mixture of D- and L-2HG, or left unspiked. Chiral derivatization was performed to allow separation of 2HG enantiomers by GC-MS. For each panel in this figure, representative data from 1 of ≥3 independent experiments are shown. See also Figure S1.
We next investigated the effects of manipulating D2HGDH or L2HGDH on intracellular 2HG levels. shRNAs targeting D2HGDH or L2HGDH were stably infected into the SF188 glioblastoma cell line. Regardless of oxygen availability, ablation of D2HGDH had little effect on intracellular 2HG (Figure 1B). However, ablation of L2HGDH substantially increased accumulation of 2HG in hypoxia, suggesting that L-2HG represents the major form of 2HG that accumulates in response to oxygen limitation (Figure 1C). Similar results were obtained using HEK293T cells transfected with siRNAs targeting D2HGDH or L2HGDH (Figure S1C). Overexpression of L2HGDH, but not D2HGDH, in HEK293T cells abrogated hypoxic induction of 2HG, providing additional evidence supporting selective accumulation of the L-enantiomer of 2HG in hypoxic cells (Figure S1D).
To determine which enantiomer of 2HG accumulates in hypoxia, we utilized a chiral derivatization procedure in which metabolites undergo sequential reaction with R(-)-2-butanol followed by acetic anhydride (Figures S1E and S1F), thereby allowing D- and L-2HG to be distinguished by GC-MS (Ward et al., 2010). Prior to chiral derivatization, metabolite extracts from hypoxic cells were either left unmanipulated or spiked with commercially available standards of D-2HG, L-2HG, or a mixture of D- and L-2HG as references. This technique demonstrated that L-2HG was the major enantiomeric form of 2HG present in hypoxic cells (Figure 1D, S1G, S1H).
Hypoxia-Induced L-2HG Originates from Glutamine-Derived α-KG
Glucose and glutamine represent two major nutrients that proliferating cells uptake and metabolize (Vander Heiden et al., 2009). We performed isotope tracing in SF188 cells supplemented with either [U-13C]glucose or [U-13C]glutamine in order to identify the source of the carbon backbone utilized to produce L-2HG in hypoxia (Figures 2A and 2B). In normoxia, the relatively small pool of total 2HG (Figure 1A) was derived mostly from glutamine with a small contribution from glucose (Figures 2A and 2B). In contrast, the larger pool of hypoxia-induced L-2HG (Figures 1A and 1D) was derived exclusively from glutamine (Figures 2A and 2B).
Figure 2. Hypoxia-Induced L-2HG Originates from Glutamine-Derived α-Ketoglutarate.

(A and B) Isotope tracing was performed in SF188 cells cultured in medium containing either [U-13C]glucose or [U-13C]glutamine. The graph depicts the fraction of intracellular 2HG labeled by 13C at the indicated time. A similar labeling pattern was observed in RCC4 and CS-1 cells (data not shown).
(C) SF188 cells were cultured for 48 hr in 21% or 0.5% O2 in the presence of vehicle (DMSO) or 5 mM dimethyl-α-KG. Total intracellular 2HG was assessed by GC-MS. Graph shows mean +/- SD of triplicate samples. Representative data from 1 of 3 independent experiments are shown.
(D and E) SF188 cells were cultured as in (C), then chiral derivatization of metabolites was performed to allow separation of 2HG enantiomers by GC-MS. (D) shows an overlay of GC-MS histograms for 2HG on the same scale. (E) shows individual GC-MS histograms for 2HG. The color code of the graphs for (D) and (E) is the same as shown in (C). L-2HG (left) elutes at a shorter retention time than D-2HG (right) as in (1D). Representative data from 1 of 5 independent experiments are shown.
Since cellular metabolism of glutamine generates α-ketoglutarate (Fan et al., 2013), we reasoned that hypoxia-induced L-2HG might arise from enzymatic reduction of glutamine-derived α-KG. We tested the effect of supplementing cells with a cell-permeable form of α-KG. Addition of cell-permeable dimethyl-α-KG to cells in normoxia resulted in a modest increase in intracellular 2HG, while in hypoxia there was a nearly 100-fold increase in 2HG (Figure 2C), which was confirmed to be L-2HG by chiral derivatization (Figures 2D and 2E).
Hypoxia-Induced L-2HG Results from Promiscuous Substrate Usage by LDHA
In order to determine the enzymatic source(s) of hypoxia-induced L-2HG, we ablated candidate metabolic enzymes by siRNA (Figure 3). Knockdown of IDH1 or IDH2 did not impair production of L-2HG in hypoxic SF188 cells (Figure 3A). Likewise, HEK293T cells subjected to siRNA-mediated ablation of IDH1, IDH2, or both IDH1 and IDH2 together, exhibited no dependence on these enzymes for production of L-2HG in response to hypoxia (Figure S2A). These observations are consistent with the fact that the α-hydroxyl group in naturally occurring isocitrate (analogous to the α-hydroxyl group of 2HG) always exists in the D-(R)- enantiomeric conformation due to stereochemical constraints of enzymatic reactions catalyzed by isocitrate dehydrogenases (Sprecher et al., 1964).
Figure 3. Hypoxia-Induced L-2HG Arises via Promiscuous Substrate Usage by LDHA.

(A, B, C) SF188 cells were transfected with siRNAs targeting (A) IDH1 (IDH1-a, -b) and/or IDH2 (IDH2-a, -b), (B) MDH1 (MDH1-a, -b) and/or MDH2 (MDH2-a, -b), or (C) LDHA (LDHA-a, -b, -c, -d). 48 hr after transfection, cells were transferred to 21% or 0.5% O2 for an additional 24 to 48 hr, followed by measurement of intracellular 2HG. Western blot confirms target knockdown efficiency and shows hypoxia-induced expression of HIF1α. Expression of either S6 protein or α-tubulin are shown as loading controls.
(D) SF-XL cells were transfected with siRNAs targeting LDHA (LDHA-b) or both LDHA and MDH2 (LDHA-b/MDH2-b). 48 hr after transfection, cells were transferred to 0.5% O2 and cultured for an additional 48hr in the presence of vehicle (DMSO) or the indicated concentrations of dimethyl-α-KG (DMαKG), followed by measurement of intracellular 2HG. Western blot confirms target knockdown efficiency with α-tubulin shown as loading control.
(E). Schematic summarizing enzymatic sources of hypoxia-induced L-2HG. For each panel, representative data from 1 of 3 independent experiments are shown. See also Figures S2 and S3.
Metabolic enzymes can exhibit ‘promiscuous’ catalytic activities (Linster et al., 2013), and previous cellular fractionation studies implicated cytosolic malate dehydrogenase 1 (MDH1) and mitochondrial malate dehydrogenase 2 (MDH2) as possible enzymatic sources of L-2HG (Rzem et al., 2007). We tested the requirement for metabolic enzymes whose primary catalytic activities involve reduction of α-ketoacid substrates to L-hydroxyl acids with structural similarities to α-KG and L-2HG, respectively (Figure 3E). In SF188 cells, we identified a partial contribution from MDH1 and MDH2 to hypoxia-induced L-2HG (Figure 3B). Strikingly, however, lactate dehydrogenase A (LDHA) was identified as the major enzyme required for hypoxia-induced L-2HG in SF188 cells (Figure 3C). These observations were confirmed in HEK293T cells, where combined ablation of LDHA and MDH2 also resulted in a near total abrogation of hypoxia-induced L-2HG, although the relative contributions of each enzyme varied slightly between cell types (Figures S2B and S2C). In contrast, ablation of LDHB did not have a substantial effect on hypoxia-induced L-2HG (Figure S2D). Collectively, these findings suggest that hypoxic cells can produce L-2HG from reduction of glutamine-derived α-KG in the cytosol via alternative substrate usage by LDHA, with a smaller contribution from cytosolic MDH1 and mitochondrial MDH2 (Figure 3E).
We sought to address the possibility that ablation of LDHA might indirectly inhibit hypoxic induction of L-2HG through altered glutamine oxidation or perturbed mitochondrial metabolism. To test if increasing cytosolic α-KG can increase L-2HG production, we ablated LDHA alone or LDHA and MDH2 together, then added cell-permeable α-KG under hypoxic conditions (Figure 3D). In hypoxic cells transfected with non-targeting control siRNA, supplementation with cell-permeable α-KG resulted in a dose-dependent increase in L-2HG. In contrast, siRNA-mediated ablation of LDHA was sufficient to block α-KG-mediated enhancement of hypoxia-induced L-2HG. Combined ablation of both LDHA and MDH2 resulted in a modest further decrease in α-KG-mediated enhancement of L-2HG.
Abrogation of hypoxia-induced L-2HG had no significant effects on HIF1α protein levels (Figures 3B and 3C). Previous reports demonstrated that L-2HG can stabilize HIF1α in normoxia via L-2HG-mediated inhibition of the EGLN family of α-KG-dependent prolyl hydroxylases that mark HIF1α for proteasomal degradation (Chowdhury et al., 2011; Koivunen et al., 2012). Consistent with these observations, we noted minor increases in HIF1α protein levels in hypoxic cells subjected to ablation of L2HGDH (with consequent enhancement of hypoxia-induced L-2HG) (Figure 1C). However, it appears that reduced oxygen availability (0.5%) is sufficient to impair the activity of EGLN prolyl hydroxylases even in the absence of elevations in L-2HG (Figure 3C).
We found no absolute requirement for HIF1α in the hypoxic production of L-2HG (Figures S2E, S2G, S2H). Nonetheless, HIF1α enhanced hypoxia-induced L-2HG in some contexts (Figure S2H), such as VHL-deficient RCC4 cells which display enhanced LDHA levels in a HIF1α-dependent manner (Hu et al., 2003). In contrast, the lack of effect in some cancer cell lines (e.g. SF188) was consistent with the fact that knockdown of HIF1α in these cells did not have a substantial effect on LDHA expression (Figure S2F). Taken together, these findings suggest that HIF1α can contribute to L-2HG production, but that LDHA expression in the absence of HIF1α can be sufficient for production of L-2HG in response to hypoxia.
The Active Site of LDHA Can Accommodate Reduction of α-KG to L-2HG
To better understand how LDHA might catalyze reduction of α-KG to L-2HG, we performed molecular docking of putative substrates to the active site of LDHA. The resulting docking poses demonstrated that pyruvate is spatially coordinated by hydrogen bonding to the carboxylic acid head group and adjacent carbonyl group (Figure S3A). Nucleophilic attack of pyruvate’s carbonyl carbon by the hydride group from NADH is spatially restricted such that the reductive reaction exclusively produces the L-(S)- enantiomer of lactate (Figure S3B). Likewise, molecular docking of α-ketoglutarate showed that it could favorably adopt a similar spatial coordination to pyruvate via identical hydrogen bonding to the carboxylic acid head group and adjacent carbonyl group (Figure S3C). Analogous to the reduction of pyruvate to L-lactate, nucleophilic attack of the carbonyl carbon of α-KG is spatially constrained such that L-2-hydroxyglutarate would be the exclusive end product of the reductive reaction (Figure S3D). Taken together, these findings further support the genetic data identifying LDHA as a major enzymatic source of hypoxia-induced L-2HG (Figures 3C, 3D, S2B, S2C).
L-2HG Mediates Enhanced H3K9me3 in Response to Hypoxia
Biochemically, both D-2HG and L-2HG have been reported to inhibit the Jumonji family histone lysine demethylase KDM4C, resulting in aberrant accumulation of trimethylated histone 3 lysine 9 (H3K9me3) and impairment of normal cellular differentiation (Chowdhury et al., 2011; Lu et al., 2012). In glioblastomas, IDH1/2 mutation is associated with diffuse increases in H3K9me3 throughout the tumor, whereas H3K9me3 shows regional variations in tumors without IDH1/2 mutation (Venneti et al., 2013). The above results suggest that the variability in H3K9me3 staining in IDH1/2-wildtype glioblastomas might correlate with regions of hypoxia. Therefore, we investigated the correlation between HIF1α expression and H3K9me3 by immunohistochemistry using 47 human glioblastoma samples wildtype for IDH1/2 (Figures 4A and S4). HIF1α expression and H3K9me3 were highly statistically correlated in these samples (p=0.01) (Figure 4B).
Figure 4. L-2HG is Necessary and Sufficient for Enhanced Trimethylation of Histone 3 Lysine 9 in Response to Hypoxia.

(A) HIF1α expression and H3K9me3 levels were assessed by immunohistochemistry in human glioblastomas specimens with (n=26) or without (n=21) hypoxic regions captured in the biopsy. Scale bars are shown in the bottom left of each panel.
(B) Quantification of H3K9me3 staining intensity (pixel units) within biopsies not expressing (-) or expressing (+) HIF1α. Values represent mean +/- SD; *p=0.01 determined by unpaired two-tailed Student’s t test.
(C) SF188 glioblastoma cells stably infected with empty lentiviral vector (Vector) or lentiviral vector encoding L2HGDH were cultured for 48 hr in 21% or 0.5% O2, followed by histone extraction and assessment of H3K9me3 by Western blot.
(D) SF188 glioblastoma cells stably infected with lentiviruses expressing non-targeting shRNA (Cont) or shRNAs targeting L2HGDH (L1, L3) were cultured in 21% or 0.5% O2, followed by histone extraction and assessment of H3K9me3 by Western blot.
(E) Bulk histones were incubated with purified human KDM4C in a reaction mixture with α-KG (1mM), as well as the indicated concentrations of L-2HG or D-2HG. H3K9me3 was assessed by Western blot with total H3 used as loading control. Panels in (C), (D), and (E) show representative data from 1 of 3 independent experiments. See also Figure S4.
These observations suggested that hypoxia-induced L-2HG might mediate the enhancement of H3K9me3 observed in vascularly compromised regions of human glioblastoma. To test this hypothesis, the human glioblastoma cell line SF188 was stably infected with a lentivirus expressing L2HGDH or an empty lentiviral vector. SF188 glioblastoma cells infected with empty vector exhibited increased global levels of H3K9me3 in response to hypoxia (Figure 4C), consistent with the findings from the primary glioblastoma specimens (Figures 4A, 4B, and S4). However, when hypoxia-induced L-2HG was abrogated by overexpression of L2HGDH (Figure S4G), there was a substantial reduction in hypoxia-induced H3K9me3 (Figure 4C). Conversely, ablation of L2HGDH (with consequent increase of hypoxia-induced L-2HG) resulted in increased H3K9me3 (Figure 4D). A similar pattern, albeit less robust, was observed with H3K27me3. Histone demethylation assays were also performed in vitro to determine whether the effect on H3K9me3 might be mediated through direct inhibition of KDM4C by hypoxia-induced L-2HG. Addition of purified KDM4C to histone substrates resulted in demethylation of H3K9me3 that was sensitive to inhibition by L-2HG, in a dose dependent manner (Figure 4E).
DISCUSSION
The above results demonstrate that production of 2HG can be regulated in response to hypoxia. Contrary to expectations, the stereoisomer of 2HG that accumulates in hypoxia was found to be L-2HG rather than the D-2HG produced as a byproduct of either mutation in or reverse flux through IDH1/2 (Ward and Thompson, 2012). L-2HG has been long believed to represent a minor byproduct of ongoing cellular metabolism produced by enzymes which use α-KG as an alternative ketoacid substrate (Linster et al., 2013). Analyses of ketoacid reduction by purified oxidoreductases have demonstrated that both LDH and MDH enzymes can produce L-2HG from α-KG in vitro (Meister, 1950; Rzem et al., 2007; Schatz and Segal, 1969). The major determinant of alternative substrate utilization in vitro is substrate concentration. During normoxic cellular metabolism, evidence suggests that the major source of L-2HG is from mitochondrial MDH using TCA cycle-generated α-KG as an alternative substrate (Rzem et al., 2015; Rzem et al., 2007). The data presented here confirm that MDH enzymes can contribute to L-2HG production. However, inhibition of MDH enzymes was only modestly able to reduce the L-2HG that accumulated when cells were exposed to hypoxia. In contrast, ablation of LDHA suppressed the majority of hypoxia-induced L-2HG.
Hypoxia induces a reprogramming of intermediate metabolism which alters levels of enzymes and substrates that might contribute to increased production of L-2HG (Bensaad and Harris, 2014; Semenza, 2013). Under conditions of hypoxia, glucose metabolism is redirected into anaerobic glycolysis, with enhanced LDHA activity driven by both increased enzyme levels and increased cytosolic reducing equivalents in the form of NADH (Hu et al., 2003; Kucharzewska et al., 2015). While normoxic cells utilize glutamine as the primary anapleurotic substrate, hypoxia decreases oxidative TCA cycle activity resulting in cytosolic accumulation of glutamine-derived α-KG (Metallo et al., 2012). Our findings indicate that the metabolic reprogramming in hypoxic cells favors conversion of cytosolic glutamine-derived α-KG into L-2HG via enzymatic reduction by LDHA. Hence, lactate dehydrogenase makes a greater contribution to hypoxia-induced L-2HG production than malate dehydrogenase. Consistent with in vitro data, the relative contributions of LDH and MDH enzymes to L-2HG production will likely vary depending on subcellular substrate levels and enzyme activities present under different physiologic conditions.
The selective accumulation of L-2HG in hypoxia underscores the importance of distinguishing between 2HG enantiomeric species (Terunuma et al., 2014). L-2HG has been shown to function as a competitive inhibitor of the EGLN prolyl hydroxylases, thus promoting HIF1α accumulation and hypoxic adaptation (Koivunen et al., 2012). In contrast, D-2HG functions as a substrate of EGLN prolyl hydroxylases, promoting hydroxylation and degradation of HIF1α, thus impeding hypoxic adaptation. Taken together, the present results favor a supportive role for hypoxia-induced L-2HG in reinforcing the HIF1α axis and maintaining cellular adaptation to hypoxia, properties not shared by D-2HG.
In contrast to their disparate roles in regulating EGLN-dependent proline hydroxylation of HIF1α, both L-2HG and D-2HG function as inhibitors of histone demethylases (Chowdhury et al., 2011; Lu et al., 2012; Xu et al., 2011). We found that hypoxia-induced levels of L-2HG, similar to oncogenic levels of D-2HG, result in enhanced repressive histone methylation. Consistent with this finding, Shim et al. (2014) have recently shown that loss of L2GHDH during cancer progression results in accumulation of L-2HG and alterations in repressive histone methylation similar to those observed here in response to hypoxia. Finally, our results studying biopsies from patients with glioblastomas suggest that hypoxic induction of L-2GH may contribute to the development of epigenetic heterogeneity in this tumor type. Whether these results apply to other tumor types will be the subject of future investigations.
EXPERIMENTAL PROCEDURES
Cell Culture
Adherent cell lines SF188, SF-XL (SF188 cells with stable expression of Bcl-XL), HEK293T, SH-SY5Y, SV40-immortalized MEFs, and RCC4 were maintained in high glucose DMEM, while hematopoietic cell lines 32D and FL5.12 were maintained in RMPI, with 10% FBS, glucose 25 mM, glutamine 4 mM, penicillin 100 units/ml, and streptomycin 100 microgram/ml and split every 2-3 days before reaching confluency. For hypoxia experiments, cells were cultured in a hypoxia chamber (Coy) at 0.5% oxygen for 24 to 48 hr prior to harvest. See Supplemental Experimental Procedures for detailed information regarding siRNAs, shRNAs, and Western Blotting.
Metabolite Extraction and GC-MS Analysis
Metabolites were extracted, derivatized, and analyzed by GC-MS as previously described (Carey et al., 2015). See Supplemental Experimental Procedures for details. For chiral derivatization, cells were harvested in 80% methanol without internal standard. Methanol-extracted metabolites were dried in an evaporator (Genevac EZ-2 Elite), resuspended in water, run over AG 1-X8 anion exchange columns (Bio-Rad), eluted by 3N HCl, divided into 4 fractions, spiked with D-(R)-2HG and/or L-(S)-2HG standards (Sigma) or left unspiked, dried in an evaporator, sequentially derivatized with R(-)-2-butantol (Sigma) then acetic anhydride (Sigma) with heating to 95oC, dried under nitrogen flow, resuspended in ethyl acetate and analyzed by GC-MS. 2HG was identified as m/z 173 with confirmatory ions m/z 187, 229, 260. Chiral derivatization by this method allows for separation of L-2HG and D-2HG enantiomers by gas chromatography with L-2HG eluting at a shorter retention time than D-2HG. Figure S1F presents an example of the mass spectra used to identify chiral-derivatized 2HG species. Peak identity was confirmed by the presence of specific secondary ions in the electron impact (EI) spectra and retention time of authentic D- and L-2HG standards.
Human Glioblastoma Specimens and Immunohistochemical Analysis
Human glioblastoma biopsy specimens were obtained from the University of Pennsylvania following approval from the institutional review board. All cases were contained in a previously well-characterized tissue microarray, and immunohistochemical studies and quantification were performed as previously described (Venneti et al., 2013). See Supplemental Experimental Procedures for details.
Statistical Analyses
Error bars represent standard deviation of the mean (SD) as indicated in figure legends. Comparisons were made using unpaired Student’s t-tests (determined with GraphPad Prism) where indicated.
Supplementary Material
Acknowledgments
We thank members of the Thompson laboratory for helpful discussions, especially Tullia Lindsten for her assistance with preparation of the manuscript. A.M.I. was supported by the Conquer Cancer Foundation of ASCO Young Investigator Award and the NIH Ruth L. Kirschstein National Research Service Award. The work was also supported, in part, by grants from NIH R01 CA168802-02 and the Memorial Sloan Kettering Cancer Center Support Grant P30 CA008748. C.B.T. is a founder of Agios Pharmaceuticals and a member of its scientific advisory board. C.B.T. also serves on the board of directors of Merck.
Footnotes
AUTHOR CONTRIBUTIONS
A.M.I. and C.B.T. conceived the project, designed the experiments, analyzed the data, and wrote the manuscript. A.M.I. performed the experiments with assistance from R.G.D., L.W.S.F., C.L., and J.R.C. The glioblastoma tissue microarray was constructed and analyzed by S.V. and A.R.J. Structural modeling was performed by A.S.R., P.B.G., and J.C.D.
Publisher's Disclaimer: This is a PDF file of an unedited manuscript that has been accepted for publication. As a service to our customers we are providing this early version of the manuscript. The manuscript will undergo copyediting, typesetting, and review of the resulting proof before it is published in its final citable form. Please note that during the production process errors may be discovered which could affect the content, and all legal disclaimers that apply to the journal pertain.
References
- Bensaad K, Harris AL. Hypoxia and metabolism in cancer. Advances in Experimental Medicine and Biology. 2014;772:1–39. doi: 10.1007/978-1-4614-5915-6_1. [DOI] [PubMed] [Google Scholar]
- Carey BW, Finley LW, Cross JR, Allis CD, Thompson CB. Intracellular alpha-ketoglutarate maintains the pluripotency of embryonic stem cells. Nature. 2015;518:413–416. doi: 10.1038/nature13981. [DOI] [PMC free article] [PubMed] [Google Scholar]
- Chowdhury R, Yeoh KK, Tian YM, Hillringhaus L, Bagg EA, Rose NR, Leung IK, Li XS, Woon EC, Yang M, et al. The oncometabolite 2-hydroxyglutarate inhibits histone lysine demethylases. EMBO Reports. 2011;12:463–469. doi: 10.1038/embor.2011.43. [DOI] [PMC free article] [PubMed] [Google Scholar]
- Fan J, Kamphorst JJ, Rabinowitz JD, Shlomi T. Fatty acid labeling from glutamine in hypoxia can be explained by isotope exchange without net reductive isocitrate dehydrogenase (IDH) flux. The Journal of Biological Chemistry. 2013;288:31363–31369. doi: 10.1074/jbc.M113.502740. [DOI] [PMC free article] [PubMed] [Google Scholar]
- Hu CJ, Wang LY, Chodosh LA, Keith B, Simon MC. Differential roles of hypoxia-inducible factor 1alpha (HIF-1alpha) and HIF-2alpha in hypoxic gene regulation. Molecular and Cellular Biology. 2003;23:9361–9374. doi: 10.1128/MCB.23.24.9361-9374.2003. [DOI] [PMC free article] [PubMed] [Google Scholar]
- Koivunen P, Lee S, Duncan CG, Lopez G, Lu G, Ramkissoon S, Losman JA, Joensuu P, Bergmann U, Gross S, et al. Transformation by the (R)-enantiomer of 2-hydroxyglutarate linked to EGLN activation. Nature. 2012;483:484–488. doi: 10.1038/nature10898. [DOI] [PMC free article] [PubMed] [Google Scholar]
- Kranendijk M, Struys EA, Salomons GS, Van der Knaap MS, Jakobs C. Progress in understanding 2-hydroxyglutaric acidurias. Journal of Inherited Metabolic Disease. 2012 doi: 10.1007/s10545-012-9462-5. [DOI] [PMC free article] [PubMed] [Google Scholar]
- Kucharzewska P, Christianson HC, Belting M. Global profiling of metabolic adaptation to hypoxic stress in human glioblastoma cells. PloS One. 2015;10:e0116740. doi: 10.1371/journal.pone.0116740. [DOI] [PMC free article] [PubMed] [Google Scholar]
- Linster CL, Van Schaftingen E, Hanson AD. Metabolite damage and its repair or pre-emption. Nature Chemical Biology. 2013;9:72–80. doi: 10.1038/nchembio.1141. [DOI] [PubMed] [Google Scholar]
- Losman JA, Kaelin WG., Jr What a difference a hydroxyl makes: mutant IDH, (R)-2-hydroxyglutarate, and cancer. Genes & Development. 2013;27:836–852. doi: 10.1101/gad.217406.113. [DOI] [PMC free article] [PubMed] [Google Scholar]
- Lu C, Ward PS, Kapoor GS, Rohle D, Turcan S, Abdel-Wahab O, Edwards CR, Khanin R, Figueroa ME, Melnick A, et al. IDH mutation impairs histone demethylation and results in a block to cell differentiation. Nature. 2012;483:474–478. doi: 10.1038/nature10860. [DOI] [PMC free article] [PubMed] [Google Scholar]
- Meister A. Reduction of alpha gamma-diketo and alpha-keto acids catalyzed by muscle preparations and by crystalline lactic dehydrogenase. The Journal of Biological Chemistry. 1950;184:117–129. [PubMed] [Google Scholar]
- Metallo CM, Gameiro PA, Bell EL, Mattaini KR, Yang J, Hiller K, Jewell CM, Johnson ZR, Irvine DJ, Guarente L, et al. Reductive glutamine metabolism by IDH1 mediates lipogenesis under hypoxia. Nature. 2012;481:380–384. doi: 10.1038/nature10602. [DOI] [PMC free article] [PubMed] [Google Scholar]
- Moroni I, Bugiani M, D’Incerti L, Maccagnano C, Rimoldi M, Bissola L, Pollo B, Finocchiaro G, Uziel G. L-2-hydroxyglutaric aciduria and brain malignant tumors: a predisposing condition? Neurology. 2004;62:1882–1884. doi: 10.1212/01.wnl.0000125335.21381.87. [DOI] [PubMed] [Google Scholar]
- Rzem R, Achouri Y, Marbaix E, Schakman O, Wiame E, Marie S, Gailly P, Vincent MF, Veiga-da-Cunha M, Van Schaftingen E. A mouse model of L-2-hydroxyglutaric aciduria, a disorder of metabolite repair. PloS One. 2015;10:e0119540. doi: 10.1371/journal.pone.0119540. [DOI] [PMC free article] [PubMed] [Google Scholar]
- Rzem R, Vincent MF, Van Schaftingen E, Veiga-da-Cunha M. L-2-hydroxyglutaric aciduria, a defect of metabolite repair. Journal of Inherited Metabolic Disease. 2007;30:681–689. doi: 10.1007/s10545-007-0487-0. [DOI] [PubMed] [Google Scholar]
- Schatz L, Segal HL. Reduction of alpha-ketoglutarate by homogeneous lactic dehydrogenase X of testicular tissue. The Journal of Biological Chemistry. 1969;244:4393–4397. [PubMed] [Google Scholar]
- Semenza GL. HIF-1 mediates metabolic responses to intratumoral hypoxia and oncogenic mutations. The Journal of Clinical Investigation. 2013;123:3664–3671. doi: 10.1172/JCI67230. [DOI] [PMC free article] [PubMed] [Google Scholar]
- Shim EH, Livi CB, Rakheja D, Tan J, Benson D, Parekh V, Kho EY, Ghosh AP, Kirkman R, Velu S, et al. l-2-Hydroxyglutarate: An Epigenetic Modifier and Putative Oncometabolite in Renal Cancer. Cancer Discovery. 2014;4:1290–1298. doi: 10.1158/2159-8290.CD-13-0696. [DOI] [PMC free article] [PubMed] [Google Scholar]
- Sprecher M, Berger R, Sprinson DB. Stereochemical Course of the Isocitrate Lyase Reaction. The Journal of Biological Chemistry. 1964;239:4268–4271. [PubMed] [Google Scholar]
- Terunuma A, Putluri N, Mishra P, Mathe EA, Dorsey TH, Yi M, Wallace TA, Issaq HJ, Zhou M, Killian JK, et al. MYC-driven accumulation of 2-hydroxyglutarate is associated with breast cancer prognosis. The Journal of Clinical Investigation. 2014;124:398–412. doi: 10.1172/JCI71180. [DOI] [PMC free article] [PubMed] [Google Scholar]
- Vander Heiden MG, Cantley LC, Thompson CB. Understanding the Warburg effect: the metabolic requirements of cell proliferation. Science. 2009;324:1029–1033. doi: 10.1126/science.1160809. [DOI] [PMC free article] [PubMed] [Google Scholar]
- Venneti S, Felicella MM, Coyne T, Phillips JJ, Gorovets D, Huse JT, Kofler J, Lu C, Tihan T, Sullivan LM, et al. Histone 3 lysine 9 trimethylation is differentially associated with isocitrate dehydrogenase mutations in oligodendrogliomas and high-grade astrocytomas. Journal of Neuropathology and Experimental Neurology. 2013;72:298–306. doi: 10.1097/NEN.0b013e3182898113. [DOI] [PMC free article] [PubMed] [Google Scholar]
- Ward PS, Patel J, Wise DR, Abdel-Wahab O, Bennett BD, Coller HA, Cross JR, Fantin VR, Hedvat CV, Perl AE, et al. The common feature of leukemia-associated IDH1 and IDH2 mutations is a neomorphic enzyme activity converting alpha-ketoglutarate to 2-hydroxyglutarate. Cancer Cell. 2010;17:225–234. doi: 10.1016/j.ccr.2010.01.020. [DOI] [PMC free article] [PubMed] [Google Scholar]
- Ward PS, Thompson CB. Metabolic reprogramming: a cancer hallmark even warburg did not anticipate. Cancer Cell. 2012;21:297–308. doi: 10.1016/j.ccr.2012.02.014. [DOI] [PMC free article] [PubMed] [Google Scholar]
- Wise DR, Ward PS, Shay JE, Cross JR, Gruber JJ, Sachdeva UM, Platt JM, DeMatteo RG, Simon MC, Thompson CB. Hypoxia promotes isocitrate dehydrogenase-dependent carboxylation of alpha-ketoglutarate to citrate to support cell growth and viability. Proceedings of the National Academy of Sciences of the United States of America. 2011;108:19611–19616. doi: 10.1073/pnas.1117773108. [DOI] [PMC free article] [PubMed] [Google Scholar]
- Xu W, Yang H, Liu Y, Yang Y, Wang P, Kim SH, Ito S, Yang C, Xiao MT, Liu LX, et al. Oncometabolite 2-hydroxyglutarate is a competitive inhibitor of alpha-ketoglutarate-dependent dioxygenases. Cancer Cell. 2011;19:17–30. doi: 10.1016/j.ccr.2010.12.014. [DOI] [PMC free article] [PubMed] [Google Scholar]
Associated Data
This section collects any data citations, data availability statements, or supplementary materials included in this article.