Background: The mTOR and Hippo signaling pathways are deregulated in many cancers and play important roles in glioblastoma tumor growth and development.
Results: mTORC2-mediated phosphorylation of AMOTL2 blocks its ability to inhibit YAP signaling.
Conclusion: An mTORC2/AMOTL2/YAP signaling cascade promotes glioblastoma growth and invasive characteristics.
Significance: Components of cross-talk signaling pathways involving the mTOR and Hippo cascades may be viable targets for antitumor therapies.
Keywords: glioblastoma, Hippo pathway, mechanistic target of rapamycin (mTOR), mTOR complex (mTORC), yes-associated protein (YAP), AMOTL2, mTORC2
Abstract
The mechanistic target of rapamycin (mTOR) and Hippo signaling pathways are two major signaling cascades that coordinately regulate cell growth and proliferation. Dysregulation of these pathways plays a critical role in gliomagenesis. Recent reports have provided evidence of cross-talk between the mTOR and Hippo pathways; however, a complete description of the signaling relationships between these pathways remains to be elucidated. Utilizing a gene-trapping strategy in a mouse glioma model, we report the identification of AMOTL2 as a candidate substrate for mTORC2. AMOTL2 is phosphorylated at serine 760 by mTORC2. Mutation of AMOTL2 mimicking constitutive Ser760 phosphorylation blocks its ability to bind and repress YAP leading to increased relative expression of known YAP gene targets. Moreover, overexpression of AMOTL2 or a nonphosphorylatable AMOTL2-S760A mutant inhibited YAP-induced transcription, foci formation, growth, and metastatic properties, whereas overexpression of a phosphomimetic AMOTL2-S760E mutant negated these repressive effects of AMOTL2 in glioblastoma (GBM) cells in vitro. Similar effects on xenograft growth were observed in GBM cells expressing these AMOTL2 Ser760 mutants. YAP was also shown to be required for Rictor-mediated GBM growth and survival. Finally, an analysis of mTORC2/AMOTL2/YAP activities in primary GBM samples supported the clinical relevance of this signaling cascade, and we propose that pharmacological agents cotargeting these regulatory circuits may hold therapeutic potential.
Introduction
Glioblastomas (GBM)2 are the most common and lethal of all primary brain neoplasms (1). Current treatment regimens encompass radiation and concomitant chemotherapy, yet progress to increase median survival has not been forthcoming and currently remains ∼12 months (2). We and others (3, 4) have demonstrated increased expression of Rictor in GBM. This results in hyperactivated mTORC2 signaling leading to accelerated GBM growth, motility, and invasive characteristics (3, 5).
The mechanistic target of rapamycin (mTOR) kinase is a key signaling integrator of cell size and proliferation (6). The regulation of mTOR also plays a crucial role in cancer initiation and progression, as well as in many other disease states (7, 8). mTOR is found in at least two functionally and structurally distinct protein complexes termed TOR complex 1 (mTORC1) and mTORC2 (9). mTORC1 is defined by its binding partner Raptor, whereas in mTORC2, Rictor and mSIN are found in the complex instead of Raptor. Activation of mTORC1 regulates ribosome biogenesis and mRNA translation via phosphoregulation of p70 ribosomal protein S6 kinase and 4EPB1 (10). Activation of mTORC2 leads to phosphorylation of AKT at Ser473 resulting in its full activation (11).
The Hippo pathway represents a major cell signaling cascade negatively regulating the activity of the YAP/TAZ transcriptional coactivators (12). YAP/TAZ have been demonstrated to control proliferation and survival and are known to confer oncogenic properties, as well as play a role in GBM proliferation, motility, and invasiveness (13). Upon Hippo kinase activation (MST1/2 in mammals), the protein kinase complex LATS1/2-MOB1 phosphorylates several Ser residues within the HXRXXS motif of YAP, and when Ser127 is phosphorylated, YAP binds 14-3-3 proteins and is sequestered in the cytoplasm. The angiomotin family members (AMOT-1 and -2) promote YAP inactivation by regulating YAP localization to the cytoplasm via their direct interactions with the actin cytoskeleton and YAP, leading to YAP phosphorylation by the Hippo pathway (14).
In this study, we utilized a recently developed GEM model, in which glial fibrillary acidic protein Cre (Gfap-Cre)-mediated conditional Rictor overexpression induced intermediate grade gliomas (5). Using a retroviral gene-trapping strategy to identify modifiers that accelerate transformation and growth of cell lines derived from gliomas from these mice, we identified AMOTL2 as a relevant signaling node linking mTOR complex 2 (mTORC2) signaling and the Hippo pathway. Loss of AMOTL2 accelerated Rictor-mediated GBM cell growth, migratory capacity, and invasive properties. Although AMOTL2 expression was maintained in human GBM cell lines and primary tumor specimens, our data support the ability of mTORC2 to negatively regulate AMOTL2 activity post-translationally leading to enhanced YAP function. We show that mTORC2 and AMOTL2 interact via Rictor and that Ser760 of AMOTL2 is phosphorylated by mTORC2. This regulatory phosphorylation event is sufficient to block AMOTL2 binding to YAP and stimulates YAP target gene expression. We further demonstrate that AMOTL2 Ser760 phosphorylation is required for YAP-induced transformation, GBM cell growth, migration, and invasiveness in vitro, and it is required for xenograft growth in mice. Finally, it is shown that YAP is required for Rictor-mediated GBM proliferation, motility, and invasion, and an analysis of primary GBM samples supports the clinical relevance of a mTORC2/AMOTL2/YAP signaling pathway.
Experimental Procedures
Cell Lines, Constructs, Transfections, and Retroviral Transduction
The glioma line H4 and glioblastoma lines U87, T98G, and LN229 were obtained from ATCC (Manassas, VA). The U373 line was obtained from Sigma. MCF10A cells were kindly provided by Norimoto Yanagawa (UCLA). U87Rictor cells stably overexpressing Rictor resulting in heightened mTORC2 activity have been previously described (3). Ric0 cells were derived from gliomas from Gfap-Cre+/Rictor mice (5). Normal mature oligodendrocytes were purified from 129/Sv mice using standard methods (15). The GT1.8bgeo gene trap cassette was introduced into the retroviral vector pGEN− and described previously (16). Transfection of bgeo-pGEN− and pGen− (negative control, empty vector) into EcoPack2-293 cells was performed to generate ecotropic retrovirus and titered as described by the manufacturer (Clontech). Prior to infection, Ric0 cells were grown to 80% confluency, pretreated with 8 mg/ml polybrene, and then infected with a multiplicity of infection of ∼1.5–2. DNA constructs utilized in the yeast two-hybrid binding analyses, composed of portions of RICTOR or AMOTL2, were generated by PCR and individually cloned into pGB12 and pACT2, respectively. Native AMOTL2 was expressed from pCMV6 (Origene Technologies) in which a HA tag was fused. To generate the AMOTL2 Ser760 substitution mutants, the full-length hAMOTL2 cDNA cloned into pCMV6 was mutagenized using the QuikChange II site-directed mutagenesis kit (Agilent Technologies) using appropriate mutagenic primers according to the manufacturer. All plasmids were sequenced to verify the constructs. The FLAG-tagged YAP1 construct was a kind gift from Yosef Shaul (Weizmann Institute). The pCMV6-based murine full-length Amotl2 expression construct was obtained from Origene. siRNAs targeting AMOTL2 or YAP were obtained from Life Technologies, Inc. siRNA transfections were performed using the HiPerfect transfection reagent, and DNA transfections were performed using the Effectene transfection reagent according to the manufacturer (Qiagen). Stable transfectants were selected by G418 resistance (500 μg/ml).
Recombinant Proteins, Antibodies, and Reagents
Recombinant native and mutant AMOTL2 was expressed and purified from HEK293 cells using anti-HA immunoaffinity column chromatography as described previously (17). Antibodies were from the following sources. Anti-phospho(Ser473)-AKT, anti-AKT, anti-phospho(Thr346)-NDRG1, anti-NDRG1, anti-MYC tag, anti-RICTOR, anti-RAPTOR, anti-YAP, anti-phospho(Ser127)-YAP and anti-FLAG were from Cell Signaling; anti-actin, anti-AMOTL2, and anti-CTGF antibody were from Sigma. Anti-HA (12CA5) antibody was from Roche Applied Science. Anti-CYR61 ((CCN1) cysteine-rich angiogenic inducer 61) antibody was from Novus. Anti-phospho(Ser760)-AMOTL2 antibody was generated in rabbits immunized with the phosphorylated peptide CSSSQRAApSLDSVATSR (where pS represents phosphoserine) and subsequently affinity-purified (18). Verteporfin was obtained from Selleckchem and used in vitro at 4 μm. Insulin was obtained from Sigma. Nuclear and cytoplasmic extractions were performed using NE-PER extraction reagents according to the manufacturer (Life Technologies, Inc.).
Protein and mRNA Analyses, Immunoprecipitations, and in Vitro Kinase Assays
Western blot and quantitative RT-PCR analyses were performed as described previously (19). Briefly, for Western blotting, cells or tissues were lysed in RIPA (lysis) buffer containing protease inhibitor mixture and phosSTOP phosphatase inhibitor mixture (Roche Applied Science), and extracts were resolved by SDS-PAGE. Proteins were transferred to PVDF membranes and incubated with the indicated antibodies. For quantitative RT-PCR, extraction of RNA was performed using TRIzol (Life Technologies, Inc.). Total RNA was then quantified and integrity assessed using an Agilent 2100 Bioanalyzer (Agilent Technology). Total RNA was reverse-transcribed with random primers using the RETROscript kit from Life Technologies, Inc. SYBR Green quantitative PCR was performed in triplicate in 96-well optical plates on an ABI Prism 7000 sequence detection system (Life Technologies, Inc.) according to the manufacturer's instructions. Primer sequences for CTGF and CYR61 are available upon request. Immunoprecipitations were performed as described previously (20), except RICTOR immunoprecipitations were performed using 0.3% CHAPS containing lysis buffer as described (11). For TORC2 in vitro kinase assay (11), RICTOR immunoprecipitates captured with protein G-Sepharose were washed four times with 0.3% CHAPS lysis buffer and once in kinase buffer (25 mm Hepes (pH 7.5), 100 mm potassium acetate, 1 mm MgCl2). Reactions were performed in a final volume of 15 μl for 30 min at 37 °C containing 200 ng of purified recombinant AMOTL2 and 500 μm ATP. The reactions were stopped by the addition of 200 μl of ice-cold dilution buffer (20 mm MOPS (pH 7.0), 1 mm EDTA, 0.01% Brij 35, 5% glycerol, 0.1% 2-mercaptoethanol, 1 mg/ml BSA). Supernatants were subsequently analyzed by immunoblotting.
Cell Proliferation, TUNEL, Colony Forming Assays, and Cell Migration Assays
Cells were plated into 96-well plates, and after culturing for various time points, cell numbers were measured by 2,3-bis[2-methoxy-4-nitro-5-sulfophenyl]-2H-tetrazolium-5-carboxanilide inner salt (XTT) assay (Roche Applied Science) as described by the manufacturer. TUNEL staining was performed using the In Situ Cell Death Detection kit (Roche Applied Science) according to the manufacturer's instructions. Colony forming assays were performed as described previously (3). Briefly, 2,500 cells were added to 1.5 ml of media in a 0.4% soft agar overlay of 0.5% agarose beds in 6-well plates. Cells were fed with 2 ml of media once a week for 3 weeks, after which colonies were counted. Cell migration assays were conducted using precoated modified Boyden chambers from EMD Millipore as recommended by the manufacturer and as described previously (3). For invasion assays through Matrigel, 20,000 cells were seeded in the top well of Boyden chambers, which contained growth factor-reduced Matrigel extracellular basement membrane over a polyethylene terephthalate membrane with 8-mm pores (Corning). Cells were allowed to invade for 24 h before the Matrigel was removed, and invading cells were fixed and stained. Cells adhering to the bottom surface of the membrane were counted.
Analysis of Primary Glioblastoma Samples
Flash-frozen normal brain and glioblastoma samples were obtained from the Cooperative Human Tissue Network, NCI, National Institutes of Health (Western Division, Vanderbilt University Medical Center), under an institutional review board-approved protocol. Each glioblastoma sample was histopathologically reviewed, and those containing greater than 95% tumor were utilized in this analysis. Samples were homogenized in RIPA buffer using a Polytron homogenizer (Fisher) to generate protein extracts for Western blot analysis. Sections of paraffin-embedded tumors on slides were processed for immunohistochemistry as described previously (3).
Xenograft Studies
Xenografts of U87, U87-AMOTL2, U87-AMOTL2-S760A, and U87-AMOTL2-S760E cells were performed in female C.B.-17-scid (Taconic) mice as described previously (3). Tumors were harvested at autopsy for Western blot analysis. Statistical analysis was done with Student's t test and analysis of variance models using Systat 13 (Systat Software, Chicago).
Results
Mutagenic Retroviral Screening in a Glial Tumor Line Derived from Rictor Transgenic Mice Identifies AMOTL2, a Hippo Pathway Component
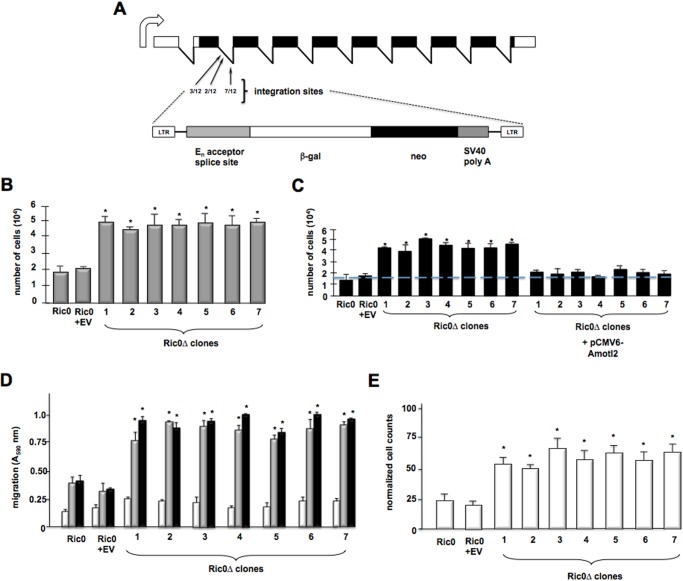
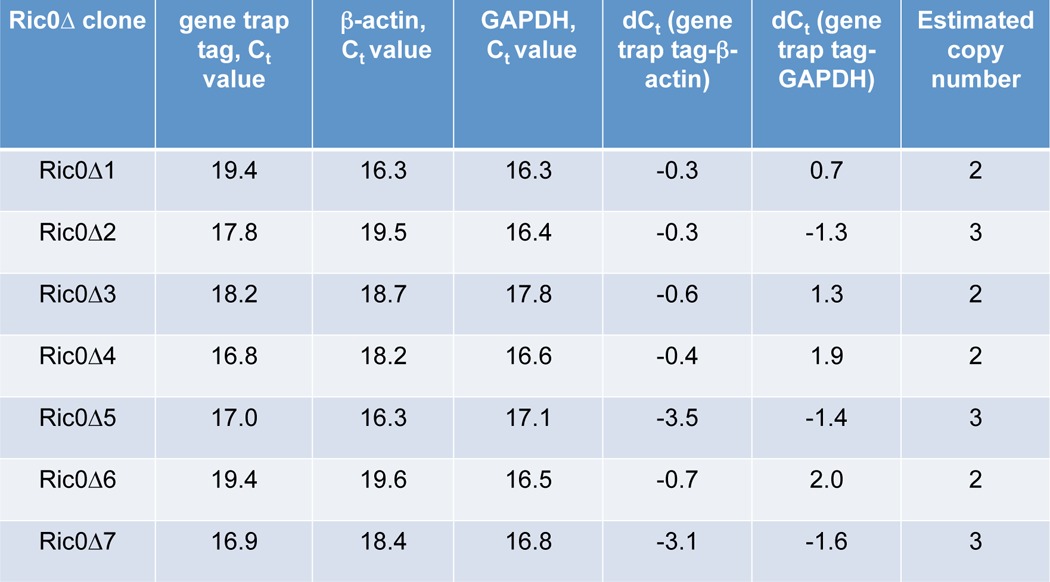
To extend our studies utilizing a Gfap-Cre+/Rictor GEM model, we utilized a retroviral gene-trapping strategy to screen for genetic modifiers that accelerated transformation of Ric0 tumor cells (16). These cells are derived from glial tumors from Gfap-Rictor mice and overexpress Rictor resulting in heightened mTORC2 activity (5). A retroviral gene trap cassette (Fig. 1A), consisting of a strong splice site acceptor immediately upstream of a β-gal-neomycin resistance fusion gene (βgeo) and the empty control vector, was used to transduce 1.2 × 10⁶ normal mouse oligodendrocytes or Ric0 cells with an ∼1.5 multiplicity of infection and was plated in soft agar. No significant colony growth was observed in oligodendrocytes infected with either control or mutagenic retrovirus under these conditions. However, although colony growth was relatively low in Ric0 cells infected with control retrovirus, many larger sized colonies were detected and subsequently expanded in Ric0 cells infected with the gene-trapping cassette containing virus. XTT proliferation assays confirmed a significant growth advantage of the Ric0 mutant cells compared with the parental line or Ric0 cells transduced with control virus (Fig. 1B). Inverse PCR on 31 anchorage-independent gene-trapped Ric0 clones resulted in the identification of seven clones with trapped genes. In all of these clones, the retroviral gene trap cassette integrated within three sites of the second intron of the murine Amotl2 gene (NM_019764.2) (see Fig. 1A). Quantitative real time PCR analysis estimated two to three copies of the gene trap per cell (Table 1) within the seven independent clones. Moreover, re-expression of full-length Amotl2 caused Ric0Δ clones to revert to their previous growth rates, comparable with parental Ric0 cells or Ric0 cells infected with control retrovirus (Fig. 1C). We also assessed whether the Ric0Δ clones had undergone alteration in migratory capacity. Parental, control, and Ric0Δ clones were tested for there ability to transverse either a vitronectin-coated or fibronectin-coated Boyden chamber as compared with chambers coated with bovine serum albumin as a control. As shown in Fig. 1D, the parental and Ric0 control retrovirus-infected cells were able to efficiently migrate toward the vitronectin-coated or fibronectin-coated surfaces relative to BSA-coated surfaces; however, the Ric0Δ clones displayed markedly increased abilities to migrate to vitronectin- or fibronectin-coated surfaces relative to parental or control virus infected Ric0 cells. Additionally, we tested whether the Ric0Δ clones demonstrated increased invasive properties as determined by their ability to invade Matrigel. All of the Ric0Δ clones exhibited significantly enhanced invasive ability relative to parental or control virus-infected Ric0 cells (Fig. 1E).
FIGURE 1.
Proliferation and invasive properties of gene-trapped Ric0 cells derived from the Gfap-Cre+/Rictor GEM model. A, schematic of the murine Amotl2 transcript expressed in the CNS. Integrations of the retroviral gene-trap vector were identified within the second intron of Amotl2. The number of integrations per site is shown in the second intron. B, XTT proliferation assays of parental, control (EV; empty virus-transduced cells), and gene-trapped 1–7 Ric0 mutant clones. 104 cells were initially plated and assayed 48 h later. The means and +S.D. are shown for three independent experiments (*, p < 0.05, significantly different from Ric0 and Ric0 + EV). C, rescue of AMOTL2 expression in Ric0Δ clones. Parental, control (EV; empty virus transduced cells), Ric0Δ clones 1–7, and Ric0Δ clones 1–7 transfected with a mammalian expression plasmid encoding full-length AMOTL2 were subjected to XTT proliferation assays. 104 cells were initially plated and assayed 48 h later. The means and +S.D. are shown for three independent experiments (*, p < 0.05, significantly different from Ric0 and Ric0 + EV). D, relative migration of parental, control, and Ric0Δ clones. Cells were seeded into Boyden chambers and allowed to migrate toward BSA (white bars), vitronectin (gray bars), or fibronectin (black bars). The means and +S.D. are shown for three independent experiments (*, p < 0.05, significantly different from Ric0 and Ric0 + EV). E, invasive potential of parental, control, and Ric0Δ clones migrating through Matrigel. The means and +S.D. are shown for three independent experiments (*, p < 0.05, significantly different from Ric0 and Ric0 + EV).
TABLE 1.
Quantitative real-time PCR analyses of retroviral gene trap copy number
Ct values are the average of three replicates.
Characterization of the AMOTL2 Gene-trapped Ric0Δ Clones, Effects of siRNA-mediated Knockdown of AMOTL2 in U87Rictor GBM Cells and Identification of a Putative mTORC2 Phosphorylation Site in AMOTL2
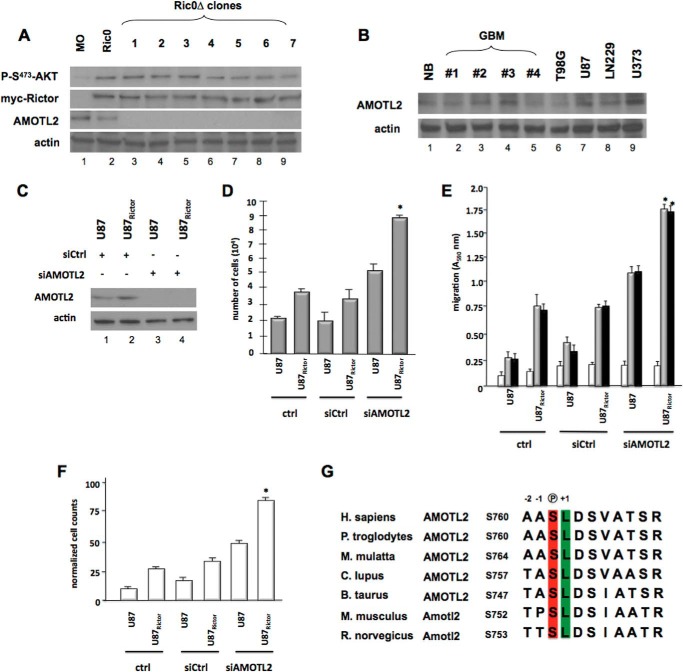
We initially examined the expression levels of AMOTL2 in the disrupted Ric0Δ clones and confirmed the lack of detectable protein in these lines (Fig. 2A). Moreover, we confirmed that the Rictor transgene (myc-Rictor) was expressed and that these lines harbored elevated levels of mTORC2 activity as indicated by high levels of phospho-Ser473-AKT. We then examined whether AMOTL2 expression was maintained in GBM cell lines and primary samples. Surprisingly, AMOTL2 expression was maintained in these samples (Fig. 2B). This suggested to us that possibly enhanced mTORC2 activity might negatively regulate AMOTL2 function post-translationally. Supporting this notion, siRNA-mediated knockdown of AMOTL2 in a previously characterized U87 GBM line overexpressing RICTOR (Fig. 2C) (3) recapitulated the effects of disruption of AMOTL2 in Ric0 cells in terms of growth (Fig. 2D), migration (Fig. 2E), and invasive characteristics (Fig. 2F).
FIGURE 2.
mTORC2 signaling and AMOTL2 expression in Ric0Δ gene-trapped clones, effects of siRNA-mediated knockdown of AMOTL2 in U87Rictor cells, and identification of potential mTORC2 phosphorylation site within AMOTL2. A, immunoblot analysis of protein extracts from isolated mature oligodendrocytes, parental Ric0, and gene-trapped Ric0Δ (lanes 1–7) clones using antibodies against the indicated proteins. B, immunoblot analysis of AMOTL2 expression in primary GBM samples and cell lines. NB, normal brain; primary samples GBM lanes 1–4. C, AMOTL2 knockdown following 24 h of incubation with siRNAs targeting AMOTL2 or nontargeting control (Ctrl) in U87 and U87Rictor cells. Expression of AMOTL2 and actin was analyzed by immunoblot at the 24-h time point. D, effects of AMOTL2 knockdown on Rictor-mediated proliferation. The indicated cell lines were treated with control (Ctrl) nontargeting or AMOTL2-targeting siRNAs and growth-assessed by XTT proliferation assays at 48 h. The means and +S.D. are shown for three independent experiments (*, p < 0.05, significantly different from U87Rictor and U87Rictor siCtrl). E, AMOTL2 knockdown stimulates RICTOR-mediated migratory capacity. Cells were seeded into Boyden chambers and allowed to migrate toward BSA (white bars), vitronectin (gray bars), or fibronectin (black bars). The means and +S.D. are shown for three independent experiments (*, p < 0.05, significantly different from U87Rictor and U87RictorsiCtrl). F, effects of AMOTL2 knockdown on RICTOR-mediated invasive properties of U87 and U87Rictor GBM cells migrating through Matrigel. The means and +S.D. are shown for three independent experiments (*, p < 0.05, significantly different from U87Rictor and U87RictorsiCtrl). G, potential conserved mTOR phosphorylation site within AMOTL2. Sequence alignment showing conservation of AMOTL2 Ser760 among vertebrates. Phosphoserine is shown in red and +1 position conserved leucine residue is shown in green.
An analysis of the AMOTL2 protein sequence identified a potential mTOR consensus phosphorylation site involving serine 760. This site also encompassed a conserved leucine in the +1 position, which is unique to mTORs among previously profiled kinases (21, 22). As shown in Fig. 2G, this site is well conserved in human, chimp, rhesus monkey, dog, cow, mouse, and rat AMOTL2 proteins. Moreover, in a recent phospho-proteomics study (21), a torin-sensitive (active site mTOR inhibitor) mouse Amotl2 phospho-peptide was identified encompassing this serine residue. Thus, we proceeded to determine whether AMOTL2 might be a bona fide mTORC2 substrate and examine the effects this potential phosphorylation may have on AMOTL2 function.
mTORC2 Interacts with AMOTL2 and Phosphorylates Ser760
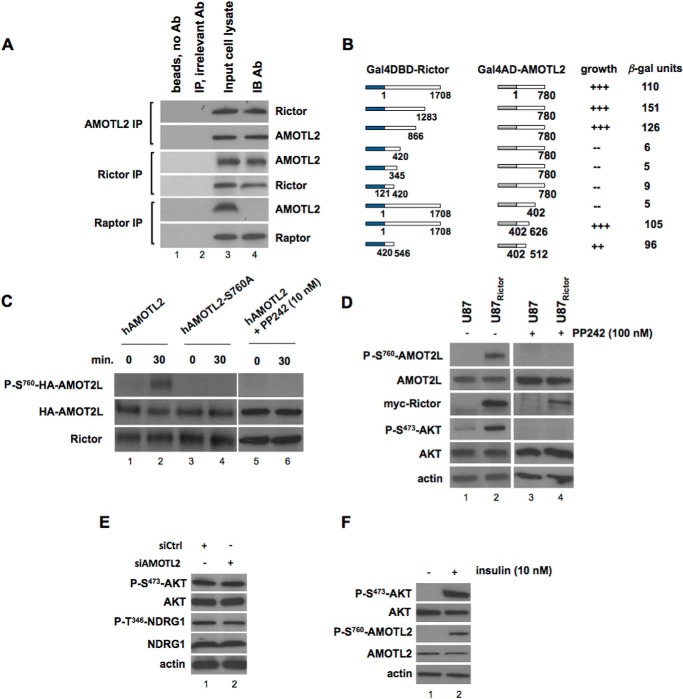
In a previous large scale yeast two-hybrid screen utilizing the mTORC2 regulatory subunit RICTOR as bait, we identified several interacting clones containing regions of AMOTL2 suggesting a potential interaction (23). To confirm a direct association, we initially conducted coimmunoprecipitation experiments. As shown in Fig. 3A, endogenous RICTOR from U87 cells was detectable in the immunoprecipitates of AMOTL2. Similarly, in the immunoprecipitates of RICTOR, AMOTL2 was detectable, although antibodies to the mTORC1 subunit RAPTOR were unable to immunoprecipitate AMOTL2. These data supported the notion that Rictor specifically associates with AMOTL2. To further characterize this interaction, we constructed a series of deletion mutants shown in Fig. 3B and mapped putative interaction domains via yeast two-hybrid analysis. Full-length human RICTOR or AMOTL2 was fused to either the Gal4-activation domain or the Gal4-DNA binding domain, respectively, and these constructs were transformed into the two-hybrid strain AH109. Transformants were plated on selective media to assess growth, and the relative strength of the interactions was determined by liquid β-galactosidase assays. As shown, a 126-amino acid region in the N-terminal half of Rictor (amino acids 420–546) is necessary and sufficient for binding with full-length AMOTL2 in this context. A region of AMOTL2, within a conserved coil-coil domain (amino acids 402–512) was required for significant reporter activity with full-length RICTOR. Fusions of only the interacting domains of these two protein pairs was sufficient to induce high levels of β-gal reporter activity and growth under selective conditions. We subsequently determined whether immunoprecipitated mTORC2 would phosphorylate recombinant AMOTL2 in in vitro kinase assays (Fig. 3C). Additionally, we generated phospho-specific AMOTL2 antibodies in rabbits, which specifically recognized serine 760 phosphorylation. The specificity of this antibody was confirmed in preabsorption experiments in which the immunogenic AMOTL2 phosphopeptide used to generate the antisera effectively blocked immunoblot binding of recombinant serine 760-phosphorylated AMOTL2, whereas an identical nonphosphorylated control peptide was unable to do so (data not shown). mTORC2 robustly phosphorylated AMOTL2 as detected by the phospho-Ser760-AMOTL2 antibody; however, a nonphosphorylatable AMOTL2 S760A substitution mutant was unable to be phosphorylated. The observed mTORC2-mediated AMOTL2 phosphorylation was also inhibitable by the mTOR1/2 inhibitor PP242. We were able to detected endogenous AMOTL2 Ser760 phosphorylation in U87 GBM cells stably transfected with Rictor shown to harbor elevated mTORC2 activity (Fig. 3D) (3). Treatment of U87 and U87Rictor cells with the mTOR kinase inhibitor PP242 abrogated mTORC2-mediated AMOTL2 Ser760 phosphorylation. Moreover, as AMOTL2 interacts with mTORC2, we ascertained whether this association also effects mTORC2 substrate phosphorylation. As shown in Fig. 3E, neither the direct mTORC2 substrate AKT nor the downstream mTORC2/SGK1 substrate NDRG1 phosphorylation was affected by AMOTL2 knockdown in RICTOR-overexpressing cells. Insulin stimulation, a well known activator of mTORC2, also enhanced AMOTL2 Ser760 phosphorylation (Fig. 3F). Collectively, these data establish AMOTL2 as a substrate for mTORC2 and identify at least one specific site, serine 760, as an mTORC2 phosphorylation site both in vitro and in vivo.
FIGURE 3.
AMOTL2 is a direct target of mTORC2. A, AMOTL2 interacts with RICTOR in vivo. AMOTL2, RICTOR, or RAPTOR was immunoprecipitated (IP) from U87 cells, and Western blots were subsequently performed on the immunoprecipitates for the indicated proteins. IB, immunoblot. Lane 1, beads without antibody (Ab); lane 2, immunoprecipitation using and irrelevant antibody (actin antibody); lane 3, input U87 cell lysate; lane 4, immunoblot antibody. As a control, in RAPTOR immunoprecipitates AMOTL2 was not detected attesting to the specificity of the interaction. B, schematic diagrams of the deletion mutant constructs of Gal4DBD-RICTOR or Gal4AD-AMOTL2 that were cotransfected into AH109 yeast cells to determine whether an interaction between the proteins was detectable via activation of the HIS3 reporter (+++, strong growth; ++ moderate growth; −, no growth). Colonies that grew were assayed for β-gal activity. C, mTORC2 in vitro kinase assay was performed utilizing RICTOR immunoprecipitates isolated from U87 cells and incubated with purified native human or S760A mutated recombinant HA-tagged AMOTL2 for the indicated time points. Reactions containing native AMOTL2 were performed in the absence or presence of PP242 as shown. Kinase reactions were subsequently immunoblotted using a phospho-specific antibody generated against phospho-Ser760-AMOTL2, HA, or Rictor antibodies for detection. D, U87 and U87Rictor cells were treated in the absence or presence of the mTORC1/2 inhibitor PP242 for 24 h, and lysates were immunoblotted for the indicated proteins. U87Rictor cells harboring hyperactivated mTORC2 express elevated levels of phospho-Ser760-AMOTL2, which is abrogated by treatment with the mTORC1/2 inhibitor PP242. E, U87Rictor cells were treated with siRNAs targeting AMOTL2 or nontargeting control (Ctrl) for 24 h, and cell lysates were analyzed by immunoblotting for the indicated proteins. F, effects of insulin stimulation in U87 cells. Cells were stimulated with insulin (10 nm, 5 h), lysed, and extracts immunoblotted for the indicated proteins.
Ser760-phosphorylated AMOTL2 Is Incapable of Binding YAP and Leads to Enhanced Expression of YAP Target Genes
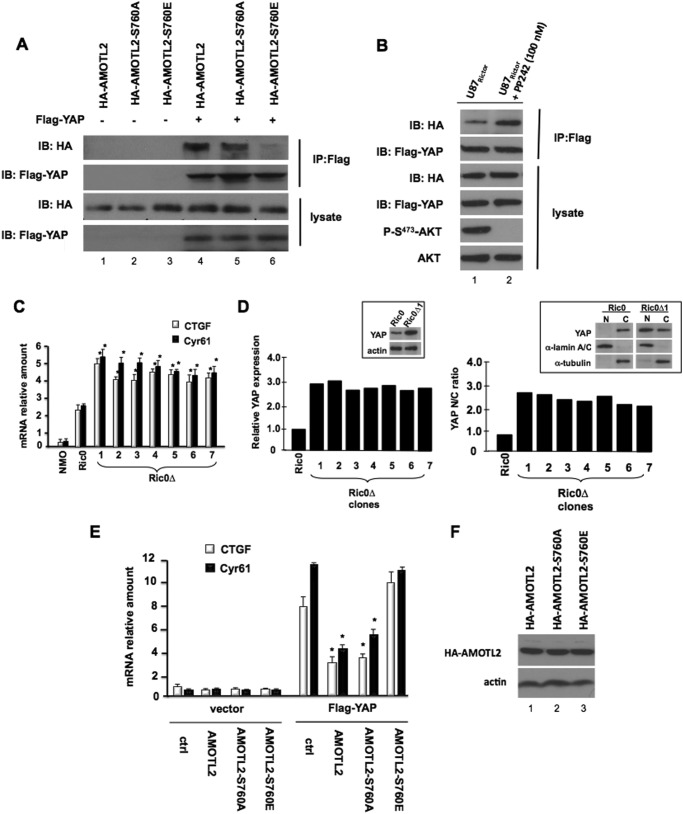
AMOTL2 interacts strongly with YAP and suppresses YAP-mediated transactivation (14, 24, 25). To determine whether the phosphorylation event on serine 760 had a functional role in the ability of AMOTL2 to bind to YAP and effect target gene expression, we cotransfected YAP with native human AMOTL2, a nonphosphorylatable (S760A) AMOTL2, or a phosphomimetic (S760E) AMOTL2 and assessed their ability to bind YAP via coimmunoprecipitation as shown in Fig. 4A. Immunoprecipitated YAP efficiently bound native and the nonphosphorylatable AMOTL2-S760A proteins; however, a phosphomimetic AMOTL2-S760E mutant displayed a marked inhibition of its ability to coimmunoprecipitate with YAP. Moreover, the association of AMOTL2 with YAP was dependent on the degree of mTORC2 signaling as the association of these two proteins markedly increased in U87Rictor cells upon blockade of mTORC2 with PP242 (Fig. 4B). We subsequently determined whether the Ric0Δ clones in which AMOTL2 was disrupted exhibited altered expression of the YAP target genes CTGF and CYR61. As shown in Fig. 4C, each of the Ric0Δ lines expressed significantly elevated mRNA levels of both the CTGF and CYR61 transcripts as compared with normal murine oligodendrocytes or Ric0 cells. Ric0Δ clones also expressed increased YAP relative to Ric0 cells and displayed elevated nuclearly associated YAP (Fig. 4D). Moreover, in U87 cells stably cotransfected with YAP and native AMOTL2, the nonphosphorylatable AMOTL2 or the phosphomimetic AMOTL2 mutants, native AMOTL2 or the nonphosphorylatable AMOTL2 mutant, markedly inhibited YAP-induced transcription of CTGF and CYR61, although expression of the phosphomimetic AMOTL2 negated the repressive effects of AMOTL2 (Fig. 4E). All of these constructs were expressed at similar levels (Fig. 4F). These data support that phosphorylation of serine 760 on AMOTL2 inhibits its ability to function as a physiological inhibitor of YAP transcriptional coactivator activity.
FIGURE 4.
Ser760 phosphorylation of AMOTL2 blocks YAP binding and results in increased expression of YAP target genes. A, YAP was cotransfected with human AMOTL2, AMOTL2-S760A, or AMOTL2-S760E into U87 cells. YAP was immunoprecipitated (IP) with anti-FLAG antibody, and coimmunoprecipitated AMOTL2 proteins were analyzed by anti-HA immunoblotting. IB, immunoblot. B, YAP was cotransfected with human AMOTL2, AMOTL2-S760A, or AMOTL2-S760E into U87Rictor cells and treated with PP242 (100 nm, 2.5 h) as indicated. YAP was immunoprecipitated with anti-FLAG antibody, and coimmunoprecipitated AMOTL2 proteins were analyzed by anti-HA immunoblotting. C, YAP target genes CTGF and CYR61 are induced in Ric0Δ clones in which AMOTL2 is disrupted. RNA was extracted from the indicated cells (NMO, normal mature oligodendrocytes), and mRNA levels of CTGF and CYR61 were examined by quantitative RT-PCR. RT-PCR measurements were done in quadruplicate, and the means and +S.D. are shown (*, p < 0.05, significantly different from normal mature oligodendrocytes and Ric0). D, relative YAP expression levels in Ric0 and Ric0Δ clones 1–7 (left panel). Inset shows immunoblot of YAP expression from Ric0 and Ric0Δ1 cells. Nuclear/cytoplasmic ratio (N/C ratio) of YAP in Ric0 and Ric0Δ clones 1–7 (right panel). Inset shows immunoblot of nuclear (N) and cytoplasmic (C) fractions from Ric0 and Ric0Δ#1 cells. α-Lamin A/C and α-tubulin were immunoblotted as markers for nuclear and cytoplasmic fractions, respectively. E, U87 cells coexpressing YAP and native AMOTL2, nonphosphorylatable AMOTL2-S760A, or phosphomimetic AMOTL2-S760E were assayed for CTGF and CYR61 expression by quantitative RT-PCR. RT-PCR measurements were done in quadruplicate, and the means and +S.D. are shown (*, p < 0.05, significantly different from control (ctrl) and AMOTL2–760E). F, lysates from the indicated cell lines were immunoblotted using anti-HA and actin antibodies as shown.
AMOTL2 Ser760 Mutants Affect YAP-induced Transformation, Growth, Migration, and Invasiveness
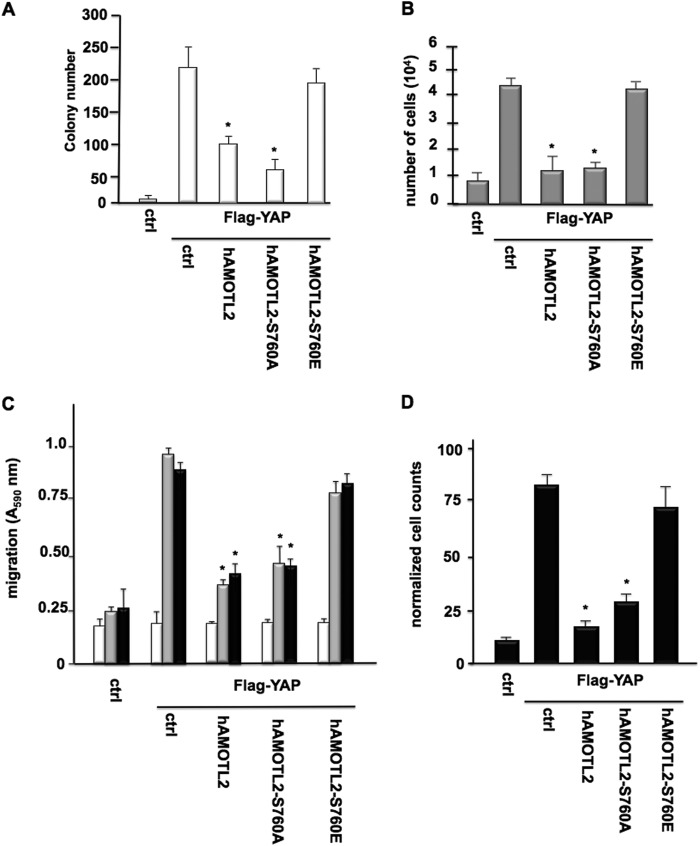
We then examined whether the serine 760 phosphorylation event on AMOTL2 had effects on YAP-mediated cellular functions. As shown in Fig. 5A, YAP-induced transformation was significantly reduced by coexpression of native AMOTL2 or the nonphosphorylatable AMOTL2 allele. However, expression of phosphomimetic AMOTL2 resulted in the enhancement of YAP-induced foci numbers to values comparable with control groups expressing YAP alone. Cotransfection experiments in U87 cells with YAP and native AMOTL2, the nonphosphorylatable AMOTL2, or phosphomimetic AMOTL2 assessing cell proliferation were consistent with the effects seen on YAP-induced oncogenic activity. YAP-induced cell growth was inhibited by expression of native or nonphosphorylatable AMOTL2; however, expression of the phosphomimetic allele restored proliferation rates of cotransfected cells to control values of cells expressing YAP alone (Fig. 5B). Similarly, the effects of coexpression of the AMOTL2 nonphosphorylatable or phosphomimetic alleles on YAP-induced GBM cell migration and invasiveness mirrored those observed for oncogenic activity and cell growth. As shown in Fig. 5C, coexpression of native AMOTL2 or the nonphosphorylatable AMOTL2 mutant inhibited YAP-induced migration toward either fibronectin- or vitronectin-coated substrates, although coexpression of YAP with the phosphomimetic AMOTL2 yielded values comparable with cells expressing YAP only. In Fig. 5D, cells coexpressing YAP and native or the nonphosphorylatable AMOTL2 also exhibited a reduced capacity to invade Matrigel, although YAP and phosphomimetic AMOTL2-coexpressing cells had similar abilities to invade Matrigel as cell expressing YAP alone. These data support the role of the serine 760 phosphorylation of AMOTL2 in the regulation of YAP-induced cellular function.
FIGURE 5.
AMOTL2 Ser760 phosphorylation is essential for YAP-induced transformation, proliferation, and migration. A, YAP-induced foci formation in MCF10A cells cotransfected with YAP and native AMOTL2, AMOTL2-S760A, or AMOTL2-S760E. The numbers of foci were determined, and the means and +S.D. are shown (*, p < 0.05, significantly different from control (ctrl) and AMOTL2-S760E). B, XTT proliferation assays of U87 cells cotransfected with YAP and AMOTL2, AMOTL2-S760A, or AMOTL2-S760E. 104 cells were plated and assayed 48 h later. The means and +S.D. are shown for three independent experiments (*, p < 0.05, significantly different from control (ctrl) and AMOTL2-S760E). C, YAP-induced migration of U87 cells cotransfected with YAP and native AMOTL2, AMOTL2-S760A, or AMOTL2-S760E. Cells were seeded into Boyden chambers and allowed to migrate toward BSA (white bars), vitronectin (gray bars), or fibronectin (black bars). The means and +S.D. are shown for three independent experiments (*, p < 0.05, significantly different from control (ctrl) and AMOTL2-S760E). D, YAP-induced invasive properties of U87 cells coexpressing YAP and native AMOTL2, AMOTL2-S760A, or AMOTL2-Ser760E migrating through Matrigel. The means and +S.D. are shown for three independent experiments. (*, p < 0.05, significantly different from control (ctrl) and AMOTL2-S760E).
AMOTL2 Ser760 Phosphorylation Is Required for GBM Tumor Growth in Vivo
We next sought to determine the relevance of mTORC2-mediated AMOTL2-Ser760 phosphorylation for tumor growth in mice. Parental U87 or U87 cells stably expressing native AMOTL2, the phospho-null (AMOTL2-S760A), or the phosphomimetic mutants (AMOTL2-S760E) were implanted subcutaneously in SCID mice and monitored for growth for up to 70 days. As shown in Fig. 6A, parental U87 xenografts grew robustly requiring sacrifice of the host by day 44 following implantation. The U87-AMOTL2- and U87-AMOTL2-S760E-expressing xenografts grew at comparable rates; however, xenografted cells expressing the phospho-null AMOTL2-S760A mutant grew at a markedly reduced rate with a significantly longer latency period (∼42 days following injection; p < 0.05) as compared with tumors formed by U87, U87-AMOTL2, or U87-AMOTL2-S706E cells. Tumors harvested at autopsy displayed weights consistent with their overall growth rates (Fig. 6B). The phospho-null AMOTL2-S760A mutant-expressing tumors had a markedly reduced average tumor weight relative to U87-AMOTL2- or the phosphomimetic U87-AMOTL2-S760E-expressing tumors. Extracts from U87-AMOTL2, U87-AMOTL2-S760A, and U87-AMOTL2-S760E tumors showed similar transgene expression, although YAP activity, as monitored by phospho-Ser127-YAP expression and whose phosphorylation at this site results in YAP cytoplasmic retention (26, 27), was significantly increased in U87-AMOTL2-S760A tumors compared with U87-AMOTL2 or U87-AMOTL2-S760E tumors (Fig. 6C). Finally, expression of the YAP target genes CTGF and CYR61 was also markedly reduced in the phospho-null AMOTL2-S760A-expressing tumors compared with CTGF and CYR61 expression in U87-AMOTL2 or U87-AMOTL2-S760E tumors (Fig. 6D). These data strongly suggest that the mTORC2-mediated AMOTL2 Ser760 phosphorylation event plays a major role in GBM tumor growth in vivo.
FIGURE 6.
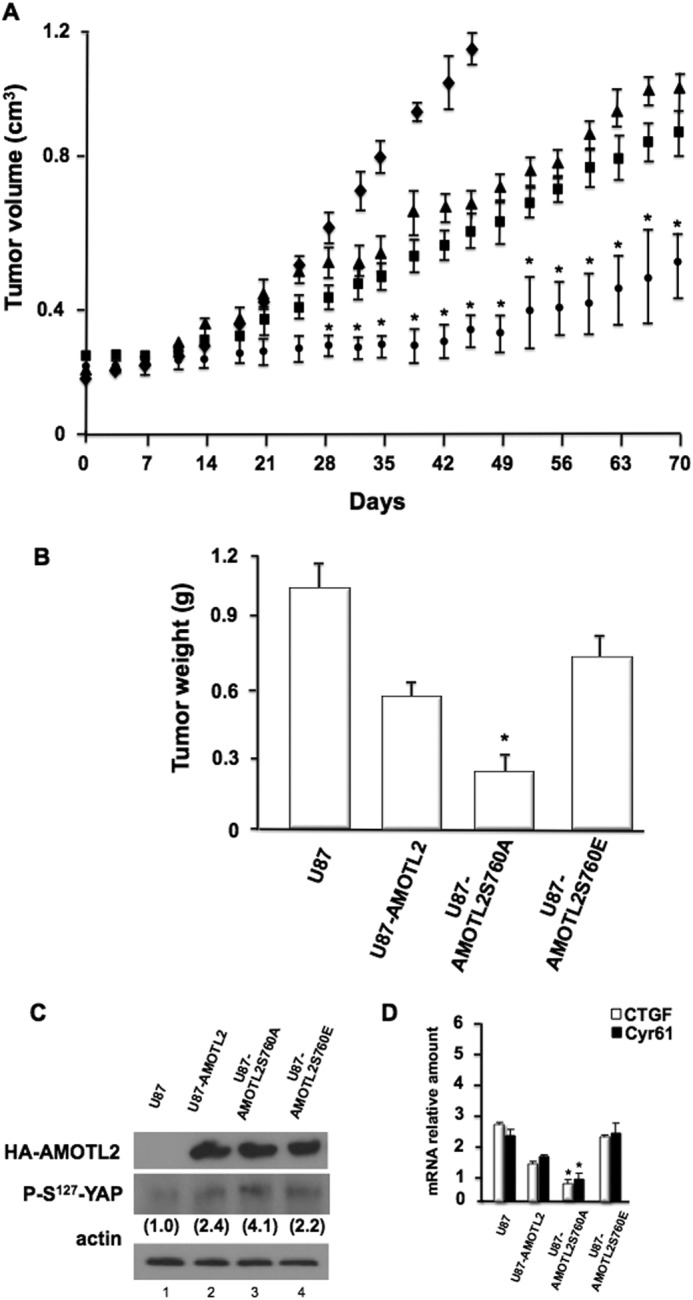
AMOTL2 Ser760 phosphorylation is required for in vivo GBM tumor growth. A, growth of parental U87 (♦), U87AMOTL2 (▴), U87AMOTL2-S760A (●), or U87AMOTL2-S760E (■) subcutaneous xenografts in SCID mice (n = 4–5 per group; *, p < 0.05, significantly different from U87, U87-AMOTL2, and U87-AMOTL2-S760E). B, average tumor weight at sacrifice (*, p < 0.05, significantly different from U87, U87-AMOTL2, and U87-AMOTL2-S760E). C, immunoblot of lysates from the indicated cells after tumor harvest at autopsy. Protein levels of HA-tagged AMOTL2, phospho-Ser127-YAP, and actin are shown. Values in parentheses are fold increases in phospho-Ser127-YAP expression relative to parental U87 expression levels as determined by densitometric measurements. D, mRNA levels of CTGF and CYR61 isolated from the indicated cells after tumor harvest at autopsy. Levels were determined by quantitative RT-PCR. Measurements were done in quadruplicate, and the means and +S.D. are shown (*, p < 0.05, significantly different from U87, U87-AMOTL2, and U87-AMOTL2-S760E).
YAP Is Required for RICTOR-mediated Abnormal GBM Proliferation and Survival
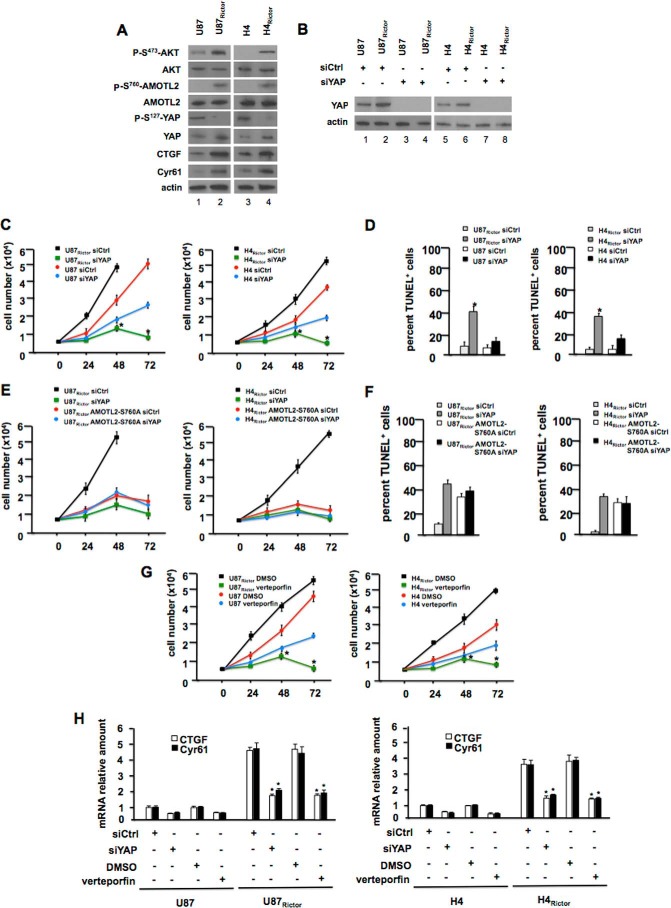
We subsequently examined whether YAP contributed to RICTOR-mediated GBM growth. YAP protein levels were increased by 3-fold in U87 cells stably overexpressing Rictor and by 4-fold in H4 glioma cells overexpressing Rictor (Fig. 7A) compared with controls. The increase in YAP expression was paralleled by decreased phospho-Ser127-YAP (phosphorylation of this residue leads to YAP inactivation) and increased expression of the YAP targets CTGF and CYR61. Moreover, we observed increased phospho-Ser760-AMOTL2 levels in U87Rictor and H4Rictor lines relative to controls. Upon YAP knockdown, proliferation of both U87Rictor and H4Rictor lines was inhibited (Fig. 7, B and C) in comparison with controls, and cell viability was also sensitive to YAP knockdown in the context of RICTOR overexpression, as both U87Rictor and H4Rictor cells were reduced in cell numbers at the 72-h time points. Accordingly, as shown in Fig. 7D, the number of TUNEL-positive U87Rictor and H4Rictor apoptotic cells increase significantly following YAP knockdown. We also performed cell proliferation and apoptosis determinations following YAP knockdown in U87Rictor or H4 Rictor cells overexpressing the AMOTL2 S760A mutant. As shown, overexpression of AMOTL2 S760A markedly inhibited proliferation (Fig. 7E) and stimulated apoptosis (Fig. 7F) of U87Rictor cells consistent with its effects on YAP-induced proliferation (see Fig. 5B). Moreover, YAP knockdown in these cells did not further enhance the antiproliferative effects of AMOTL2-S760A overexpression. Similar effects were observed in H4Rictor cells treated in the identical manner. Pharmacological inhibition of YAP activity utilizing verteporfin, a compound that blocks YAP binding to TEA domain transcription family member transcription factors (28), had similar effects on RICTOR-mediated GBM cell proliferation as YAP knockdown (Fig. 7G), and verteporfin treatment blunted YAP target gene expression in U87Rictor and H4Rictor cells relative to controls (Fig. 7H). Collectively, these data demonstrate that YAP activity is essential for RICTOR-mediated GBM proliferation and survival.
FIGURE 7.
YAP is required for RICTOR-mediated GBM growth and survival. A, mTORC2 and AMOTL2 signaling in U87, U87Rictor, H4, and H4Rictor cell lines. Lysates from the indicated cell lines were immunoblotted for the proteins shown. B, YAP knockdown following 24 h of incubation with siRNAs targeting YAP or nontargeting control (ctrl). Expression of YAP and actin were analyzed by immunoblot at the 24-h time point. C, effects of YAP knockdown on RICTOR-mediated growth. The indicated cell lines were treated with control (Ctrl) or YAP-targeting siRNAs, and growth was assessed by XTT proliferation assays at the indicated time points. The means and +/−S.D. are shown for three independent experiments (left panel, *, p < 0.05, significantly different from U87Rictor siCtrl; right panel, *, p < 0.05, significantly different from H4Rictor siCtrl). D, apoptotic cells were identified by TUNEL assays at the 48-h time point for the indicated lines and treatment groups. The percentage of TUNEL+ cells was determined by counting TUNEL+ nuclei among at least 500 cells in distinct fields of each experiment. Three independent experiments were performed and analyzed. Means and +S.D. are shown (left panel, *, p < 0.05, significantly different from U87Rictor siCtrl; right panel, *, p < 0.05, significantly different from H4Rictor siCtrl). E, effects of YAP knockdown on growth of U87Rictor and U87Rictor AMOTL2-S760A cells (left panel) or H4Rictor and H4Rictor AMOTL2-S760A cells (right panel). The indicated cell lines were treated with control (Ctrl) or YAP-targeting siRNAs and growth assessed by XTT proliferation assays at the indicated time points. The means and +/−S.D. are shown for three independent experiments. F, TUNEL assays of U87Rictor and U87Rictor AMOTL2-S760A cells (left panel) or H4Rictor and H4Rictor AMOTL2-S760A cells (right panel). Three independent experiments were performed and analyzed. Means and +S.D. are shown. G, effects of verteporfin exposure on Rictor-mediated proliferation. The indicated cell lines were treated with control (Ctrl) or YAP-targeting siRNAs and growth was assessed by XTT proliferation assays at the indicated time points. The means and +S.D. are shown for three independent experiments (left panel, *, p < 0.05, significantly different from U87Rictor DMSO; right panel, *, p < 0.05, significantly different from H4Rictor DMSO). H, effects of YAP knockdown or verteporfin exposure on RICTOR-induced YAP target gene expression. CTGF and CYR61 mRNA levels were determined by quantitative RT-PCR. Measurements were done in quadruplicate, and the means and +S.D. are shown (left panel, *, p < 0.05, significantly different from U87RictorsiCtrl and U87RictorDMSO groups; right panel, *, p < 0.05, significantly different from H4RictorsiCtrl and H4RictorDMSO groups).
Enhanced mTORC2 and YAP Activities Correlate with Increased Phospho-Ser760 AMOTL2 Levels in GBM
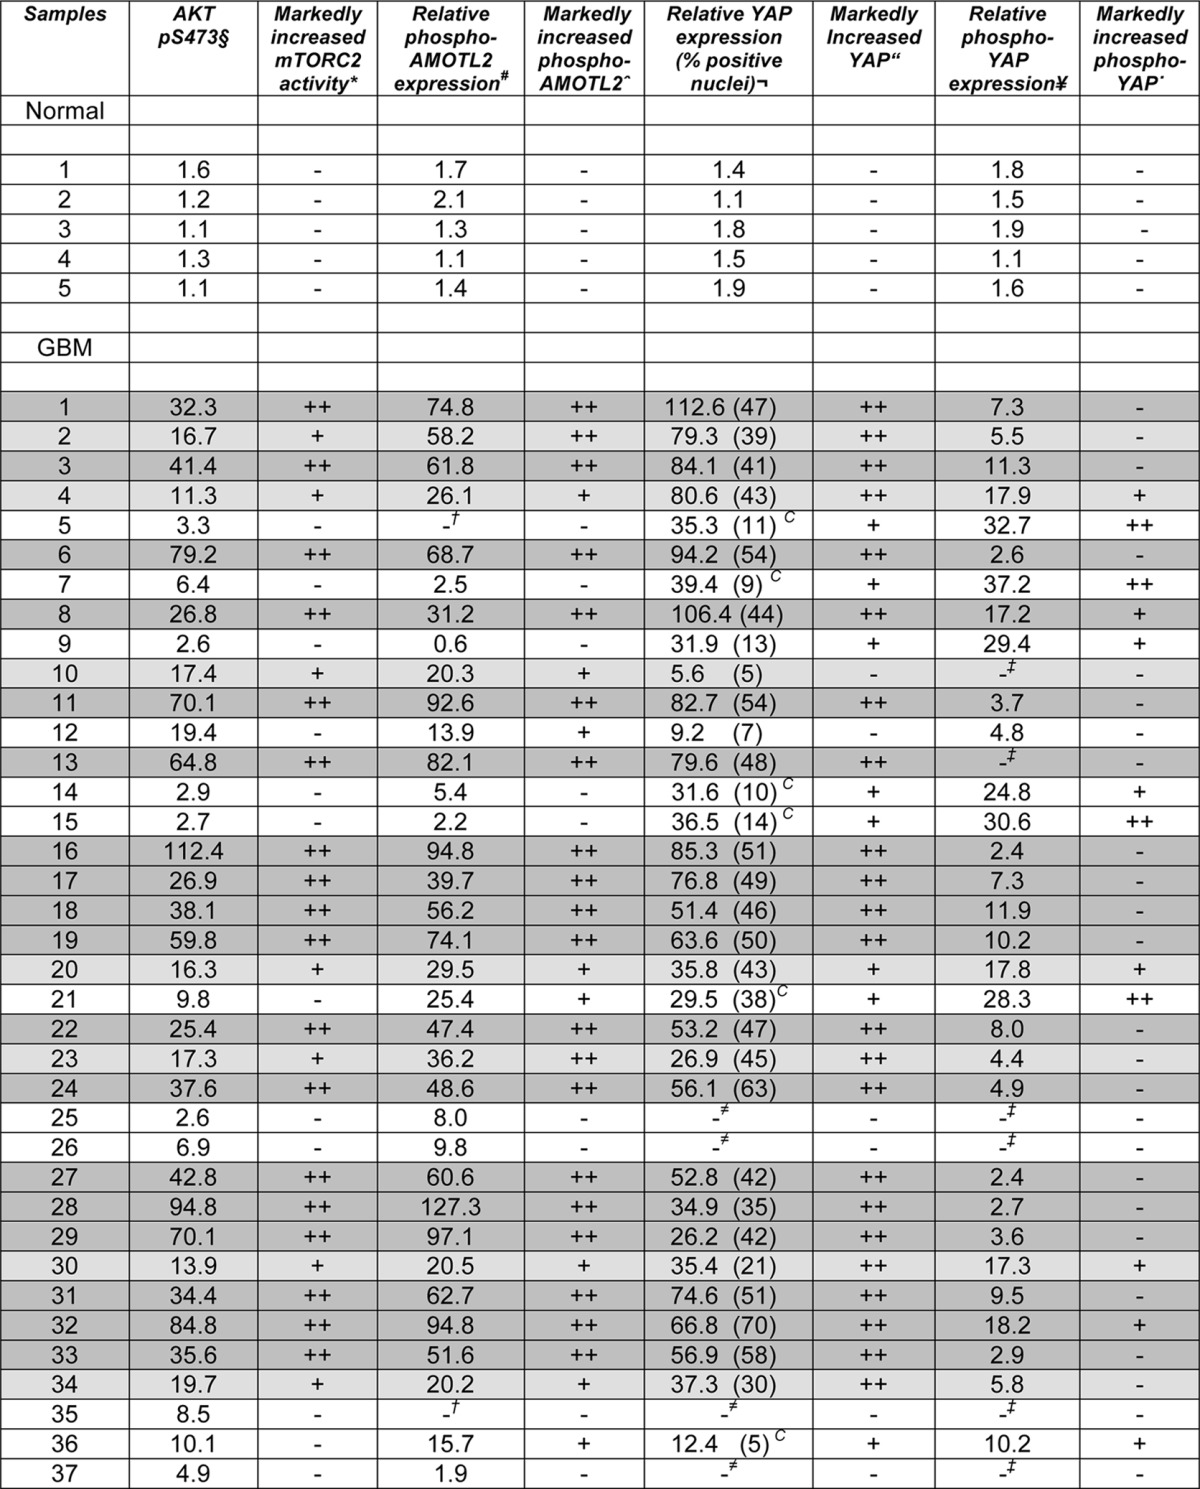
To determine whether the signaling relationships we had observed in cell lines were also present in patients, we analyzed an independent set of 37 GBM and five normal brain samples. Each tumor sample was confirmed histologically, and extracts were prepared and analyzed by Western blot for the relative abundances of phospho-Ser473-AKT, phospho-Ser760-AMOTL2, phospho-Ser127-YAP, and total YAP. Total AKT and AMOTL2 protein levels were assessed as well and did not show major differences in expression levels relative to normal brain (data not shown). The degree of cytoplasmic versus nuclearly localized YAP was also assessed in each tumor sample by immunohistochemical staining (Fig. 8A). As shown in Table 2, the relative level of mTORC2 activity (phospho-Ser473-AKT) was markedly elevated in 25 of 37 samples (68%, p < 0.05) in agreement with our previous results and those of others (4). Phospho-Ser760-AMOTL2 and phospho-Ser127-YAP was elevated in 75% (28 of 37, p < 0.05) and 32% (12 of 37, p < 0.05) of samples, respectively. Total YAP was elevated in 89% (33 of 37, p < 0.05) of GBM samples, which is comparable with previous reports of elevated YAP immunoreactivity in high grade CNS tumors, including GBM (29). A significant direct correlation was observed between samples containing elevated mTORC2 activity and increased phospho-Ser760-AMOTL2 expression (p < 0.01). Moreover, elevated phospho-Ser473-AKT and phospho-Ser760-AMOTL2 were inversely correlated with elevated phospho-Ser127-YAP levels (p < 0.05 and p < 0.01, respectively). We also noted a direct correlation between increased nuclear YAP immunoreactivity and elevated phospho-Ser760-AMOTL2 expression (p < 0.05). These results corroborate the signaling pathway delineated in our GBM cell line experiments, in primary tumors, whereby activated mTORC2 phosphorylates AMOTL2 blocking its ability to inhibit YAP.
FIGURE 8.
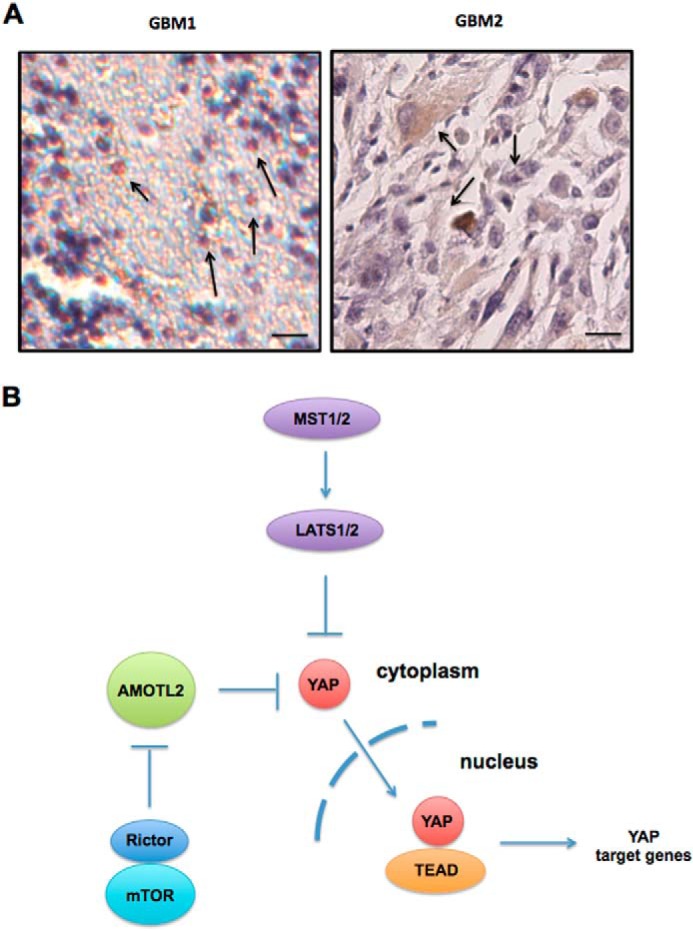
Expression of YAP in primary GBM samples and model of mTORC2/AMOTL2/YAP signaling in GBM. A, representative images of GBM sections immunohistochemically stained for YAP1. GBM1 demonstrated nuclear staining (arrows) associated with activated YAP, and GBM2 displayed YAP immunoreactivity within the cytoplasmic compartment (arrows) where YAP is sequestered. Bar, 10 μm. B, in this model, mTORC2 inhibits the YAP negative regulator AMOTL2 by phosphorylating serine 760. This phosphorylation event blocks AMOTL2 binding to YAP, permitting nuclear translocation and subsequent activation of YAP target genes.
TABLE 2.
Relative activities of mTORC2, AMOTL2, and YAP in 37 primary glioblastoma samples
Note: five normal brains and 37 quick-frozen GBM samples were assessed for phosphorylated AKT, AMOTL2, and YAP levels by Western blot analyses as described under “Experimental Procedures” and quantified by densitometry. Eighteen of 37 tumor samples (49%) had markedly higher mTORC2 activity as determined by monitoring expression levels of phospho-Ser473-AKT relative to normal brain. AMOTL2 and YAP activity was determined by monitoring phospho-Ser760-AMOTL2 and phospho-Ser127-YAP, respectively. The percentage of nuclei positive for YAP or cytoplasmically localized YAP was also determined via immunohistochemical staining. Mean percent of nuclei positive in YAP1-positive tumors is shown in parentheses.
§Phospho-Ser473-AKT expression is >2-fold above the mean of normal brain.
*Markedly increased mTORC2 activity is shown as follow: ++, >20-fold increase above the mean of normal brain (dark gray-shaded row); +, >10-fold increase above the mean of normal brain (light gray-shaded row).
#Phospho-Ser760-AMOTL2 expression >2-fold above the mean of normal brain is shown.
†Undetectable phospho-Ser760-AMOTL2 is shown.
∧Markedly increased phospho-S760-AMOTL2 expression; ++ >20-fold increase above mean of normal brain + >10-fold increase above mean of normal brain.
¬Total YAP expression of >2-fold above mean of normal brain. C indicates significant cytoplasmic YAP staining.
“Markedly increased YAP expression is shown; ++, >20-fold increase above mean of normal brain and >10-fold increase above normal brain.
≠Undetectable YAP expression is shown.
¥Phospho-Ser127-YAP expression is >2-fold above the mean of normal brain.
′Markedly increased phospho-Ser127-YAP expression is shown; ++, >20-fold increase above mean of normal brain; +, >10-fold increase above mean of normal brain.
‡Undetectable phospho-Ser127-YAP is shown.
Discussion
The mTOR and Hippo pathways are two major regulators of cell and organ growth, and as such, it is expected that a high degree of coordination would exist between these pathways (30). Our data provide a mechanism by which the mTORC2 signaling axis may regulate YAP activity via the effects on AMOTL2. Our work supports the hypothesis that mTORC2 is able to phosphorylate Ser760 of AMOTL2 resulting in the blockade of its YAP-binding properties leading to activation of YAP target genes (see Fig. 8B).
Our data suggest that within the angiomotin family, AMOTL2 is uniquely regulated by mTORC2. The Ser760 site is not conserved in other AMOT family members; however, it appears to be conserved across mammalian species. We also attempted to identify specific phosphosites in AMOT130, AMOT80, and AMOTL1; however, in in vitro mTORC2 kinase assays with these substrates no significant phosphorylation was observed (data not shown). We cannot rule out the possibility that additional factors or other secondary modifications are required to promote mTORC2 phosphorylation of other AMOT family members.
Our data also suggest that Rictor may have additional negative regulatory effects on the Hippo pathway. The observation that Ser127-YAP phosphorylation is markedly reduced in U87Rictor cells (see Fig. 7A) would support such a contention. Paramasivam et al. (31) recently reported that AMOTL2 promotes LATS1/2 activity in vivo, but this effect can be influenced by the relative expression of other AMOT family members suggesting that AMOTs can function as both positive and negative regulators of LATS activity depending on the differential regulation of angiomotin isoforms. It is conceivable that a RICTOR-AMOTL2 complex may negatively regulate LATS1/2 function or MST1/2 activity. Further studies will be required to clarify these signaling relationships.
There is significant experimental evidence suggesting cross-talk mechanisms exist between the mTOR- and Hippo-signaling pathways (32). YAP has been shown to regulate the mTOR pathway via effects on miR-29 expression (33). YAP induces miR-29 transcription that inhibits the translation of PTEN, a key antagonist of PI3K. The inhibition of PTEN by YAP induces PI3K signaling and results in activation of both mTORC1 and mTORC2. In support of this mechanism, recently G protein-coupled receptors have been demonstrated to inhibit the Hippo pathway and activate YAP (34, 35). Importantly, thrombin, a ligand for the G-protein-coupled receptor PAR1, activated YAP1 and inhibited PTEN expression (33). Additionally, in the context of TSC1 ((hamartin) tuberous sclerosis 1) loss, mTOR has been reported to regulate YAP degradation in an ATG7 (autophagy-related protein 7)-dependent manner (36). Our data are compatible with these mechanisms in that they support coordinated regulation of Hippo and mTOR signaling to promote cell growth. It is anticipated that additional levels of cross-talk will be delineated between these two critical pathways.
Both YAP and mTOR signaling have been shown to be required for GBM tumor growth, motility, and invasive characteristics (37). YAP has been reportedly overexpressed in several CNS tumors, including infiltrating gliomas and glioblastoma (38, 39). Orr et al. (29) characterized the expression of YAP1 in four molecular glioblastoma subtypes (classical, mesenchymal, proneural, and neural) and found up-regulated expression of YAP1 in clinically aggressive glioblastoma subtypes associated with the poorest mean survival. The NF2 (neurofibromin 2) gene product, Merlin, regulates tissue homeostasis in mammals via the Hippo pathway through YAP1 (40, 41). Merlin has been demonstrated to suppress glioma growth both in vitro and in vivo and to sensitize glioma cells to chemotherapy and irradiation (42). The role of hyperactivated mTORC1 signaling in GBM is well recognized (43–45). mTORC2 signaling has been demonstrated to play an important role in tumor growth, motility, invasiveness, metabolic reprogramming, and resistance to targeted therapy in GBM (46). Our data demonstrating that AMOTL2 serine 760 phosphorylation is required for GBM cell proliferation, motility, and invasiveness in vitro and for murine xenograft growth support the importance of both the mTORC2 and Hippo pathways in GBM.
In summary, we have identified AMOTL2 as required for RICTOR-mediated GBM cell growth, motility, and invasiveness. We have characterized a putative phosphosite (Ser760) on AMOTL2 that when phosphorylated by mTORC2 abrogates the ability of AMOTL2s to bind and repress YAP leading to enhanced expression of YAP target genes. Further analyses of AMOTL2 mutants demonstrated that phosphorylation of AMOTL2 at serine 760 is required for GBM growth, motility, and invasive character in vitro and in xenograft experiments. The requirement for YAP was also demonstrated in RICTOR-mediated GBM growth. Finally, we demonstrate that enhanced mTORC2 and YAP activities correlate with elevated phospho-Ser760 AMOTL2 levels in GBM patient samples. Additional studies are required to determine the full nature of Hippo and mTOR signaling cross-talk mechanisms.
Acknowledgments
We thank Yosef Shaul, Philippe Soriano, Paul Mischel, and Norimoto Yanagawa for cell lines and reagents. We also are grateful to Jonathan Li and Lauren Anderson for technical assistance. We also thank Alan Lichtenstein, Richard Weisbart, and Robert Nishimura for comments on the manuscript.
This work was supported, in whole or in part, by National Institutes of Health Grant R01CA168700. This work was also supported by the Department of Veterans Affairs. The authors declare that they have no conflicts of interest with the contents of this article.
This article was selected as a Paper of the Week.
- GBM
- glioblastoma
- mTOR
- mechanistic target of rapamycin
- AMOT
- angiomotin
- YAP
- Yes-associated protein
- GEM
- genetically engineered mouse
- GFAP
- glial fibrillary acidic protein
- AKT
- (PKB) protein kinase B
- XTT
- 2,3-bis[2-methoxy-4-nitro-5-sulfophenyl]-2H-tetrazolium-5-carboxanilide inner salt
- EV
- empty virus-transduced cell.
REFERENCES
- 1. Dunn G. P., Rinne M. L., Wykosky J., Genovese G., Quayle S. N., Dunn I. F., Agarwalla P. K., Chheda M. G., Campos B., Wang A., Brennan C., Ligon K. L., Furnari F., Cavenee W. K., Depinho R. A., et al. (2012) Emerging insights into the molecular and cellular basis of glioblastoma. Genes Dev. 26, 756–784 [DOI] [PMC free article] [PubMed] [Google Scholar]
- 2. Stupp R., Mason W. P., van den Bent M. J., Weller M., Fisher B., Taphoorn M. J., Belanger K., Brandes A. A., Marosi C., Bogdahn U., Curschmann J., Janzer R. C., Ludwin S. K., Gorlia T., Allgeier A., et al. (2005) Radiotherapy plus concomitant and adjuvant temozolomide for glioblastoma. N. Engl. J. Med. 352, 987–996 [DOI] [PubMed] [Google Scholar]
- 3. Masri J., Bernath A., Martin J., Jo O. D., Vartanian R., Funk A., Gera J. (2007) mTORC2 activity is elevated in gliomas and promotes growth and cell motility via overexpression of rictor. Cancer Res. 67, 11712–11720 [DOI] [PubMed] [Google Scholar]
- 4. Tanaka K., Babic I., Nathanson D., Akhavan D., Guo D., Gini B., Dang J., Zhu S., Yang H., De Jesus J., Amzajerdi A. N., Zhang Y., Dibble C. C., Dan H., Rinkenbaugh A., et al. (2011) Oncogenic EGFR signaling activates an mTORC2-NF-κB pathway that promotes chemotherapy resistance. Cancer Discov. 1, 524–538 [DOI] [PMC free article] [PubMed] [Google Scholar]
- 5. Bashir T., Cloninger C., Artinian N., Anderson L., Bernath A., Holmes B., Benavides-Serrato A., Sabha N., Nishimura R. N., Guha A., Gera J. (2012) Conditional astroglial Rictor overexpression induces malignant glioma in mice. PLoS One 7, e47741. [DOI] [PMC free article] [PubMed] [Google Scholar]
- 6. Laplante M., Sabatini D. M. (2012) mTOR signaling in growth control and disease. Cell 149, 274–293 [DOI] [PMC free article] [PubMed] [Google Scholar]
- 7. Zoncu R., Efeyan A., Sabatini D. M. (2011) mTOR: from growth signal integration to cancer, diabetes and ageing. Nat. Rev. Mol. Cell Biol. 12, 21–35 [DOI] [PMC free article] [PubMed] [Google Scholar]
- 8. Cornu M., Albert V., Hall M. N. (2013) mTOR in aging, metabolism, and cancer. Curr. Opin. Genet. Dev. 23, 53–62 [DOI] [PubMed] [Google Scholar]
- 9. Cybulski N., Hall M. N. (2009) TOR complex 2: a signaling pathway of its own. Trends Biochem. Sci. 34, 620–627 [DOI] [PubMed] [Google Scholar]
- 10. Kim S. G., Buel G. R., Blenis J. (2013) Nutrient regulation of the mTOR complex 1 signaling pathway. Mol. Cells 35, 463–473 [DOI] [PMC free article] [PubMed] [Google Scholar]
- 11. Sarbassov D. D., Guertin D. A., Ali S. M., Sabatini D. M. (2005) Phosphorylation and regulation of Akt/PKB by the rictor-mTOR complex. Science 307, 1098–1101 [DOI] [PubMed] [Google Scholar]
- 12. Hong W., Guan K. L. (2012) The YAP and TAZ transcription co-activators: key downstream effectors of the mammalian Hippo pathway. Semin. Cell Dev. Biol. 23, 785–793 [DOI] [PMC free article] [PubMed] [Google Scholar]
- 13. Mo J. S., Park H. W., Guan K. L. (2014) The Hippo signaling pathway in stem cell biology and cancer. EMBO Rep. 15, 642–656 [DOI] [PMC free article] [PubMed] [Google Scholar]
- 14. Zhao B., Li L., Lu Q., Wang L. H., Liu C. Y., Lei Q., Guan K. L. (2011) Angiomotin is a novel Hippo pathway component that inhibits YAP oncoprotein. Genes Dev. 25, 51–63 [DOI] [PMC free article] [PubMed] [Google Scholar]
- 15. Suzumura A., Bhat S., Eccleston P. A., Lisak R. P., Silberberg D. H. (1984) The isolation and long-term culture of oligodendrocytes from newborn mouse brain. Brain Res. 324, 379–383 [DOI] [PubMed] [Google Scholar]
- 16. Kamnasaran D., Qian B., Hawkins C., Stanford W. L., Guha A. (2007) GATA6 is an astrocytoma tumor suppressor gene identified by gene trapping of mouse glioma model. Proc. Natl. Acad. Sci. U.S.A. 104, 8053–8058 [DOI] [PMC free article] [PubMed] [Google Scholar]
- 17. Urh M., Simpson D., Zhao K. (2009) Affinity chromatography: general methods. Methods Enzymol. 463, 417–438 [DOI] [PubMed] [Google Scholar]
- 18. Jo O. D., Martin J., Bernath A., Masri J., Lichtenstein A., Gera J. (2008) Heterogeneous nuclear ribonucleoprotein A1 regulates cyclin D1 and c-myc internal ribosome entry site function through Akt signaling. J. Biol. Chem. 283, 23274–23287 [DOI] [PMC free article] [PubMed] [Google Scholar]
- 19. Cloninger C., Bernath A., Bashir T., Holmes B., Artinian N., Ruegg T., Anderson L., Masri J., Lichtenstein A., Gera J. (2011) Inhibition of SAPK2/p38 enhances sensitivity to mTORC1 inhibition by blocking IRES-mediated translation initiation in glioblastoma. Mol. Cancer Ther. 10, 2244–2256 [DOI] [PMC free article] [PubMed] [Google Scholar]
- 20. Holmes B., Artinian N., Anderson L., Martin J., Masri J., Cloninger C., Bernath A., Bashir T., Benavides-Serrato A., Gera J. (2012) Protor-2 interacts with tristetraprolin to regulate mRNA stability during stress. Cell. Signal. 24, 309–315 [DOI] [PMC free article] [PubMed] [Google Scholar]
- 21. Hsu P. P., Kang S. A., Rameseder J., Zhang Y., Ottina K. A., Lim D., Peterson T. R., Choi Y., Gray N. S., Yaffe M. B., Marto J. A., Sabatini D. M. (2011) The mTOR-regulated phosphoproteome reveals a mechanism of mTORC1-mediated inhibition of growth factor signaling. Science 332, 1317–1322 [DOI] [PMC free article] [PubMed] [Google Scholar]
- 22. Mok J., Kim P. M., Lam H. Y., Piccirillo S., Zhou X., Jeschke G. R., Sheridan D. L., Parker S. A., Desai V., Jwa M., Cameroni E., Niu H., Good M., Remenyi A., Ma J. L., et al. (2010) Deciphering protein kinase specificity through large-scale analysis of yeast phosphorylation site motifs. Sci. Signal. 3, ra12. [DOI] [PMC free article] [PubMed] [Google Scholar]
- 23. Benavides-Serrato A., Anderson L., Holmes B., Cloninger C., Artinian N., Bashir T., Gera J. (2014) mTORC2 modulates feedback regulation of p38 MAPK activity via DUSP10/MKP5 to confer differential responses to PP242 in glioblastoma. Genes Cancer 5, 393–406 [DOI] [PMC free article] [PubMed] [Google Scholar]
- 24. Chan S. W., Lim C. J., Chong Y. F., Pobbati A. V., Huang C., Hong W. (2011) Hippo pathway-independent restriction of TAZ and YAP by angiomotin. J. Biol. Chem. 286, 7018–7026 [DOI] [PMC free article] [PubMed] [Google Scholar]
- 25. Wang W., Huang J., Chen J. (2011) Angiomotin-like proteins associate with and negatively regulate YAP1. J. Biol. Chem. 286, 4364–4370 [DOI] [PMC free article] [PubMed] [Google Scholar]
- 26. Zhao B., Wei X., Li W., Udan R. S., Yang Q., Kim J., Xie J., Ikenoue T., Yu J., Li L., Zheng P., Ye K., Chinnaiyan A., Halder G., Lai Z. C., Guan K. L. (2007) Inactivation of YAP oncoprotein by the Hippo pathway is involved in cell contact inhibition and tissue growth control. Genes Dev. 21, 2747–2761 [DOI] [PMC free article] [PubMed] [Google Scholar]
- 27. Hao Y., Chun A., Cheung K., Rashidi B., Yang X. (2008) Tumor suppressor LATS1 is a negative regulator of oncogene YAP. J. Biol. Chem. 283, 5496–5509 [DOI] [PubMed] [Google Scholar]
- 28. Liu-Chittenden Y., Huang B., Shim J. S., Chen Q., Lee S. J., Anders R. A., Liu J. O., Pan D. (2012) Genetic and pharmacological disruption of the TEAD-YAP complex suppresses the oncogenic activity of YAP. Genes Dev. 26, 1300–1305 [DOI] [PMC free article] [PubMed] [Google Scholar]
- 29. Orr B. A., Bai H., Odia Y., Jain D., Anders R. A., Eberhart C. G. (2011) Yes-associated protein 1 is widely expressed in human brain tumors and promotes glioblastoma growth. J. Neuropathol. Exp. Neurol. 70, 568–577 [DOI] [PMC free article] [PubMed] [Google Scholar]
- 30. Csibi A., Blenis J. (2012) Hippo-YAP and mTOR pathways collaborate to regulate organ size. Nat. Cell Biol. 14, 1244–1245 [DOI] [PubMed] [Google Scholar]
- 31. Paramasivam M., Sarkeshik A., Yates J. R., 3rd, Fernandes M. J., McCollum D. (2011) Angiomotin family proteins are novel activators of the LATS2 kinase tumor suppressor. Mol. Biol. Cell 22, 3725–3733 [DOI] [PMC free article] [PubMed] [Google Scholar]
- 32. Shimobayashi M., Hall M. N. (2014) Making new contacts: the mTOR network in metabolism and signalling cross-talk. Nat. Rev. Mol. Cell Biol. 15, 155–162 [DOI] [PubMed] [Google Scholar]
- 33. Tumaneng K., Schlegelmilch K., Russell R. C., Yimlamai D., Basnet H., Mahadevan N., Fitamant J., Bardeesy N., Camargo F. D., Guan K. L. (2012) YAP mediates cross-talk between the Hippo and PI(3)K-TOR pathways by suppressing PTEN via miR-29. Nat. Cell Biol. 14, 1322–1329 [DOI] [PMC free article] [PubMed] [Google Scholar]
- 34. Miller E., Yang J., DeRan M., Wu C., Su A. I., Bonamy G. M., Liu J., Peters E. C., Wu X. (2012) Identification of serum-derived sphingosine-1-phosphate as a small molecule regulator of YAP. Chem. Biol. 19, 955–962 [DOI] [PubMed] [Google Scholar]
- 35. Yu F. X., Zhao B., Panupinthu N., Jewell J. L., Lian I., Wang L. H., Zhao J., Yuan H., Tumaneng K., Li H., Fu X. D., Mills G. B., Guan K. L. (2012) Regulation of the Hippo-YAP pathway by G-protein-coupled receptor signaling. Cell 150, 780–791 [DOI] [PMC free article] [PubMed] [Google Scholar]
- 36. Liang N., Zhang C., Dill P., Panasyuk G., Pion D., Koka V., Gallazzini M., Olson E. N., Lam H., Henske E. P., Dong Z., Apte U., Pallet N., Johnson R. L., Terzi F., et al. (2014) Regulation of YAP by mTOR and autophagy reveals a therapeutic target of tuberous sclerosis complex. J. Exp. Med. 211, 2249–2263 [DOI] [PMC free article] [PubMed] [Google Scholar]
- 37. Liu Y. C., Wang Y. Z. (2015) Role of Yes-associated protein 1 in gliomas: pathologic and therapeutic aspects. Tumour Biol. 36, 2223–2227 [DOI] [PubMed] [Google Scholar]
- 38. Fernandez-L A., Squatrito M., Northcott P., Awan A., Holland E. C., Taylor M. D., Nahlé Z., Kenney A. M. (2012) Oncogenic YAP promotes radioresistance and genomic instability in medulloblastoma through IGF2-mediated Akt activation. Oncogene 31, 1923–1937 [DOI] [PMC free article] [PubMed] [Google Scholar]
- 39. Modena P., Lualdi E., Facchinetti F., Veltman J., Reid J. F., Minardi S., Janssen I., Giangaspero F., Forni M., Finocchiaro G., Genitori L., Giordano F., Riccardi R., Schoenmakers E. F., Massimino M., Sozzi G. (2006) Identification of tumor-specific molecular signatures in intracranial ependymoma and association with clinical characteristics. J. Clin. Oncol. 24, 5223–5233 [DOI] [PubMed] [Google Scholar]
- 40. Zhang N., Bai H., David K. K., Dong J., Zheng Y., Cai J., Giovannini M., Liu P., Anders R. A., Pan D. (2010) The Merlin/NF2 tumor suppressor functions through the YAP oncoprotein to regulate tissue homeostasis in mammals. Dev. Cell 19, 27–38 [DOI] [PMC free article] [PubMed] [Google Scholar]
- 41. Striedinger K., VandenBerg S. R., Baia G. S., McDermott M. W., Gutmann D. H., Lal A. (2008) The neurofibromatosis 2 tumor suppressor gene product, merlin, regulates human meningioma cell growth by signaling through YAP. Neoplasia 10, 1204–1212 [DOI] [PMC free article] [PubMed] [Google Scholar]
- 42. Lau Y. K., Murray L. B., Houshmandi S. S., Xu Y., Gutmann D. H., Yu Q. (2008) Merlin is a potent inhibitor of glioma growth. Cancer Res. 68, 5733–5742 [DOI] [PMC free article] [PubMed] [Google Scholar]
- 43. Cloughesy T. F., Cavenee W. K., Mischel P. S. (2014) Glioblastoma: from molecular pathology to targeted treatment. Annu. Rev. Pathol. 9, 1–25 [DOI] [PubMed] [Google Scholar]
- 44. Masui K., Cloughesy T. F., Mischel P. S. (2012) Review: molecular pathology in adult high-grade gliomas: from molecular diagnostics to target therapies. Neuropathol. Appl. Neurobiol. 38, 271–291 [DOI] [PMC free article] [PubMed] [Google Scholar]
- 45. Grzmil M., Hemmings B. A. (2013) Overcoming resistance to rapalogs in gliomas by combinatory therapies. Biochim. Biophys. Acta 1834, 1371–1380 [DOI] [PubMed] [Google Scholar]
- 46. Wu S. H., Bi J. F., Cloughesy T., Cavenee W. K., Mischel P. S. (2014) Emerging function of mTORC2 as a core regulator in glioblastoma: metabolic reprogramming and drug resistance. Cancer Biol. Med. 11, 255–263 [DOI] [PMC free article] [PubMed] [Google Scholar]


