

Abstract
The serine/threonine kinase mammalian target of rapamycin (mTOR) governs growth, metabolism, and aging in response to insulin and amino acids (aa), and is often activated in metabolic disorders and cancer. Much is known about the regulatory signaling network that encompasses mTOR, but surprisingly few direct mTOR substrates have been established to date. To tackle this gap in our knowledge, we took advantage of a combined quantitative phosphoproteomic and interactomic strategy. We analyzed the insulin- and aa-responsive phosphoproteome upon inhibition of the mTOR complex 1 (mTORC1) component raptor, and investigated in parallel the interactome of endogenous mTOR. By overlaying these two datasets, we identified acinus L as a potential novel mTORC1 target. We confirmed acinus L as a direct mTORC1 substrate by co-immunoprecipitation and MS-enhanced kinase assays. Our study delineates a triple proteomics strategy of combined phosphoproteomics, interactomics, and MS-enhanced kinase assays for the de novo-identification of mTOR network components, and provides a rich source of potential novel mTOR interactors and targets for future investigation.
The serine/threonine kinase mammalian target of rapamycin (mTOR)1 is conserved in all eukaryotes from yeast to mammals (1). mTOR is a central controller of cellular growth, whole body metabolism, and aging, and is frequently deregulated in metabolic diseases and cancer (2). Consequently, mTOR as well as its upstream and downstream cues are prime candidates for targeted drug development to alleviate the causes and symptoms of age-related diseases (3, 4). The identification of novel mTOR regulators and effectors thus remains a major goal in biomedical research. A vast body of literature describes a complex signaling network around mTOR. However, our current comparatively detailed knowledge of mTOR's upstream cues contrasts with a rather limited set of known direct mTOR substrates.
mTOR exists in two structurally and functionally distinct multiprotein complexes, termed mTORC1 and mTORC2. Both complexes contain mTOR kinase as well as the proteins mLST8 (mammalian lethal with SEC thirteen 8) (5–7), and deptor (DEP domain-containing mTOR-interacting protein) (8). mTORC1 contains the specific scaffold protein raptor (regulatory-associated protein of mTOR) (9, 10), whereas mTORC2 contains the specific binding partners rictor (rapamycin-insensitive companion of mTOR) (5–7), mSIN1 (TORC2 subunit MAPKAP1) (11–13), and PRR5/L (proline rich protein 5/-like) (14–16). The small macrolide rapamycin acutely inhibits mTORC1, but can also have long-term effects on mTORC2 (17, 18). More recently, ATP-analogs (19) that block both mTOR complexes, such as Torin 1 (20), have been developed. As rapamycin has already been available for several decades, our knowledge of signaling events associated with mTORC1 as well as its metabolic inputs and outputs is much broader as compared with mTORC2. mTORC1 responds to growth factors (insulin), nutrients (amino acids, aa) and energy (ATP). In response, mTORC1 activates anabolic processes (protein, lipid, nucleotide synthesis) and blocks catabolic processes (autophagy) to ultimately allow cellular growth (21). The insulin signal is transduced to mTORC1 via the insulin receptor (IR), and the insulin receptor substrate (IRS), which associates with class I phosphoinositide 3-kinases (PI3Ks). Subsequent phosphatidylinositol 3,4,5 trisphosphate (PIP3) binding leads to relocalization of the AGC kinases phosphoinositide-dependent protein kinase 1 (PDK1) and Akt (also termed protein kinase B, PKB) to the plasma membrane, where PDK1 phosphorylates Akt at T308 (22, 23). In response, Akt phosphorylates and inhibits the heterocomplex formed by the tuberous sclerosis complex proteins 1 and 2 (TSC1-TSC2) (24, 25). TSC1-TSC2 is the inhibitory, GTPase-activating protein for the mTORC1-inducing GTPase Ras homolog enriched in brain (rheb) (26–30), which activates mTORC1 at the lysosome. mTORC1 localization depends on the presence of aa, which in a rag GTPase-dependent manner induce mTORC1 relocalization to lysosomes (31, 32). Low energy levels are sensed by the AMP-dependent kinase (AMPK), which in turn phosphorylates the TSC1-TSC2 complex (33) and raptor (34), thereby inhibiting mTORC1.
mTORC1 phosphorylates its well-described downstream substrate S6-kinase (S6K) at T389, the proline-rich Akt substrate of 40 kDa (PRAS40) at S183, and the translational repressor 4E-binding protein (4E-BP) at T37/46 (35–41). Unphosphorylated 4E-BP binds and inhibits the translation initiation factor 4G (eIF4G), which within the eIF4F complex mediates the scanning process of the ribosome to reach the start codon. Phosphorylation by mTORC1 inhibits 4E-BP's interaction with eIF4E, thus allowing for assembly of eIF4F, and translation initiation (42, 43). More recently, also the IR-activating growth factor receptor-bound protein 10 (Grb10) (44, 45), the autophagy-initiating Unc-51-like kinase ULK1 (46), and the trifunctional enzymatic complex CAD composed of carbamoyl-phosphate synthetase 2, aspartate transcarbamoylase, and dihydroorotase (47, 48), which is required for nucleotide synthesis, have been described as direct mTORC1 substrates.
mTORC2 activation is mostly described to be mediated by insulin, and this is mediated by a PI3K variant that is distinct from the PI3K upstream of mTORC1 (49, 50). Furthermore, mTORC2 responds to aa (5, 51). In response, mTORC2 phosphorylates the AGC kinases Akt at S473 (52–55), and serum and glucocorticoid kinase SGK (56) and protein kinase C alpha (PKCalpha) (7) within their hydrophobic motifs (57, 58), to control cellular motility (5–7), hepatic glycolysis, and lipogenesis (59). In addition, mTOR autophosphorylation at S2481 has been established as an mTORC2 readout in several cell lines including HeLa cells (49).
Given the multiplicity of effects via which mTOR controls cellular and organismal growth and metabolism, it is surprising that only relatively few direct mTOR substrates have been established to date. Proteomic studies are widely used to identify novel interactors and substrates of protein kinases. Two studies have recently shed light on the interaction of rapamycin and ATP-analog mTOR inhibitors with TSC2 inhibition in mammalian cells (44, 45), and one study has analyzed the effects of raptor and rictor knockouts in non-stimulated cells (48).
In this work, we report a functional proteomics approach to study mTORC1 substrates. We used an inducible raptor knockdown to inhibit mTORC1 in HeLa cells, and analyzed the effect in combination with insulin and aa induction by quantitative phosphoproteomics using stable isotope labeling by amino acids in cell culture (SILAC) (60). In parallel, we purified endogenous mTOR complexes and studied the interactome of mTOR by SILAC-MS. Through comparative data evaluation, we identified acinus L as a potential novel aa/insulin-sensitive mTOR substrate. We further validated acinus L by co-immunoprecipitation and MS-enhanced kinase assays as a new direct mTORC1 substrate.
EXPERIMENTAL PROCEDURES
Cell Culture and Cell Lines
Phosphoproteome and interactome experiments were performed in stably transduced inducible shRaptor HeLa alpha-Kyoto cells (49). The other experiments were performed in wild type HeLa alpha-Kyoto cells. All cells were cultivated in DMEM (PAA, Pasching, Austria) supplemented with 10% FCS (PAA), and 1.5% l-glutamine (PAA). Insulin/aa induction was performed as described (61). Knockdown of raptor was induced with 2 μg ml−1 of doxycycline (Calbiochem, Merck, Darmstadt, Germany) for 2 or 3 days.
SILAC Labeling
shRaptor HeLa cells were labeled for at least 11 days in SILAC DMEM (PAA) supplemented with 10% dialyzed FCS (PAA), 1.5% l-glutamine (PAA) and either with “heavy” lysine (146 mg/L; 13C6, 15N2) and arginine (84 mg/L; 13C6, 15N4), “medium” lysine (146 mg/L; 4,4,5,5−D4) and arginine (84 mg/L; 13C6), or “light” lysine (146 mg/L) and arginine (84 mg/L). All amino acids were from Cambridge Isotope Laboratories, Andover, MA. A minimal arginine-to-proline conversion (≤ 3%) and virtually full incorporation of SILAC amino acids into proteins (> 98.9%) were confirmed by LC/MS analysis (data not shown).
Antibodies
Antibodies for the analysis of mTOR signaling are described elsewhere (49, 61). Acinus isoform L and its N-terminal construct (acinus NT-myc-FLAG) were detected with AM26695AF-N of Acris antibodies GmbH, Herford, Germany. FLAG was detected in immunoblots with anti-FLAG rabbit antibody (Cell Signaling Technology, Danvers, MA). All antibodies were used according to the manufacturers' instructions. Monoclonal antibodies for mTOR (rat clone 3G6), raptor (rat clone 20D12) and control IgG (rat clone 7H8) for immunopurifications (IPs) and immunoblots were generated in rats by Dr. Elisabeth Kremmer, Helmholtz Zentrum, Munich, Germany as described (62).
Cloning, Constructs, and Transfection
pCAGGS and pCAGGS-acinus L were a kind gift from Prof. Tjuysoma, Osaka University, Suita, Japan and Prof. Aoto, Ehime University, Toon-city, Japan, respectively, and have been described (63).
pGEX-4T-1 Acinus NT-myc-FLAG, pCMV6-Acinus NT-myc-FLAG
To create an N-terminal version of acinus L (corresponding to aa 1–523), pCAGGS-acinus L was used as a template. Acinus L NT 1–523 was amplified by using the following PCR primers: 5′-AATTGGATCCATGTGGAGACGGAA-3′ and 5′-TATTTACGCGTGTCTGACTCAGGTTC-3′. The PCR product was then cloned into pCMV6-entry using BamH1 and Mlu1. To clone acinus L NT 1–523 into pGEX-4T-1, acinus NT 1–523 was cut out with BamH1 and Not1 from pCMV6-entry and inserted into pGEX-4T-1. The DNA sequence of the first 523 amino acids of acinus L with myc and FLAG-tag at the C terminus can be found in the supplemental text.
Transfection of pCAGGS, pCAGGS-acinus L, pCMV6-entry, and pCMV6-acinus NT-myc-FLAG into HeLa cells was performed with 15 μg of each construct per 15 cm dish, using JetPEI reagent (PolyPlus, Strasbourg, France) according to the manufacturer's instructions. Cells were harvested 48h after transfection.
Purification of GST-Acinus NT-myc-FLAG Protein
For the purification of acinus L N-terminal, pGEX-4T-1 GST-acinus NT-myc-FLAG was introduced into Rosetta competent cells ((Rosetta F-ompT hsdSB (rB-mB) gal dcm pRARE23 (CamR), Novagen, Merck)). The protein expression was induced by the addition of 1 mm IPTG (PEQLAB, Erlangen, Germany) overnight at 37 °C. The bacteria were harvested and lysed in 1× PBS (PAA) with Complete protease inhibitor (Roche, Mannheim, Germany) and benzonase (Merck Millipore) with a homogenizer (Precellys 24, PEQLAB). The bacteria suspension was subjected to 3 × 15 s pulses in tubes with glass beads (VK01/VK05, PEQLAB). In between each pulse, the bacteria suspension was placed on ice for 1 min. Insoluble matter was removed by centrifugation at 1700 rpm for 1 h at 4 °C. The supernatant was incubated with 4 ml of Glutathione Sepharose™ 4B (GE Healthcare, Freiburg, Germany) for 1 h at 4 °C and for an additional 30 min at room temperature (RT). The Sepharose was washed with 1× PBS until the OD (280 nm) of the wash was below 0.05. GST-acinus NT-myc-FLAG was eluted 2×, each time with 20 mm glutathione (Sigma Aldrich, St. Louis, MO) in 100 mm Tris-HCl pH 8 for 30 min at RT. The eluates were combined and concentrated to about 2 mg/ml with a 5 kDa cut-off Vivaspin concentrator (Sartorius Stedim Biotech, Göttingen, Germany).
Phosphoproteomics Sample Preparation
shRaptor HeLa cells were washed 3× with cold 1× PBS and lysed in sodium deoxycholate lysis buffer (1% SDC (Sigma Aldrich), 50 mm ammonium bicarbonate (Sigma Aldrich), PhosSTOP (Roche)). Protein concentrations were measured using the Protein Assay Dye Reagent Concentrate (Bio-Rad, Hercules, CA) according to the manufacturer's protocol and adjusted with lysis buffer. For immunoblotting, an aliquot of each lysate was diluted in sample buffer (5× buffer: 6 ml glycerol, 0.6 ml beta-mercaptoethanol, 1 g SDS, 3.75 ml 1 m Tris-HCl, pH 6.8, 2 mg of bromphenol blue and 2 ml H2O). Immunoblotting was performed as described (61). For MS analyses, equal amounts of protein from each labeling state were pooled (total protein amount of 1–1.3 mg) and digested with sequencing grade trypsin (1:50, Promega, Mannheim, Germany) for 6 h at 37 °C. The digestion was stopped by adding trifluoroacetic acid (TFA, LGC Standards, Wesel, Germany) to a final concentration of 1%. Precipitating SDC was removed by centrifugation (max speed, tabletop centrifuge). The samples were desalted using an Oasis® HLB Plus LP extraction cartridge (Waters, Milford, MA). The cartridge was conditioned with 2 × 2 ml elution buffer (5% formic acid, 90% acetonitrile (ACN)) followed by 2 × 2 ml wash buffer (0.1% TFA). The sample was then applied to the cartridge and the flow through was loaded again. The cartridge was washed with 3 ml wash buffer and 2 ml H2O followed by elution with 2 ml elution buffer. Eluates were lyophilized and stored at −80 °C.
Immunoprecipitation
IPs were performed essentially as described (49). Cells of 70–90% confluence were lysed in 40 mm HEPES, 120 mm NaCl, 0.3% CHAPS, pH 7.5, supplemented with phosphatase inhibitor mixture 2 + 3 (Sigma Aldrich) and Complete protease inhibitor (Roche). Per IP approach, lysates corresponding to one-half of a 15 cm plate were used. For IPs subjected to immunoblot or in vitro kinase assays, lysates were precleared with 10 μl Dynal Protein G magnetic beads (Invitrogen, Life Technologies, Darmstadt, Germany) per 1 ml lysate for 30 min at 4 °C. For each IP, 37 μl Dynal Protein G magnetic beads with 7.5 μg antibody (anti mTOR clone 3G6, anti-rat clone 7H8, anti-raptor clone 20D12 (all Dr. Elisabeth Kremmer), and anti-FLAG M2 (Sigma-Aldrich)) were used. Magnetic beads were 3× shortly washed and 2× for 10 min with lysis buffer. Proteins were eluted by incubation at 95 °C in 2× (for MS analysis) or 1× (for immunoblot analysis) sample buffer.
In Vitro Kinase Assay
For mTOR in vitro kinase assays, co-IPs with anti-raptor antibody clone 20D12 were performed. The mock IP was carried out using anti-rat IgG clone 7H8 (kind gift of Dr. Elisabeth Kremmer). The lysis buffer (40 mm HEPES, 120 mm NaCl, 0.3% CHAPS, pH 7.5) was supplemented with 500 nm benzamidine (Sigma-Aldrich) and 20 μg/ml heparin (Sigma-Aldrich). Following raptor or rat IPs, 26 μl of the kinase reaction mix (MnCl2 4 mm, DTT 10 mm and protease inhibitors without EDTA (Roche), heparin (2 μg/ml, Sigma Aldrich)) in lysis buffer and 1 μg 4E-BP (ProSpec, East Brunswick, NJ) or 12 μg of purified acinus L N-terminal construct) were added to each eluate. The reaction mix was incubated with 250 nm or 500 nm Torin 1 (Tocris Bioscience, Bristol, UK) for 30 min at 30 °C with slight agitation. For the conditions without Torin 1, DMSO (Sigma-Aldrich) was added. The reaction was started by adding 4 μl 1 mm ATP in lysis buffer under shaking at 1,400 rpm and stopped after 60 min at 30 °C with 1× sample buffer.
Coomassie Staining and In-gel Digestion
The samples of the kinase assay were loaded onto 4–20% Tris-Glycine gels (Thermo Scientific, Rockford, IL). Samples from mTOR IPs were loaded onto NuPAGE® Novex® 4–12% Bis-Tris gels (Invitrogen, Life Technologies). After SDS-PAGE, proteins were stained with SimplyBlue™ SafeStain (Invitrogen, Life Technologies) according to the manufacturers' manual or by colloidal Coomassie Brilliant Blue G-250. For in-gel digestion, the bands were cut out and destained with 50% buffer A (10 mm ammonium bicarbonate in water) with 50% buffer B (100% ACN). Proteins were reduced with 10 mm DTT in buffer A at 65 °C for 30 min, alkylated with 55 mm iodacetamide in buffer A at RT for 30 min in the dark, and digested with trypsin (Promega) in buffer A at 37 °C overnight or at 42 °C for 4 h. The peptides were eluted twice in 50% Buffer C (0.1% TFA in water) with 50% buffer B for 10 min in an ultrasonic bath. The eluates were dried in vacuo and resuspended in 15 μl buffer C for LC/MS measurement.
Strong Cation Exchange Chromatography
Tryptic peptides were dissolved in SCX buffer A (5 mm potassium dihydrogen phosphate, 20% ACN (v/v), pH 2.8) and loaded onto a Polysulfoethyl-A column (inner diameter 4.6 mm, 20 cm, 5 μm, 200 Å, Dionex LC Packings/Thermo Fisher Scientific, Dreieich, Germany) using a Dionex Ultimate 3000 UHPLC system. Peptides were isocratically separated for 10 min with 0% B followed by a three-step gradient of 0–30% SCX buffer B (5 mm potassium dihydrogen phosphate, 20% ACN (v/v), 500 mm KCl, pH 2.8) in 50 min, 30–50% buffer B in 10 min and 50–100% buffer B in 10 min. The column was washed with 100% buffer B for 5 min and re-equilibrated for 20 min with 100% buffer A. Twenty-eight fractions at 2.1 ml were collected throughout the gradient. Twenty microliters of each fraction were directly used for LC/MS analysis, whereas the remaining digest was subjected to titanium dioxide (TiO2) enrichment.
Titanium Dioxide Enrichment
TiO2 enrichment of phosphopeptides was essentially performed as described (64). Briefly, 10 μl of a 25% slurry of TiO2 (MZ-Analysentechnik, Mainz, Germany) in 30 mg/ml 2,5-dihydroxybenzoic acid (Sigma Aldrich, St. Louis, MO) were added to each SCX fraction and incubated for at least 30 min at 4 °C. SCX fractions 1–28 were incubated 2×, whereas fractions 1–10 were incubated 3× with TiO2 beads. Following elution with 50 μl 25% ammonium hydroxide in 20% ACN and 50 μl 25% ammonium hydroxide in 40% ACN, phosphopeptide samples were reduced to less than 5 μl and resuspended in 15 μl of 0.1% TFA for LC/MS analysis.
High-performance Liquid Chromatography and Mass Spectrometry
Reversed-phase capillary HPLC separations were performed using the UltiMateTM 3000 RSLCnano system (Dionex LC Packings/Thermo Fisher Scientific, Dreieich, Germany). Chromatography was essentially performed as described previously (65) with slight modifications. For phosphoproteomics analysis, the HPLC system was coupled to an LTQ-FT system (Thermo Fisher Scientific, Bremen, Germany). Peptides were separated using an Acclaim® PepMapTM analytical column (ID: 75 μm × 250 mm, 2 μm, 100 Å, Dionex LC Packings/Thermo Fisher Scientific) and a flow rate of 300 nL/min. Samples were washed on a PepMapTM C18 μ-precolumn (ID: 0.3 mm × 5 mm; Dionex LC Packings/Thermo Fisher Scientific) with 0.1% TFA for 30 min, which was subsequently switched in line with the analytical column equilibrated in 95% solvent A (0.1% formic acid (FA)) and 5% solvent B (0.1% FA, 86% ACN) for 20 min. Samples were then separated by a gradient from 5% to 40% solvent B in 60 min, followed by a gradient from 40% to 95% solvent B in 7 min. The column was washed for 3 min with 95% solvent B before re-equilibration. The LTQ-FT instrument was operated using a nano-flex ion source with stainless steel emitters (Thermo Fisher Scientific, Bremen, Germany) and externally calibrated using standard compounds. The general mass spectrometric parameters were as follows: spray voltage, 1.8 kV; capillary voltage, 36 V; capillary temperature, 200 °C; tube lens voltage, 145 V. For data-dependent MS/MS analyses, the software XCalibur 2.0.7.0702 (Thermo Fisher Scientific) was used. MS spectra ranging from m/z 370 to 1,700 were acquired in the ICR cell at a resolution of 25,000 (at m/z 400). Automatic gain control (AGC) was set to 2 × 10⁶ ions and a maximum fill time of 1,000 ms. Multiply charged peptide ions were selected for fragmentation in the linear ion trap using a TOP5 method. The AGC of the LTQ was set to 30,000 ions with a maximum fill time of 500 ms. For MS/MS, a normalized collision energy of 35% with an activation q of 0.25 and an activation time of 30 ms was used. Multistage activation (MSA) was enabled using neutral loss masses of 9, 18, 98, 49, and 32.7 Da and the dynamic exclusion window was set to 65 s.
mTOR interactome data were acquired on an LTQ Orbitrap XL system (Thermo Fisher Scientific) equipped with a nanoelectrospray ion source and distal coated SilicaTips (FS360–20-10-D, New Objective, Woburn, MA). Chromatographic separations were performed as described above with slight modifications as follows. Peptides were washed on a C18 μ-precolumn with 0.1% TFA for 5 min and separated on an Acclaim® PepMapTM analytical column (75 μm × 500 mm, 2 μm, 100 Å, Dionex LC Packings/Thermo Fisher Scientific) at a flow rate of 250 nL/min with a binary solvent gradient system consisting of solvent A (0.1% FA) and solvent B (30% ACN, 50% methanol (MeOH), 0.1% FA). For separation, the percentage of B was raised from 15% to 72% in 45 min followed by an increase from 72% to 100% B in 10 min. The column was washed with 100% B for 5 min and re-equilibrated with 15% B for 15 min. Peptides were directly transferred into the ion source. The instrument was operated as described above for the LTQ-FT with slight modifications as follows: spray voltage, 1.5 kV; capillary voltage, 44 V; tube lens voltage, 110 V. The software XCalibur 2.1.0 SP1.116 (Thermo Fisher Scientific, Bremen, Germany) was used. Full scans (m/z 370 to 1,700) were acquired in the orbitrap at a resolution of 60,000 (at m/z 400). AGC was set to 5 × 10⁵ ions (max. fill time, 500 ms) in the orbitrap and to 30,000 ions (max. fill time, 100 ms) in the LTQ. A TOP5 method was applied for collision-induced dissociation of multiply charged peptide ions with parameters as described above.
Samples from mTOR in vitro kinase assays were measured on the RSLCnano/LTQ-FT for the first replicate and the RSLCnano/LTQ-Orbitrap XL for the second replicate. Measurements were performed essentially as described above. In brief, peptides were washed on a C18 μ-precolumn with 0.1% TFA for 5 min and separated on an Acclaim® PepMapTM analytical column (ID: 75 μm × 500 mm, 2 μm, 100 Å, Dionex LC Packings/Thermo Fisher Scientific) at a flow rate of 250 nL/min. The analytical column was equilibrated in 99% solvent A (4% dimethyl sulfoxide (DMSO), 0.1% FA) and 1% solvent B (4% DMSO, 0.1% FA, 30% ACN, 50% MeOH) or 95% A and 5% B. Samples were separated by a gradient of 1% (or 5% B) to 30% solvent B in 85 min (or 75 min), followed by a gradient from 30% to 45% solvent B in 30 min (or 40 min), 45% to 70% solvent B in 35 min and 70% to 99% solvent B in 5 min. Before re-equilibration for 15 min, the column was washed for 5 min with 99% solvent B. Both instruments were operated as described above. MSA was enabled on the LTQ-FT (see above, dynamic exclusion 45 s) and on the LTQ-Orbitrap XL using neutral loss masses of 98, 49, and 32.7 Da and a dynamic exclusion window of 45 s.
Bioinformatics
For protein identification, peak lists were generated and searched against the Uniprot Human Proteome set (release 03.04.2013, 87,656 protein entries) and the contamination file supplied with MaxQuant using Andromeda/MaxQuant 1.3.0.5 (66, 67). The species was restricted to homo sapiens because only proteins from human cells were analyzed. MaxQuant was operated using default settings with slight modifications. Database searches were performed with trypsin as proteolytic enzyme allowing up to two (IP), three (in vitro kinase assay) or four missed cleavages (phosphoproteome). Oxidation of methionine as well as phosphorylation of serine, threonine and tyrosine residues was commonly set as variable modification and carbamidomethlyation was set as fixed modification for in vitro kinase assays and interactome analyses. Raw data were recalibrated using the “first search” option of Andromeda with the full database using a precursor mass tolerance of 20 ppm and a fragment mass tolerance of 0.5 Da. Mass spectra were searched with Andromeda using default settings. The mass tolerance for precursor and fragment ions was 5 ppm and 0.5 Da, respectively. For automated quantification of protein groups, only “razor and unique” peptides and a minimum ratio count of two were considered. In addition, “requantify,” “filter labeled amino acids,” and “match between runs” with a 2 min time window were enabled. Low-scoring peptides were excluded. A false discovery rate of 1% was applied on both peptide-spectrum-matches (on modified peptides separately) and protein lists. Protein ratios calculated by MaxQuant represent the median of all peptide ratios of a distinct protein or protein group. The reported ratio variability (in %) is the standard deviation of the ln-transformed peptide ratios used to determine the protein ratio multiplied by 100 (66). For quantification of MS data from in vitro kinase assays, the label-free protein quantification option in MaxQuant was enabled using default settings. Only peptides with at least one unique peptide (phosphoproteome and interactome data) or at least two unique peptides (in vitro kinase assay) with a minimum length of seven aa are reported in this work. If proteins were not distinguishable based on the set of peptides identified, they were combined by MaxQuant and listed as protein group. Further information about protein and peptide identifications provided by MaxQuant are given in supplemental Tables S1A–S1C; S4A–S4C; S6B–S6G.
All raw data, including annotated (phospho-) peptide spectra, and original MaxQuant result files have been deposited to the ProteomeXchange Consortium (http://proteomecentral.proteomexchange.org) via the PRIDE partner repository (68) with the dataset identifiers PXD001196 (phosphoproteome), PXD001244 (interactome) and PXD001245 (in vitro kinase assay).
The number of proteins was counted based on the MaxQuant ID in the protein groups table. Unique phosphopeptides were counted based on the MaxQuant peptide ID in the Phospho(STY)sites table. Phosphorylation sites scored with a MaxQuant localization probability of ≥ 0.75 were considered “localized sites.” Sites with a localization probability of < 0.75 were counted as additional putative sites given that the aa sequence in combination with the number of phosphate moieties was not listed with localized sites elsewhere in the dataset. Sites with ambiguous localization (< 0.75) are listed separately (supplemental Table S2B). Normalized ratios provided by MaxQuant were used and only phosphopeptides quantified in at least three out of four replicates were considered for further analysis. For further analysis of interactome data, non-normalized ratios were used and only protein groups identified with at least two peptides and quantified in at least two out of three replicates were considered. Ratios were log-transformed (log10) and the mean log10 across all experiments as well as the respective p values (interactome, one-sided t test; phosphoproteome, two-sided t test) were calculated. Phosphopeptides were considered regulated with a regulation factor of at least 1.5 and a p value below 0.05 for the insulin- and aa-dependent phosphoproteome. For raptor-dependent changes of protein phosphorylation levels, a minimum fold change of 1.3 or 1.5 with a p value < 0.05 was applied to define two sets of candidates. Potential interaction partners of mTOR were required to be identified with at least two peptides and quantified with a mean ratio ≥ 5 or higher and a p value < 0.01.
The quantification and normalization of immunoblots were performed as described in (49). The signal of acinus L for “starvation” was set to one and the relative intensity of the other signals was calculated. For statistical analysis, a two-tailed paired t test was performed using GraphPad prism 4 (GraphPad Software, Inc. La Jolla, CA).
Raw files of the in vitro kinase assay were analyzed with an in-house build software for peptide quantification based on extracted ion chromatograms (XIC). The XIC of the S240 or S243 monophosphorylated peptide LSEGSQPAEEEEDQETPSR observed at m/z 1099.44 in the MS spectrum was extracted and the area under the curve applying a 5% intensity threshold (AUC FW5PM, area under the curve at full width at 5% peak height) was calculated. The respective retention time of the phosphopeptide of interest was retrieved from the evidence.txt file of the MaxQuant 1.3.0.5 search for each replicate and a retention time window of 7 min (LTQ-FT) or 4 min (LTQ-Orbitrap XL) was used for XIC calculation. The values for the AUC FW5PM were normalized to the reported LFQ intensities of acinus L total levels in the proteingroups.txt file. The highest normalized AUC FW5PM value was set to 100% relative intensity for each replicate (corresponding to raptor IP with GST-acinus NT-myc-FLAG).
GO term enrichment of the interactome data was performed with the Cytoscape 3.1.1 (69) plugin ClueGO (version 2.1.3) (70). The proteins significantly enriched in the mTOR versus mock IP were analyzed against all identified proteins in the data set (reference data set). The significance level was set to p < 0.05 as determined by hypergeometric test and Benjamini and Hochberg correction.
RESULTS
Analysis of the Amino Acid- and Insulin-Dependent mTORC1 Phosphoproteome
To identify mTORC1-dependent phosphorylation events, stably transduced shRaptor HeLa cells were SILAC-labeled, and raptor knockdown was induced (Fig. 1A). Control cells and cells with raptor knockdown were starved for serum and aa for 16 h. Afterwards, control and shRaptor knockdown cells were stimulated for 30 min with aa and insulin. In addition, another batch of control cells remained starved. The experiment was performed in four independent biological replicates, including a SILAC label switch. Upon cell lysis and determination of protein content, aliquots of each sample were analyzed by immunoblotting (Fig. 1B). Insulin+aa stimulation expectedly induced the mTORC2 readouts Akt-pS473 and mTOR-pS2481, as well as the mTORC1 readout S6K-pT389. Upon shRaptor knockdown, raptor protein levels were strongly reduced, and concomitantly also the phosphorylation of S6K-T389 was inhibited, whereas the mTORC2 readouts remained unaffected. For global phosphoproteomics analysis, the three SILAC-encoded and differently treated samples were pooled in equal protein amounts and, after quality control as shown in Fig. 1B, digested with trypsin and fractionated by SCX (Fig. 1A). An aliquot of each SCX fraction was directly measured by LC/MS. Phosphopeptides were enriched from SCX fractions by TiO2 chromatography and subsequently analyzed by LC/MS (Fig. 1A). By this approach, 4063 proteins were identified in the four replicates, of which 2708 were quantified by MaxQuant (Fig. 2A, supplemental Table S1A). Of all identified proteins, 1677 were phosphoproteins (756 quantified), corresponding to 3542 unique phosphopeptides (3349 quantified), and 4099 phosphosites (supplemental Table S2A). The majority of all sites (52%) could be localized with very high confidence (probability > 0.999) and further 38% were scored with probabilities of more than 0.75. Only 9% (372) of all identified sites could not be localized within the identified aa sequence (probability < 0.75) (Fig. 2B). Among the 3727 localized phosphorylation sites were 212, as yet, unknown sites (supplemental Table S3).
Fig. 1.
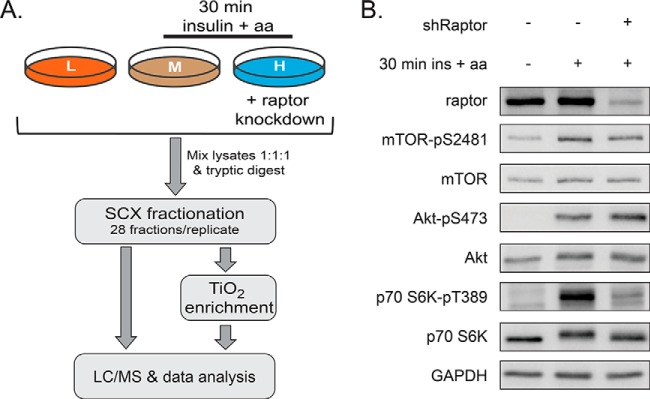
Experimental setup to study the mTORC1- and insulin/amino acid-dependent phosphoproteome. A, Inducible shRaptor HeLa cells were differentially labeled by SILAC. Raptor knockdown was induced with doxycycline, as indicated. All cells were starved for serum and amino acids (aa) for 16 h. Cells were stimulated for 30 min with aa and insulin, as indicated. Lysates were mixed equally and tryptic digests were subjected to SCX fractionation. Twenty-eight fractions per biological replicate were collected and a small aliquot of each fraction was analyzed by LC/MS. The remaining samples were subjected to titanium dioxide (TiO2)-based enrichment of phosphopeptides and analyzed by LC/MS. Data of four biological replicates were quantitatively analyzed using MaxQuant. B, Immunoblot analysis was performed for all samples subjected to MS analysis. To control for insulin+aa stimulation, the mTORC2 readouts Akt-pS473 and mTOR-pS2481, as well as the mTORC1 readout S6K-pT389 were detected. shRaptor induction was confirmed by raptor detection.
Fig. 2.
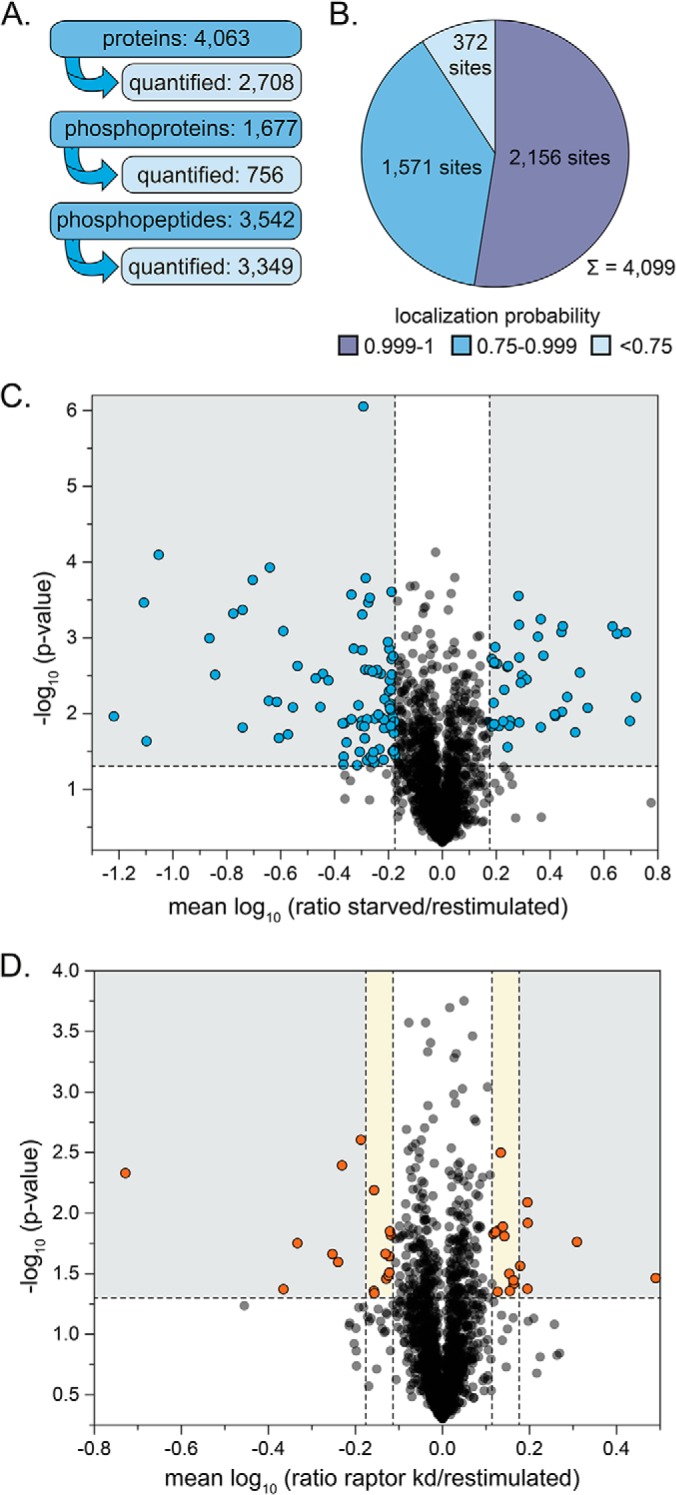
The phosphoproteome after insulin and amino acid stimulation with and without raptor knockdown. A, Numbers of identified and quantified (phospho-)proteins and (phospho-)peptides obtained by SILAC-MS analyses of four independent biological replicates. The number of phosphopeptides was calculated based on the number of MaxQuant peptide IDs in the Phospho(STY)sites table. B, Localization probabilities calculated for all 4,099 phosphorylation sites reported by MaxQuant. Only sites with a localization probability of ≥ 0.75 were considered localized. C, D, Mean log10 ratios of phosphopeptides in starved versus restimulated samples and in restimulated cells with and without raptor knockdown plotted against negative log10 p values (Student's t test). Phosphopeptides were considered regulated with a regulation factor of at least 1.5 and a p value below 0.05 for the insulin- and aa-dependent phosphoproteome (gray sector). For raptor-dependent changes of protein phosphorylation levels, a minimum fold change of 1.3 (yellow and gray sector) or 1.5 (gray sector) with a p value < 0.05 was applied to define two sets of candidates.
To identify significantly regulated phosphopeptides, scatter plots were generated by plotting the mean log10 SILAC ratios of phosphopeptides quantified in at least three out of four biological replicates of (1) starved versus insulin+aa stimulated cells and (2) insulin+aa stimulated cells with and without raptor knockdown against the respective negative log10 p values. With this approach, 128 phosphopeptides, corresponding to 101 phosphoproteins, were considered regulated on insulin+aa stimulation with a fold-change ≥ 1.5 and a p value < 0.05 (Fig. 2C, supplemental Table S2A). Applying a minimum fold-change of 1.5 or 1.3, a set of 14 respectively 34 phosphopeptides were found significantly regulated in raptor-deficient cells, 13 of which responded to stimulation with insulin+aa (Fig. 2D, supplemental Table S2A). Based on this analysis, we identified 31 phosphoproteins regulated by raptor knockdown and, thus, in an mTORC1-dependent manner (marked green in supplemental Table S2A).
Analysis of the mTOR Interactome
Next, we reasoned that direct substrates of mTORC1 may not only be phosphorylated in an insulin/aa- and raptor-dependent manner, but also interact with mTOR. We therefore studied the interactome of mTOR with the aim to identify those candidates that overlap with the insulin+aa- and mTORC1-specific phosphoproteome. To this end, we labeled HeLa cells by SILAC and performed mTOR and mock IPs (Fig. 3A). Three independent biological replicates were performed, with a label switch in each. Aliquots of both the IP and lysate samples were analyzed by immunoblotting (Fig. 3B). As expected, the immunoprecipitated protein mTOR and its interacting proteins raptor, PRAS40 (mTORC1) and rictor (mTORC2) were detected in the lysates and the mTOR IP, but not in the mock IP, used as a negative control. To further delineate the mTOR interactome, eluates from mTOR and mock IPs were mixed in equal volumes, proteins were separated by SDS-PAGE, and analyzed by LC/MS combined with MaxQuant (Fig. 3A). The mean log10 SILAC ratios of proteins identified in mTOR versus mock IPs and quantified in at least two out of three biological replicates were plotted against the negative log10 p values (Fig. 3C). Proteins with a mean regulation ratio > 5 and a p value < 0.01 were considered significantly enriched (Fig. 3C, gray sector). The mTOR interactome established in this work displays known components common to both mTOR complexes (mTOR, MTOR; mLST8, MLST8), as well as components specific to mTORC1 (raptor, RPTOR) or mTORC2 (rictor, RICTOR; mSIN1, MAPKAP1) (Fig. 3C, orange dots), highlighting the specificity and sensitivity of our approach. In total, 248 proteins were found enriched with mTOR (supplemental Table S4A). The overlay of the mTOR interactome with the raptor and/or insulin/aa-dependent phosphoproteome yielded 14 proteins that were present in both datasets (Fig. 3D, supplemental Table S5), of which ACIN1 and EIF4G1 were at the intersection of all three datasets. Interaction analysis using the STRING 9.1 database (71) showed that eight of these proteins have already been described as mTOR interactors (yet not all of them as mTOR-dependent phosphorylation targets, see discussion), whereas for six proteins (SPTBN1, BCLAF1, ACIN1, SLK, AHNAK and PLEC) no interaction with mTOR is known according to information provided by the STRING database (date of September 2014). Thus, the latter proteins represent new potential interaction partners of mTOR. GO-term enrichment analysis showed that proteins regulating RNA transport, metabolism, and translation were overrepresented in the mTOR interactome (Fig. 3E). One of them, the apoptotic chromatin condensation inducer in the nucleus (ACIN1), in the following referred to as acinus L, which had so far not been functionally linked to mTOR, was identified with high confidence as (1) insulin/aa- and raptor-dependent phosphorylation target, and (2) mTOR-interactor (Fig. 3D, marked in orange). In our further work, we thus focused on the analysis of acinus L.
Fig. 3.

The mTOR interactome. A, Experimental setup of the mTOR interactome analysis. HeLa cells were differentially labeled with SILAC amino acids and subjected to mock or mTOR immunopurification (IP) experiments. Eluates were mixed in equal ratios and proteins were separated by SDS-PAGE followed by in-gel digestion with trypsin and LC/MS analysis. Data obtained from three biological replicates including a SILAC label switch were analyzed using MaxQuant. B, Immunoblot analysis of samples obtained from mock and mTOR IPs as depicted in A. The mTOR IP yielded intact mTOR complexes as shown by co-immunoprecipitation of the known interaction partners raptor, rictor, and PRAS40. C, Mean log10 ratios of proteins detected in mTOR versus mock IP experiments and quantified in at least two out of three biological replicates were plotted against the negative log10 p value (Student′s t test). Proteins were considered significantly enriched with a mean ratio > 5 and a p value < 0.01 (sector highlighted in gray). Core components of mTOR complex 1 and 2 are marked in orange (mTOR, raptor, rictor, mLST8, and mSIN1). Proteins that were also found regulated in our phosphoproteome analysis are marked in blue. Raptor was found regulated in both analyses (marked in blue +orange) D, Overlap of proteins enriched with mTOR, and with changes in phosphorylation levels following restimulation and raptor knockdown. Proteins marked in light blue are sensitive to amino acid and insulin treatment, whereas proteins depicted in orange are responsive to raptor knockdown. E, Gene Ontology (GO) enrichment analysis of proteins enriched with mTOR for the three main GO domains cellular compartment, molecular function, and biological process. The length of the bar represents the log10 Benjamini-Hochberg corrected p value. The numbers represent the percentage of associated genes for each term.
Acinus L is a Novel mTORC1 Substrate and Interactor
Our central hypothesis was that proteins whose phosphorylation depends on the presence of insulin+aa and/or mTORC1, and that interact with mTOR have a high probability to be direct mTORC1 substrates. Our quantitative phosphoproteomics analysis revealed acinus L-S240 as raptor-dependent phosphorylation site. Because acinus L protein levels were not affected by raptor knockdown (supplemental Fig. S1A and S1B), acinus L may likely be a direct target of mTORC1. In order to determine whether mTORC1 indeed directly phosphorylates acinus L at S240, we designed a MS-enhanced in vitro kinase assay. mTORC1 was immunopurified from HeLa cells using a raptor-specific antibody (Fig. 4A). Acinus L consists of 1341 aa with a theoretical and apparent molecular mass of 151.9 and 220–250 kDa, respectively (63). As we needed the unphosphorylated protein as a substrate for kinase assays, we aimed to purify native acinus L from a bacterial expression system. Because of its large size, bacterial expression and protein purification of recombinant acinus L is challenging. We therefore cloned an N-terminal acinus L truncation construct (acinus L 1–523), comprising aa residues 1–523 with an N-terminal GST tag and a C-terminal myc-FLAG-tag (cumulative theoretical mass of 87 kDa), into a bacterial expression vector. Acinus L 1–523 was purified by GST pulldown and used as a substrate in in vitro kinase assays with immunopurified mTORC1 (raptor-mTOR). In addition, we performed the following controls: (1) the specific mTOR inhibitor Torin 1 (20) was added to the reaction at two different concentrations, (2) immunopurified raptor-mTOR was incubated without addition of acinus L 1–523, and (3) acinus L 1–523 was incubated with a mock IP (instead of immunopurified raptor-mTOR complexes). The presence of the respective proteins in each reaction was tested by immunoblotting (Fig. 4A). To further confirm the specificity of the approach, the same reactions were carried out with the known mTORC1 substrate 4E-BP1 followed by immunoblotting (Fig. 4B). As expected, 4E-BP1 was phosphorylated at T37/46 in the presence of mTORC1, and phosphorylation was reduced by Torin 1, showing that the reaction was specifically exerted by mTOR kinase. As no signals were observed in the negative controls (i.e. mock IP, or no addition of 4E-BP1), the signal detected by the phospho-specific antibody was confirmed to be specific for 4E-BP1 and mTORC1. Using high resolution MS, we next studied phosphorylation of acinus L 1–523 by immunopurified mTORC1. MS-enhanced mTORC1 kinase assays were performed in two independent replicates, yielding comparable results (Fig. 4C). We detected the peptide LSEGSQPAEEEEDQETPSR of acinus L 1–523 only in its monophosphorylated forms with the phosphate group located either at S240 or S243 (Fig. 4D and 4E, supplemental Fig. S2). Because both phosphoforms (pS240, pS243) showed the identical elution profile under the conditions applied here, relative quantification was performed based on the signal detected for both phosphoforms (supplemental Fig. S3). Our results showed acinus L 1–523 to be specifically phosphorylated in an mTORC1-dependent manner at S240/S243 (Fig. 4C–4E). These findings are in agreement with the raptor-dependent phosphorylation sites of acinus L identified in our phosphoproteome analysis (supplemental Table S2A, id 3676). Thus, based on our in vivo and in vitro data, we propose that mTORC1 directly phosphorylates acinus L at S240/S243.
Fig. 4.

Acinus L is directly phosphorylated by mTOR at S240/S243. A, B, Immunoblots of the mTOR kinase assay. To purify mTORC1 kinase, raptor IPs were performed. GST-tagged acinus NT-myc-FLAG served as substrate, and 4EBP1, known to be phosphorylated by mTOR on T37 and T46, served as a positive control. To test the specificity of the kinase reaction, the mTOR inhibitor Torin 1 was used in two different concentrations as indicated. The mock IP served as an additional negative control. C, Relative intensities of the monophosphorylated peptide LSEGSQPAEEEEDQETPSR of acinus L for all indicated conditions in two independent replicates. The dashed line indicates the cut-off for background phosphorylation as determined by the mock IP with acinus NT-myc-FLAG. D, E, Annotated MS/MS spectra of the monophosphorylated peptide LSEGSQPAEEEEDQETPSR of acinus L with localization of the phosphate moiety to S240 and S243, respectively. The zoom-in shown in D highlights the presence of the y16 ion (m/z 1788.91) specific for pS240, which is absent in E. *b, *y: fragment ions with neutral loss of H3PO4 (97.9768 u).
Finally, we sought to confirm whether endogenous acinus L interacts with mTORC1. Indeed, acinus L was specifically detected in an mTOR IP but not in a mock IP (Fig. 5A). To further characterize the interaction, we overexpressed FLAG-acinus L and acinus NT-myc-FLAG or transfected the empty control plasmids in mammalian cells (Fig. 5B), performed FLAG IPs, and detected mTOR and raptor. We found that the mTOR-raptor complex copurified with both full length FLAG-acinus L and truncated acinus NT-myc-FLAG (Fig. 5C). Thus, we conclude that the mTORC1-acinus interaction domain and the mTORC1 substrate sites are both located within the N-terminal region of acinus L.
Fig. 5.
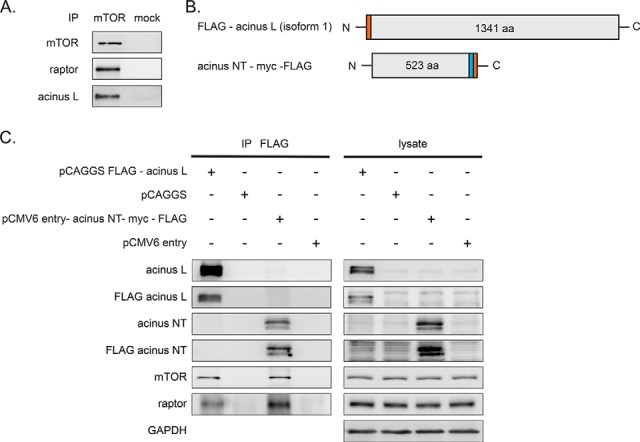
Acinus L is a novel mTOR interactor. A, Immunoblot analysis of mTOR and mock immunopurifications (IPs). The mTOR IP yielded intact mTOR complex 1 as shown by copurification of raptor. Acinus L specifically copurified with mTOR. B, Overview of the acinus constructs used in C. The FLAG-tag is shown in orange, the myc-tag in blue. C, Immunblot analysis of IPs with anti-FLAG antibody. The immunblots show an interaction of mTOR and raptor with acinus L and acinus NT-myc-FLAG. Acinus L was detected with an antibody against the N terminus of acinus L and the FLAG epitope, respectively.
DISCUSSION
In this work, we characterized the insulin+aa- and raptor-dependent phosphoproteome and identified the overlap with the mTOR interactome by a combined quantitative phosphoproteomics and interactomics approach. Three previous proteomic studies have analyzed different aspects of mTOR signaling in mammalian cells. First, Hsu et al. (44) analyzed insulin stimulation in combination with rapamycin or Torin 1 (ATP-analog mTOR inhibitor) treatment in HEK293 fibroblasts, as well as Torin 1 treated TSC2 knockout (KO) mouse embryonic fibroblasts (MEFs) by quantitative MS using iTRAQ. Second, Robitaille et al. (48) studied raptor and rictor KO MEFs without stimulation by a SILAC-based quantitative proteomics approach. And third, Yu et al. (45) analyzed TSC2 KO MEFs in combination with rapamycin treatment, and insulin-induced MEFs in combination with rapamycin and/or Ku-0063794 (ATP-analog mTOR inhibitor) using SILAC. In our study, we followed a SILAC-based phosphoproteomics approach that takes advantage of the specificity of a direct raptor knockdown combined with mTOR-induction by insulin and aa in HeLa cells. Moreover, to obtain a comprehensive picture of mTOR signaling, we delineated the mTOR interactome by SILAC-MS, which allowed us to suggest acinus L as a novel direct mTORC1 substrate. In general, our data correlate well with the three previous mTOR proteome studies, as discussed in more detail in the following. Hsu et al. (44) reported 127 Torin 1-sensitive phosphopeptides in HEK293T, and 231 in MEFs by calculating the median absolute deviation (MAD) to determine outliers for two out of four replicates. If we follow the same statistical approach, we determine 120 to 200 mTORC1-dependent phosphopeptides as outliers depending on the replicates chosen in our data set. Application of stringent criteria as reported in this work resulted in a set of 34 raptor-dependent phosphopeptides.
We identified mTORC1 target sites in both 40S ribosomal protein S6 (RPS6) and raptor. RPS6 is the best described S6K substrate, and is phosphorylated at S235, S236, and S240 (72–74). RPS6 phosphorylation, as determined by phosphoproteomics, was reported by Yu et al. (45) to be sensitive to mTOR inhibitors. The mTORC1 core component raptor (9, 10) is phosphorylated at S859 and S863 by mTOR (75, 76). The identification of these bona fide mTORC1-dependent phosphorylation sites, as well as the identification of raptor in our mTOR interactome, underscore the validity of our approach for the study of mTORC1 signaling. In addition, we report the cap-component and eukaryotic translation initiation factor 4GI (eIF4GI) as mTOR interactor, and identified eIF4GI phosphorylation at S1185 to be mTORC1-dependent. Interestingly, eIF4GI-S1185 phosphorylation was down-regulated by insulin+aa, but induced by raptor knockdown, suggesting that this change is mediated by an mTORC1-dependent phosphatase. However, this site may also be phosphorylated by mTOR as Robitaille et al. (48) found the synthetic eIF4GI peptide SFSKEVEER to be phosphorylated by recombinant mTOR in an in vitro kinase assay. Our findings also complement data from the Sonenberg lab that reported over a decade ago that serum-induced modulation of eIF4GI phosphorylation at Ser1108, Ser1148, and Ser1192 is mediated by PI3K and mTOR signaling (77). eIF4GI mediates mTOR-dependent translation, proliferation and autophagy inhibition, and eIF4GI inhibition phenocopies nutrient starvation and mTOR inhibition (78). Thus, eIF4GI is a major downstream effector of mTORC1, which is corroborated by our data.
Apart from translational control, negative feedback regulation of insulin signaling is another major mTORC1 output, involving IRS phosphorylation by S6K downstream of mTORC1 and subsequent destabilization of the IRS protein (79–81). This mechanism in conjunction with Grb10 phosphorylation by mTORC1 (44, 45) contributes to a well described negative feedback loop (2) that renders the IR complex refractory to insulin when mTORC1 is active. IRS exists in two isoforms, and phosphorylation of IRS-2 is far less studied than for IRS-1. Fritsche et al. (82) have shown that insulin-induced phosphorylation at IRS-2-S675 is mTOR-dependent, and Yu et al. (45) reported IRS-2 phosphorylation to be sensitive to mTOR-inhibitors. In this work, we report insulin-induced phosphorylation of IRS-2 at T527 to be raptor-dependent, possibly adding to an mTORC1-dependent negative feedback mechanism.
As a result of our combined phosphoproteome and interactome analysis, we identified acinus L as a potential direct mTORC1 substrate. Acinus L was significantly enriched with mTOR, and phosphorylation of acinus L at S240/S243 was insulin- and raptor-dependent in HeLa cells. This phosphorylation site appeared as Torin 1- and rapamycin-sensitive in one replicate of the phosphoproteome study by Hsu et al. (44). Another phosphopeptide (SQSPSPPPLPEDLEK, acinus L-pS391) of acinus L has been identified by Robitaille et al. (48) as an mTORC2 substrate in mouse embryonic fibroblasts by phosphoproteomics and a peptide array-based in vitro kinase assay. Neither of the two previous studies reported binding studies for acinus L. In this work, the overlay of the mTOR phosphoproteome and interactome in human cells led to the identification of acinus L as a prime candidate for both mTOR binding and mTORC1-dependent phosphorylation. In addition, our study identified further novel insulin-dependent phosphotargets and mTOR interactors (Fig. 3D, supplemental Tables S2, S4, and S5), which may link to mTORC2 substrates and/or insulin dependent mTORC1 and mTORC2 regulation. We chose to focus here on mTORC1-specific phosphotargets and interactors, and we thus proceeded to validate acinus L as a new direct substrate of mTORC1.
Our functional analyses confirmed that acinus L is a direct mTOR interactor, which is specifically phosphorylated at S240/243 by mTORC1. Hence, our initial hypothesis that direct mTOR interactors whose phosphorylation is raptor-dependent are direct mTORC1 targets turned out to be valid. Furthermore, our data provide a rich source for follow-up studies of mTOR interactors and substrates, and the experimental strategy outlined here is well-suited to delineate mTOR substrate networks under different metabolic conditions and in different cell types in future work.
What may be the functional connection between acinus L and mTORC1? Acinus L is a component of the apoptosis- and splicing-associated protein (ASAP) complex, which associates with the exon junction complex (EJC) (83, 84). The EJC plays an important role in mRNA surveillance by binding upstream of exon–exon junctions of newly spliced mRNA to ensure the accuracy and efficiency of eukaryotic gene expression in the first, pioneer round of protein synthesis. Thus, deposition of EJCs within the ORF correlates with enhanced cytoplasmic polysome association of spliced mRNAs and an increased translational yield (85). Of note, activated S6K contributes to this process, as when recruited to newly spliced mRNA by the EJC protein SKAR, S6K1 increases the translation efficiency (84). In addition, when bound to the 3′-UTR of mRNAs (85), the ASAP complex and the EJC function together in nonsense-mediated decay (86) to eliminate mRNAs that would prematurely terminate translation.
Acinus L belongs to the “peripheral” components of the EJC (87). Interestingly, the EJC core component mago nashi homolog 2 (MAGOHB) (88), the peripheral EJC component pinin and the NMD factors UPF1, UPF2, and UPF3B (85) scored also as highly significant in our mTOR-interactome analysis. Further core and peripheral EJC components (i.e. histone deacetylase complex subunit SAP18, RNA-binding protein with serine-rich domain 1 (RNPS1), eukaryotic initiation factor 4A-III (eIF4AIII), RNA-binding protein 8A (Y14), and metastatic lymph node gene 51 protein (MLN51)) were also found enriched with mTOR but did not pass our stringent filter criteria for candidate proteins. The high representation of EJC components in our mTOR interactome together with the discovery that acinus L is a direct mTORC1 substrate strongly suggest that, under insulin and aa stimulation, the EJC complex may provide a framework for the regulation of the pioneer round of translation by mTORC1. Acinus L may be a component that transmits a signal from mTORC1 to the EJC, thus contributing to the enhanced translation efficiency of spliced over nonspliced mRNAs (84). In line with this, the oncogenic kinase Akt, which is upstream mTORC1, has been shown to bind acinus L in a PI3K-dependent manner (89). Acinus L itself is strongly overexpressed and phosphorylated in human patients with myeloid hematological malignancies (87), and the ACIN1 gene is hypermethylated in lung carcinoma (90) and found mutated in up to 8% of the analyzed tumors depending on the study and tumor entity (91). Thus, we advocate further investigation of acinus L to explore its potential as molecular target downstream of mTORC1 in cancers.
Supplementary Material
Footnotes
Author contributions: J.J.S., H.W., B.W., and K.T. designed research; J.J.S., H.W., and R.C.T. performed research; M.Z. and J.D. contributed new reagents or analytic tools; J.J.S., H.W., B.W., and K.T. analyzed data; J.J.S., H.W., B.W., and K.T. wrote the paper.
* This work was supported in part by BMBF Gerontosys II - NephAge (031 5896A) (KT, JD), the Excellence Initiative of the German Federal and State Governments Grant EXC 294 BIOSS Centre for Biological Signaling Studies (EXC 294 to KT, BW, JD; FRIAS LifeNet to KT, JD; GSC-4, Spemann Graduate School to JJS), and the Schlieben-Lange-Programm (KT); KT is the recipient of a Rosalind Franklin Fellowship, University of Groningen, NL.
 This article contains supplemental Figs. S1 to S3, Text, and Tables S1 to S6.
1 The abbreviations used are:
- mTOR
- mammalian target of rapamycin
- 4E-BP
- 4E-binding protein
- aa
- amino acid
- acinus / ACIN1
- apoptotic chromatin condensation inducer in the nucleus
- AGC kinase
- kinase of protein kinase A, G, C families
- AHNAK
- neuroblast differentiation-associated protein AHNAK
- AMPK
- AMP-dependent kinase
- ASAP
- apoptosis- and splicing-associated protein
- AUC FW5PM
- area under the curve, full width at 5% peak height
- BCLAF1
- bcl-2-associated transcription factor 1
- CAD
- carbamoyl-phosphate synthetase 2, aspartate transcarbamoylase, dihydroorotase
- Deptor
- DEP domain-containing mTOR-interacting protein
- eIF4G
- translation initiation factor 4G
- EJC
- exon junction complex
- Grb10
- growth factor receptor-bound protein 10
- IPTG
- isopropyl β-D-1-thiogalactopyranoside
- IR
- insulin receptor
- IRS
- insulin receptor substrate
- ITRAQ
- isobaric tags for relative and absolute quantitation
- LFQ
- label-free quantification
- MEF
- mouse embryonic fibroblasts
- mLST8/GbetaL
- target of rapamycin complex subunit LST8/ G protein beta subunit-like
- mSIN1
- target of rapamycin complex 2 subunit MAPKAP1
- mTORC1
- mTOR complex 1
- NFL
- negative feedback loop
- PDK1
- phosphoinositide-dependent protein kinase 1
- PI3K
- phosphatidylinositide 3-kinase
- PIP3
- phosphatidylinositol (3,4,5)-trisphosphate
- PKC
- protein kinase C
- PLEC
- plectin
- PRAS40
- proline-rich AKT1 substrate 1
- PRR5/L
- proline-rich protein 5/-like
- Raptor
- regulatory-associated protein of mTOR
- Rheb
- ras homolog enriched in brain
- Rictor
- rapamycin-insensitive companion of mammalian target of rapamycin
- RPS6
- ribosomal protein 6
- RSK1
- ribosomal S6 kinase 1
- S6K
- S6-kinase
- SDC
- sodium deoxycholate
- SGK
- serum and glucocorticoid kinase
- SILAC
- stable isotope labeling by amino acids in cell culture
- SLK
- STE20-like serine/threonine-protein kinase
- SPTBN1
- spectrin beta chain, brain 1
- TiO2
- titanium dioxide
- TSC
- tuberous sclerosis complex
- XIC
- extracted ion chromatogram.
REFERENCES
- 1. Cornu M., Albert V., Hall M. N. (2013) mTOR in aging, metabolism, and cancer. Curr. Opin. Genet. Dev. 23, 53–62 [DOI] [PubMed] [Google Scholar]
- 2. Laplante M., Sabatini D. M. (2012) mTOR signaling in growth control and disease. Cell 149, 274–293 [DOI] [PMC free article] [PubMed] [Google Scholar]
- 3. Inoki K., Kim J., Guan K. L. (2012) AMPK and mTOR in cellular energy homeostasis and drug targets. Annu. Rev. Pharmacol. Toxicol. 52, 381–400 [DOI] [PubMed] [Google Scholar]
- 4. Sami A., Karsy M. (2013) Targeting the PI3K/AKT/mTOR signaling pathway in glioblastoma: novel therapeutic agents and advances in understanding. Tumour Biol. 34, 1991–2002 [DOI] [PubMed] [Google Scholar]
- 5. Jacinto E., Loewith R., Schmidt A., Lin S., Ruegg M. A., Hall A., Hall M. N. (2004) Mammalian TOR complex 2 controls the actin cytoskeleton and is rapamycin insensitive. Nat.Cell Biol. 6, 1122–1128 [DOI] [PubMed] [Google Scholar]
- 6. Loewith R., Jacinto E., Wullschleger S., Lorberg A., Crespo J. L., Bonenfant D., Oppliger W., Jenoe P., Hall M. N. (2002) Two TOR complexes, only one of which is rapamycin sensitive, have distinct roles in cell growth control. Mol.Cell 10, 457–468 [DOI] [PubMed] [Google Scholar]
- 7. Sarbassov D. D., Ali S. M., Kim D. H., Guertin D. A., Latek R. R., Erdjument-Bromage H., Tempst P., Sabatini D. M. (2004) Rictor, a novel binding partner of mTOR, defines a rapamycin-insensitive and raptor-independent pathway that regulates the cytoskeleton. Curr. Biol. 14, 1296–1302 [DOI] [PubMed] [Google Scholar]
- 8. Peterson T. R., Laplante M., Thoreen C. C., Sancak Y., Kang S. A., Kuehl W. M., Gray N. S., Sabatini D. M. (2009) DEPTOR is an mTOR inhibitor frequently overexpressed in multiple myeloma cells and required for their survival. Cell 137, 873–886 [DOI] [PMC free article] [PubMed] [Google Scholar]
- 9. Kim D. H., Sarbassov D. D., Ali S. M., King J. E., Latek R. R., Erdjument-Bromage H., Tempst P., Sabatini D. M. (2002) mTOR interacts with raptor to form a nutrient-sensitive complex that signals to the cell growth machinery. Cell 110, 163–175 [DOI] [PubMed] [Google Scholar]
- 10. Hara K., Maruki Y., Long X., Yoshino K., Oshiro N., Hidayat S., Tokunaga C., Avruch J., Yonezawa K. (2002) Raptor, a binding partner of target of rapamycin (TOR), mediates TOR action. Cell 110, 177–189 [DOI] [PubMed] [Google Scholar]
- 11. Jacinto E., Facchinetti V., Liu D., Soto N., Wei S., Jung S. Y., Huang Q., Qin J., Su B. (2006) SIN1/MIP1 maintains rictor-mTOR complex integrity and regulates Akt phosphorylation and substrate specificity. Cell 127, 125–137 [DOI] [PubMed] [Google Scholar]
- 12. Frias M. A., Thoreen C. C., Jaffe J. D., Schroder W., Sculley T., Carr S. A., Sabatini D. M. (2006) mSin1 is necessary for Akt/PKB phosphorylation, and its isoforms define three distinct mTORC2s. Curr. Biol. 16, 1865–1870 [DOI] [PubMed] [Google Scholar]
- 13. Yang Q., Inoki K., Ikenoue T., Guan K. L. (2006) Identification of Sin1 as an essential TORC2 component required for complex formation and kinase activity. Genes Dev. 20, 2820–2832 [DOI] [PMC free article] [PubMed] [Google Scholar]
- 14. Pearce L. R., Huang X., Boudeau J., Pawlowski R., Wullschleger S., Deak M., Ibrahim A. F., Gourlay R., Magnuson M. A., Alessi D. R. (2007) Identification of Protor as a novel Rictor-binding component of mTOR complex-2. Biochem. J. 405, 513–522 [DOI] [PMC free article] [PubMed] [Google Scholar]
- 15. Thedieck K., Polak P., Kim M. L., Molle K. D., Cohen A., Jeno P., Arrieumerlou C., Hall M. N. (2007) PRAS40 and PRR5-like protein are new mTOR interactors that regulate apoptosis. PLoS One 2, e1217. [DOI] [PMC free article] [PubMed] [Google Scholar]
- 16. Woo S. Y., Kim D. H., Jun C. B., Kim Y. M., Haar E. V., Lee S. I., Hegg J. W., Bandhakavi S., Griffin T. J., Kim D. H. (2007) PRR5, a novel component of mTOR complex 2, regulates platelet-derived growth factor receptor beta expression and signaling. J. Biol. Chem. 282, 25604–25612 [DOI] [PubMed] [Google Scholar]
- 17. Lamming D. W., Ye L., Katajisto P., Goncalves M. D., Saitoh M., Stevens D. M., Davis J. G., Salmon A. B., Richardson A., Ahima R. S., Guertin D. A., Sabatini D. M., Baur J. A. (2012) Rapamycin-induced insulin resistance is mediated by mTORC2 loss and uncoupled from longevity. Science 335, 1638–1643 [DOI] [PMC free article] [PubMed] [Google Scholar]
- 18. Sarbassov D. D., Ali S. M., Sengupta S., Sheen J. H., Hsu P. P., Bagley A. F., Markhard A. L., Sabatini D. M. (2006) Prolonged rapamycin treatment inhibits mTORC2 assembly and Akt/PKB. Mol.Cell 22, 159–168 [DOI] [PubMed] [Google Scholar]
- 19. Benjamin D., Colombi M., Moroni C., Hall M. N. (2011) Rapamycin passes the torch: a new generation of mTOR inhibitors. Nat. Rev. Drug Discov. 10, 868–880 [DOI] [PubMed] [Google Scholar]
- 20. Thoreen C. C., Kang S. A., Chang J. W., Liu Q., Zhang J., Gao Y., Reichling L. J., Sim T., Sabatini D. M., Gray N. S. (2009) An ATP-competitive mammalian target of rapamycin inhibitor reveals rapamycin-resistant functions of mTORC1. J. Biol. Chem. 284, 8023–8032 [DOI] [PMC free article] [PubMed] [Google Scholar]
- 21. Dibble C. C., Manning B. D. (2013) Signal integration by mTORC1 coordinates nutrient input with biosynthetic output. Nat. Cell Biol. 15, 555–564 [DOI] [PMC free article] [PubMed] [Google Scholar]
- 22. Zoncu R., Efeyan A., Sabatini D. M. (2011) mTOR: from growth signal integration to cancer, diabetes, and aging. Nat. Rev. Mol. Cell Biol. 12, 21–35 [DOI] [PMC free article] [PubMed] [Google Scholar]
- 23. Alessi D. R., James S. R., Downes C. P., Holmes A. B., Gaffney P. R., Reese C. B., Cohen P. (1997) Characterization of a 3-phosphoinositide-dependent protein kinase which phosphorylates and activates protein kinase Balpha. Curr. Biol. 7, 261–269 [DOI] [PubMed] [Google Scholar]
- 24. Inoki K., Li Y., Zhu T., Wu J., Guan K. L. (2002) TSC2 is phosphorylated and inhibited by Akt and suppresses mTOR signaling. Nat. Cell Biol. 4, 648–657 [DOI] [PubMed] [Google Scholar]
- 25. Manning B. D., Tee A. R., Logsdon M. N., Blenis J., Cantley L. C. (2002) Identification of the tuberous sclerosis complex-2 tumor suppressor gene product tuberin as a target of the phosphoinositide 3-kinase/akt pathway. Mol. Cell 10, 151–162 [DOI] [PubMed] [Google Scholar]
- 26. Garami A., Zwartkruis F. J., Nobukuni T., Joaquin M., Roccio M., Stocker H., Kozma S. C., Hafen E., Bos J. L., Thomas G. (2003) Insulin activation of Rheb, a mediator of mTOR/S6K/4E-BP signaling, is inhibited by TSC1 and 2. Mol. Cell 11, 1457–1466 [DOI] [PubMed] [Google Scholar]
- 27. Stocker H., Radimerski T., Schindelholz B., Wittwer F., Belawat P., Daram P., Breuer S., Thomas G., Hafen E. (2003) Rheb is an essential regulator of S6K in controlling cell growth in Drosophila. Nat. Cell Biol. 5, 559–565 [DOI] [PubMed] [Google Scholar]
- 28. Inoki K., Li Y., Xu T., Guan K. L. (2003) Rheb GTPase is a direct target of TSC2 GAP activity and regulates mTOR signaling. Genes Dev. 17, 1829–1834 [DOI] [PMC free article] [PubMed] [Google Scholar]
- 29. Saucedo L. J., Gao X., Chiarelli D. A., Li L., Pan D., Edgar B. A. (2003) Rheb promotes cell growth as a component of the insulin/TOR signaling network. Nat. Cell Biol. 5, 566–571 [DOI] [PubMed] [Google Scholar]
- 30. Tee A. R., Manning B. D., Roux P. P., Cantley L. C., Blenis J. (2003) Tuberous sclerosis complex gene products, Tuberin and Hamartin, control mTOR signaling by acting as a GTPase-activating protein complex toward Rheb. Curr. Biol. 13, 1259–1268 [DOI] [PubMed] [Google Scholar]
- 31. Sancak Y., Bar-Peled L., Zoncu R., Markhard A. L., Nada S., Sabatini D. M. (2010) Ragulator-Rag complex targets mTORC1 to the lysosomal surface and is necessary for its activation by amino acids. Cell 141, 290–303 [DOI] [PMC free article] [PubMed] [Google Scholar]
- 32. Sancak Y., Sabatini D. M. (2009) Rag proteins regulate amino-acid-induced mTORC1 signaling. Biochem. Soc. Trans. 37, 289–290 [DOI] [PMC free article] [PubMed] [Google Scholar]
- 33. Inoki K., Zhu T., Guan K. L. (2003) TSC2 mediates cellular energy response to control cell growth and survival. Cell 115, 577–590 [DOI] [PubMed] [Google Scholar]
- 34. Gwinn D. M., Shackelford D. B., Egan D. F., Mihaylova M. M., Mery A., Vasquez D. S., Turk B. E., Shaw R. J. (2008) AMPK phosphorylation of raptor mediates a metabolic checkpoint. Mol.Cell 30, 214–226 [DOI] [PMC free article] [PubMed] [Google Scholar]
- 35. Brown E. J., Beal P. A., Keith C. T., Chen J., Shin T. B., Schreiber S. L. (1995) Control of p70 s6 kinase by kinase activity of FRAP in vivo. Nature 377, 441–446 [DOI] [PubMed] [Google Scholar]
- 36. Brunn G. J., Hudson C. C., Sekulic A., Williams J. M., Hosoi H., Houghton P. J., Lawrence J. C., Jr., Abraham R. T. (1997) Phosphorylation of the translational repressor PHAS-I by the mammalian target of rapamycin. Science 277, 99–101 [DOI] [PubMed] [Google Scholar]
- 37. Burnett P. E., Barrow R. K., Cohen N. A., Snyder S. H., Sabatini D. M. (1998) RAFT1 phosphorylation of the translational regulators p70 S6 kinase and 4E-BP1. Proc. Natl. Acad. Sci. U.S.A. 95, 1432–1437 [DOI] [PMC free article] [PubMed] [Google Scholar]
- 38. Nascimento E. B., Snel M., Guigas B., van der Zon G. C., Kriek J., Maassen J. A., Jazet I. M., Diamant M., Ouwens D. M. (2010) Phosphorylation of PRAS40 on Thr246 by PKB/AKT facilitates efficient phosphorylation of Ser183 by mTORC1. Cell Signal. 22, 961–967 [DOI] [PubMed] [Google Scholar]
- 39. Fonseca B. D., Smith E. M., Lee V. H., MacKintosh C., Proud C. G. (2007) PRAS40 is a target for mammalian target of rapamycin complex 1 and is required for signaling downstream of this complex. J. Biol. Chem. 282, 24514–24524 [DOI] [PubMed] [Google Scholar]
- 40. Oshiro N., Takahashi R., Yoshino K., Tanimura K., Nakashima A., Eguchi S., Miyamoto T., Hara K., Takehana K., Avruch J., Kikkawa U., Yonezawa K. (2007) The proline-rich Akt substrate of 40 kDa (PRAS40) is a physiological substrate of mammalian target of rapamycin complex 1. J. Biol. Chem. 282, 20329–20339 [DOI] [PMC free article] [PubMed] [Google Scholar]
- 41. Wang L., Harris T. E., Lawrence J. C., Jr. (2008) Regulation of proline-rich Akt substrate of 40 kDa (PRAS40) function by mammalian target of rapamycin complex 1 (mTORC1)-mediated phosphorylation. J. Biol. Chem. 283, 15619–15627 [DOI] [PMC free article] [PubMed] [Google Scholar]
- 42. Proud C. G. (2007) Signaling to translation: how signal transduction pathways control the protein synthetic machinery. Biochem. J. 403, 217–234 [DOI] [PubMed] [Google Scholar]
- 43. Thedieck K., Hall M. N. (2009) Translational Control by Amino Acids and Energy. In: Dennis R. B. a. E., ed. The Handbook of Cell Signaling, 2 Ed., pp. 2285–2293 [Google Scholar]
- 44. Hsu P. P., Kang S. A., Rameseder J., Zhang Y., Ottina K. A., Lim D., Peterson T. R., Choi Y., Gray N. S., Yaffe M. B., Marto J. A., Sabatini D. M. (2011) The mTOR-regulated phosphoproteome reveals a mechanism of mTORC1-mediated inhibition of growth factor signaling. Science 332, 1317–1322 [DOI] [PMC free article] [PubMed] [Google Scholar]
- 45. Yu Y., Yoon S. O., Poulogiannis G., Yang Q., Ma X. M., Villen J., Kubica N., Hoffman G. R., Cantley L. C., Gygi S. P., Blenis J. (2011) Phosphoproteomic analysis identifies Grb10 as an mTORC1 substrate that negatively regulates insulin signaling. Science 332, 1322–1326 [DOI] [PMC free article] [PubMed] [Google Scholar]
- 46. Kim J., Kundu M., Viollet B., Guan K. L. (2011) AMPK and mTOR regulate autophagy through direct phosphorylation of Ulk1. Nat. Cell Biol. 13, 132–141 [DOI] [PMC free article] [PubMed] [Google Scholar]
- 47. Ben-Sahra I., Howell J. J., Asara J. M., Manning B. D. (2013) Stimulation of de novo pyrimidine synthesis by growth signaling through mTOR and S6K1. Science 339, 1323–1328 [DOI] [PMC free article] [PubMed] [Google Scholar]
- 48. Robitaille A. M., Christen S., Shimobayashi M., Cornu M., Fava L. L., Moes S., Prescianotto-Baschong C., Sauer U., Jenoe P., Hall M. N. (2013) Quantitative phosphoproteomics reveal mTORC1 activates de novo pyrimidine synthesis. Science 339, 1320–1323 [DOI] [PubMed] [Google Scholar]
- 49. Dalle Pezze P., Sonntag A. G., Thien A., Prentzell M. T., Godel M., Fischer S., Neumann-Haefelin E., Huber T. B., Baumeister R., Shanley D. P., Thedieck K. (2012) A dynamic network model of mTOR signaling reveals TSC-independent mTORC2 Regulation. Sci. Signal. 5, ra25. [DOI] [PubMed] [Google Scholar]
- 50. Wahane S. D., Hellbach N., Prentzell M. T., Weise S. C., Vezzali R., Kreutz C., Timmer J., Krieglstein K., Thedieck K., Vogel T. (2014) PI3K-p110-alpha-subtype signaling mediates survival, proliferation and neurogenesis of cortical progenitor cells via activation of mTORC2. J. Neurochem. 130, 255–267 [DOI] [PubMed] [Google Scholar]
- 51. Tato I., Bartrons R., Ventura F., Rosa J. L. (2011) Amino acids activate mammalian target of rapamycin complex 2 (mTORC2) via PI3K/Akt signaling. J. Biol. Chem. 286, 6128–6142 [DOI] [PMC free article] [PubMed] [Google Scholar]
- 52. Sarbassov D. D., Guertin D. A., Ali S. M., Sabatini D. M. (2005) Phosphorylation and regulation of Akt/PKB by the rictor-mTOR complex. Science 307, 1098–1101 [DOI] [PubMed] [Google Scholar]
- 53. Hresko R. C., Mueckler M. (2005) mTOR.RICTOR is the Ser473 kinase for Akt/protein kinase B in 3T3-L1 adipocytes. J. Biol. Chem. 280, 40406–40416 [DOI] [PubMed] [Google Scholar]
- 54. Garcia-Martinez J. M., Alessi D. R. (2008) mTOR complex 2 (mTORC2) controls hydrophobic motif phosphorylation and activation of serum- and glucocorticoid-induced protein kinase 1 (SGK1). Biochem. J. 416, 375–385 [DOI] [PubMed] [Google Scholar]
- 55. Ikenoue T., Inoki K., Yang Q., Zhou X., Guan K. L. (2008) Essential function of TORC2 in PKC and Akt turn motif phosphorylation, maturation, and signaling. EMBO J. 27, 1919–1931 [DOI] [PMC free article] [PubMed] [Google Scholar]
- 56. Bruhn M. A., Pearson R. B., Hannan R. D., Sheppard K. E. (2010) Second AKT: the rise of SGK in cancer signaling. Growth Fact. 28, 394–408 [DOI] [PubMed] [Google Scholar]
- 57. Pearce L. R., Komander D., Alessi D. R. (2010) The nuts and bolts of AGC protein kinases. Nat. Rev. Mol. Cell Biol. 11, 9–22 [DOI] [PubMed] [Google Scholar]
- 58. Jacinto E., Lorberg A. (2008) TOR regulation of AGC kinases in yeast and mammals. Biochem. J. 410, 19–37 [DOI] [PubMed] [Google Scholar]
- 59. Hagiwara A., Cornu M., Cybulski N., Polak P., Betz C., Trapani F., Terracciano L., Heim M. H., Ruegg M. A., Hall M. N. (2012) Hepatic mTORC2 Activates Glycolysis and Lipogenesis through Akt, Glucokinase, and SREBP1c. Cell Metab. 15, 725–738 [DOI] [PubMed] [Google Scholar]
- 60. Ong S. E., Blagoev B., Kratchmarova I., Kristensen D. B., Steen H., Pandey A., Mann M. (2002) Stable isotope labeling by amino acids in cell culture, SILAC, as a simple and accurate approach to expression proteomics. Mol. Cell. Proteomics 1, 376–386 [DOI] [PubMed] [Google Scholar]
- 61. Sonntag A. G., Dalle Pezze P., Shanley D. P., Thedieck K. (2012) A modeling-experimental approach reveals insulin receptor substrate (IRS)-dependent regulation of adenosine monosphosphate-dependent kinase (AMPK) by insulin. FEBS J. 279, 3314–3328 [DOI] [PubMed] [Google Scholar]
- 62. Thedieck K., Holzwarth B., Prentzell M. T., Boehlke C., Klasener K., Ruf S., Sonntag A. G., Maerz L., Grellscheid S. N., Kremmer E., Nitschke R., Kuehn E. W., Jonker J. W., Groen A. K., Reth M., Hall M. N., Baumeister R. (2013) Inhibition of mTORC1 by astrin and stress granules prevents apoptosis in cancer cells. Cell 154, 859–874 [DOI] [PubMed] [Google Scholar]
- 63. Sahara S., Aoto M., Eguchi Y., Imamoto N., Yoneda Y., Tsujimoto Y. (1999) Acinus is a caspase-3-activated protein required for apoptotic chromatin condensation. Nature 401, 168–173 [DOI] [PubMed] [Google Scholar]
- 64. Zarei M., Sprenger A., Metzger F., Gretzmeier C., Dengjel J. (2011) Comparison of ERLIC-TiO2, HILIC-TiO2, and SCX-TiO2 for global phosphoproteomics approaches. J. Proteome Res. 10, 3474–3483 [DOI] [PubMed] [Google Scholar]
- 65. Wiese H., Kuhlmann K., Wiese S., Stoepel N. S., Pawlas M., Meyer H. E., Stephan C., Eisenacher M., Drepper F., Warscheid B. (2014) Comparison of alternative MS/MS and bioinformatics approaches for confident phosphorylation site localization. J. Proteome Res. 13, 1128–1137 [DOI] [PubMed] [Google Scholar]
- 66. Cox J., Mann M. (2008) MaxQuant enables high peptide identification rates, individualized p.p.b.-range mass accuracies and proteome-wide protein quantification. Nat. Biotechnol. 26, 1367–1372 [DOI] [PubMed] [Google Scholar]
- 67. Cox J., Neuhauser N., Michalski A., Scheltema R. A., Olsen J. V., Mann M. (2011) Andromeda: a peptide search engine integrated into the MaxQuant environment. J. Proteome Res. 10, 1794–1805 [DOI] [PubMed] [Google Scholar]
- 68. Vizcaino J. A., Cote R., Reisinger F., Foster J. M., Mueller M., Rameseder J., Hermjakob H., Martens L. (2009) A guide to the Proteomics Identifications Database proteomics data repository. Proteomics 9, 4276–4283 [DOI] [PMC free article] [PubMed] [Google Scholar]
- 69. Shannon P., Markiel A., Ozier O., Baliga N. S., Wang J. T., Ramage D., Amin N., Schwikowski B., Ideker T. (2003) Cytoscape: a software environment for integrated models of biomolecular interaction networks. Genome Res. 13, 2498–2504 [DOI] [PMC free article] [PubMed] [Google Scholar]
- 70. Bindea G., Mlecnik B., Hackl H., Charoentong P., Tosolini M., Kirilovsky A., Fridman W. H., Pages F., Trajanoski Z., Galon J. (2009) ClueGO: a Cytoscape plug-in to decipher functionally grouped Gene Ontology and pathway annotation networks. Bioinformatics 25, 1091–1093 [DOI] [PMC free article] [PubMed] [Google Scholar]
- 71. Jensen L. J., Kuhn M., Stark M., Chaffron S., Creevey C., Muller J., Doerks T., Julien P., Roth A., Simonovic M., Bork P., von Mering C. (2009) STRING 8 – a global view on proteins and their functional interactions in 630 organisms. Nucleic Acids Res. 37, D412–D416 [DOI] [PMC free article] [PubMed] [Google Scholar]
- 72. Ferrari S., Bandi H. R., Hofsteenge J., Bussian B. M., Thomas G. (1991) Mitogen-activated 70K S6 kinase. Identification of in vitro 40 S ribosomal S6 phosphorylation sites. J. Biol. Chem. 266, 22770–22775 [PubMed] [Google Scholar]
- 73. Chung J., Kuo C. J., Crabtree G. R., Blenis J. (1992) Rapamycin-FKBP specifically blocks growth-dependent activation of and signaling by the 70 kd S6 protein kinases. Cell 69, 1227–1236 [DOI] [PubMed] [Google Scholar]
- 74. Roux P. P., Shahbazian D., Vu H., Holz M. K., Cohen M. S., Taunton J., Sonenberg N., Blenis J. (2007) RAS/ERK signaling promotes site-specific ribosomal protein S6 phosphorylation via RSK and stimulates cap-dependent translation. J. Biol. Chem. 282, 14056–14064 [DOI] [PMC free article] [PubMed] [Google Scholar]
- 75. Wang L., Lawrence J. C., Jr., Sturgill T. W., Harris T. E. (2009) Mammalian target of rapamycin complex 1 (mTORC1) activity is associated with phosphorylation of raptor by mTOR. J. Biol. Chem. 284, 14693–14697 [DOI] [PMC free article] [PubMed] [Google Scholar]
- 76. Foster K. G., Acosta-Jaquez H. A., Romeo Y., Ekim B., Soliman G. A., Carriere A., Roux P. P., Ballif B. A., Fingar D. C. (2010) Regulation of mTOR complex 1 (mTORC1) by raptor Ser863 and multisite phosphorylation. J. Biol. Chem. 285, 80–94 [DOI] [PMC free article] [PubMed] [Google Scholar]
- 77. Raught B., Gingras A. C., Gygi S. P., Imataka H., Morino S., Gradi A., Aebersold R., Sonenberg N. (2000) Serum-stimulated, rapamycin-sensitive phosphorylation sites in the eukaryotic translation initiation factor 4GI. EMBO J. 19, 434–444 [DOI] [PMC free article] [PubMed] [Google Scholar]
- 78. Ramirez-Valle F., Braunstein S., Zavadil J., Formenti S. C., Schneider R. J. (2008) eIF4GI links nutrient sensing by mTOR to cell proliferation and inhibition of autophagy. J. Cell Biol. 181, 293–307 [DOI] [PMC free article] [PubMed] [Google Scholar]
- 79. Myers M. G., Jr., Grammer T. C., Wang L. M., Sun X. J., Pierce J. H., Blenis J., White M. F. (1994) Insulin receptor substrate-1 mediates phosphatidylinositol 3′-kinase and p70S6k signaling during insulin, insulin-like growth factor-1, and interleukin-4 stimulation. J. Biol. Chem. 269, 28783–28789 [PubMed] [Google Scholar]
- 80. Shah O. J., Wang Z., Hunter T. (2004) Inappropriate activation of the TSC/Rheb/mTOR/S6K cassette induces IRS1/2 depletion, insulin resistance, and cell survival deficiencies. Curr. Biol. 14, 1650–1656 [DOI] [PubMed] [Google Scholar]
- 81. Harrington L. S., Findlay G. M., Gray A., Tolkacheva T., Wigfield S., Rebholz H., Barnett J., Leslie N. R., Cheng S., Shepherd P. R., Gout I., Downes C. P., Lamb R. F. (2004) The TSC1–2 tumor suppressor controls insulin-PI3K signaling via regulation of IRS proteins. J. Cell Biol. 166, 213–223 [DOI] [PMC free article] [PubMed] [Google Scholar]
- 82. Fritsche L., Neukamm S. S., Lehmann R., Kremmer E., Hennige A. M., Hunder-Gugel A., Schenk M., Haring H. U., Schleicher E. D., Weigert C. (2011) Insulin-induced serine phosphorylation of IRS-2 via ERK1/2 and mTOR: studies on the function of Ser675 and Ser907. Am. J. Physiol. Endocrinol. Metab. 300, E824–E836 [DOI] [PubMed] [Google Scholar]
- 83. Schwerk C., Prasad J., Degenhardt K., Erdjument-Bromage H., White E., Tempst P., Kidd V. J., Manley J. L., Lahti J. M., Reinberg D. (2003) ASAP, a novel protein complex involved in RNA processing and apoptosis. Mol. Cell. Biol. 23, 2981–2990 [DOI] [PMC free article] [PubMed] [Google Scholar]
- 84. Ma X. M., Yoon S. O., Richardson C. J., Julich K., Blenis J. (2008) SKAR links premRNA splicing to mTOR/S6K1-mediated enhanced translation efficiency of spliced mRNAs. Cell 133, 303–313 [DOI] [PubMed] [Google Scholar]
- 85. Nott A., Le Hir H., Moore M. J. (2004) Splicing enhances translation in mammalian cells: an additional function of the exon junction complex. Genes Dev. 18, 210–222 [DOI] [PMC free article] [PubMed] [Google Scholar]
- 86. Lykke-Andersen J., Shu M. D., Steitz J. A. (2001) Communication of the position of exon–exon junctions to the mRNA surveillance machinery by the protein RNPS1. Science 293, 1836–1839 [DOI] [PubMed] [Google Scholar]
- 87. Jang S. W., Yang S. J., Ehlen A., Dong S., Khoury H., Chen J., Persson J. L., Ye K. (2008) Serine/arginine protein-specific kinase 2 promotes leukemia cell proliferation by phosphorylating acinus and regulating cyclin A1. Cancer Res. 68, 4559–4570 [DOI] [PMC free article] [PubMed] [Google Scholar]
- 88. Tange T. O., Nott A., Moore M. J. (2004) The ever-increasing complexities of the exon junction complex. Curr. Opin. Cell Biol. 16, 279–284 [DOI] [PubMed] [Google Scholar]
- 89. Hu Y., Yao J., Liu Z., Liu X., Fu H., Ye K. (2005) Akt phosphorylates acinus and inhibits its proteolytic cleavage, preventing chromatin condensation. EMBO J. 24, 3543–3554 [DOI] [PMC free article] [PubMed] [Google Scholar]
- 90. Shu Y., Iijima T., Sun W., Kano J., Ishiyama T., Okubo C., Anami Y., Tanaka R., Fukai S., Noguchi M. (2006) The ACIN1 gene is hypermethylated in early stage lung adenocarcinoma. J. Thorac. Oncol. 1, 160–167 [PubMed] [Google Scholar]
- 91. Cerami E., Gao J., Dogrusoz U., Gross B. E., Sumer S. O., Aksoy B. A., Jacobsen A., Byrne C. J., Heuer M. L., Larsson E., Antipin Y., Reva B., Goldberg A. P., Sander C., Schultz N. (2012) The cBio cancer genomics portal: an open platform for exploring multidimensional cancer genomics data. Cancer Discov. 2, 401–404 [DOI] [PMC free article] [PubMed] [Google Scholar]
Associated Data
This section collects any data citations, data availability statements, or supplementary materials included in this article.