

Abstract
Atrazine [6-chloro-N-ethyl-N′-(1-methylethyl)-1,3,5-triazine-2,4-diamine] is the most widely used herbicide in the United States. In recent years, there has been controversy about atrazine’s potential endocrine/reproductive and neurological adverse effects in wildlife and humans. The controversy triggered several environmental and epidemiologic studies, and it generated needs for sensitive and selective analytical methods for the quantification of atrazine, atrazine metabolites, and degradation or hydrolysis products. We developed a two-dimensional high performance liquid chromatography (2D-HPLC) method with isotope dilution tandem mass spectrometry detection to measure atrazine in urine, along with 11 atrazine metabolites and hydrolysis products, including 6-chloro (Cl), 6-mercapto (Mer) and 6-hydroxy (OH) derivatives, and their desethyl, desisopropyl and diamino atrazine analogs (DEA, DIA and DAA, respectively). The 2D-HPLC system incorporated strong cation exchange and reversed phase separation modes. This versatile approach can be used for the quantitative determination of all 12 compounds in experimental animals for toxicological studies. The method requires only 10 μL of urine, and the limits of detection (LODs) range from 10 to 50 μg/L. The method can also be applied to assess atrazine exposure in occupational settings by measurement of 6-Cl and 6-Mer analogs, which requires only 100 μL of urine with LODs of 1–5 μg/L. Finally, in combination with automated off-line solid phase extraction before 2D-HPLC, the method can also be applied in non-occupational environmental exposure studies for the determination of 6-Cl and − 6-Mer metabolites, using 500 μL of urine and LODs of 0.1–0.5 μg/L.
Keywords: Atrazine, 2D-HPLC, Mass spectrometry, Urine, Herbicide
1. Introduction
Atrazine (6-chloro-N-ethyl-N′-(1-methylethyl)-1,3,5-triazine-2,4-diamine, ATZ) is a widely used herbicide with total use in the United States reaching 30,000–37,000 metric tons per year [1]. In recent years, the frequent detection of ATZ and its degradation products in water supplies and concerns about ATZ potential endocrine/reproductive and neurological effects in wildlife and humans triggered several environmental and epidemiologic studies for assessment of possible human health hazards of ATZ and other triazine pesticides [1–3].
According to the latest updates, ATZ at the current regulated environmental levels does not pose health risks to humans [4–6]. Controversy remains, however, about regulation of ATZ levels in raw water, currently set at 37.5 μg/L from a 90-day running average [1]. ATZ has a relatively long half-life in neutral aqueous media (60–100 days), it is not strongly absorbed by soil, and it can be transported long distances in surface waters from its point of application [5,7].
ATZ in humans is metabolized by dealkylation to desethylatrazine (DEA), desisopropylatrazine (DIA) and diaminoatrazine (DAA) and by glutathione conjugation followed by conversion to mercapturic acid derivatives leading to ATZ-Mer, DEA-Mer, DIA-Mer and DAA-Mer [4]. ATZ also can be metabolized to the corresponding hydroxyl derivatives (ATZ-OH, DEA-OH, DIA-OH and DAA-OH) in plants and soil bacteria [4]. From ATZ-OH, liver enzymes can produce other desalkyl OH analogs of desethyl hydroxy atrazine (DEA-OH), desisopropyl hydroxy atrazine (DIA-OH), and diamino hydroxy atrazine (DAA-OH) [8].
The estimation of human exposure to such environmental chemicals as ATZ, based on environmental monitoring, can be supplemented by biological monitoring (biomonitoring), i.e., the assessment of internal dose levels, derived from quantitative measurements of ATZ and its metabolites in human body fluids such as urine. Developing a selective and sensitive method to measure simultaneously trace concentrations of Cl, Mer, and OH ATZ metabolites in a biological matrix is an analytical chemistry challenge. Concentrations of the relatively volatile Cl-derivatives can be quantified by gas chromatography/mass spectrometry (GC/MS) detection [8–10]. However, the GC/MS methodology for measuring DAA in biological matrices is not selective enough to eliminate signal interferences from urinary components [11]. By contrast, simultaneous determination of Cl, Mer, and OH derivatives has been more successful with high performance liquid chromatography (HPLC) coupled with atmospheric pressure chemical ionization (APCI) tandem mass spectrometry (MS/MS) detection [8,12–14]. In these studies, ATZ and its metabolites are separated from each other and from other matrix components either by reversed-phase (RP) [8,12,13] or strong cation exchange (SCX) chromatography [13,14]. Neither of these HPLC modes by itself allows the separation of the full panel of ATZ metabolites that includes DAA, DAA-Mer and DAA-OH.
Here, we present an integrated method alternative that uses on-line two-dimensional (2D) HPLC with SCX and RP chromatography columns in one integrated HPLC system and coupled with isotope dilution tandem mass spectrometry detection (MS/MS). With direct injection of diluted urine samples, the 2D-HPLC–MS/MS method has 2.5–5 μg/L limit of detection (LOD), sufficient sensitivity to be used for animal toxicological and occupational health studies. With pre-purification and -concentration by off-line solid phase extraction (SPE), the overall method LOD was 0.1–0.5 μg/L in 500 μL urine, and it can be used for assessing non-occupational exposure to ATZ.
2. Materials and methods
2.1. Preparation of standard spiking solutions and quality control (QC) materials
Methanol, formic acid, ammonium hydroxide (Fisher Scientific, Pittsburgh, PA), and ammonium acetate (Sigma–Aldrich, St. Louise, MO) were all HPLC-grade. Calibration standards and their isotope-labeled analogs were purchased from ChemService (West Chester, PA) and Cambridge Isotope Laboratories (Andover, MA), and EQ Laboratories (Augsburg, Germany). The analytes chemical structures and abbreviations are shown in Fig. 1. Internal standards for ATZ, ATZ-OH, DEA, and DIA were labeled with 2H5-ethyl and/or 2H6-isopropyl groups. Mer derivatives were labeled with a 13C4-cystein group. DAA, DAA-OH, and DEA-OH were labeled with 13C3-triazine rings. For DIA-OH, the only analyte without isotope-labeled analog, 13C3-DEA-OH was used as internal standard.
Fig. 1.

Definition of abbreviations used for atrazine derivatives with different 1-X, 3-amino-R1 and 5-amino-R2 substitutions on the triazine ring.
We prepared standard stock solutions by dissolving or diluting the commercially available standards in methanol. Nine working standard solutions containing all analytes were prepared by serial dilutions in 1:1 (v/v) methanol/water to 5–2500 μg/L final concentrations. A 20- μL spike covered a range of 0.1–50 ng/sample amount for each analyte. All 13C- and 2H-labeled derivatives were prepared in methanol from the solid neat materials and were diluted and mixed to provide a 1250 μg/L working internal standard solution. A 20- μL spike provided a concentration of 25 ng/sample of each stable isotope analog. All stock solutions and standards were aliquoted in amber glass vials and stored at or below −20°C.
A natural urine pool, made from multiple collections from anonymous donors, was divided into sub-pools. One sub-pool was used as a blank quality control (QC) and also used for preparing spiked samples series for method validation purposes. The LODs were calculated using standards spiked into blank urine. When spiked into blank urine, the calculated intercept/slope values were all below the statistically calculated LODs, indicating that the blank pool did not contain ATZ or ATZ metabolites. Additional sub-pools were enriched as needed with analytes at concentrations of 1, 2.5, 5, 10, 50, 100, 500 and 1000 μg/L. The QC pools were dispensed into smaller aliquots and stored at −20°C until used.
2.2. Sample preparation by automated off-line solid phase extraction (SPE)
In a 96-well plate (2 mL square well, Varian, Lake Forest, CA), 500 μL aliquots of urine and QCs were spiked with 20 μL internal standard solution. Reagent blanks and calibration standards were prepared by adding internal/calibration solutions and water to each well. Then the 96-well plate was placed on a TOMTEC Quadra3 automated SPE station (Hamden, CT). Urine samples, reagent blanks, and calibration standards were processed by use of the same automated procedure. A 96-well format cartridge bed (60 mg Strata XC polymeric SCX packing with 1.5 mL liquid space, Phenomenex, Torrance, CA) was conditioned with 2 × 430 μL of HPLC-grade methanol and 2 × 430 μL of 2% formic acid in water. Several of the analytes were acid-labile (see below). Therefore, to minimize their exposure to acidic media, 2 × 430 μL of 2% formic acid in water was added to each sample well and pipette-mixed twice right before loading the urine onto the SPE cartridge. After sample loading (6 × 310 μL), the cartridges were washed with 2 × 430 μL of 2% formic acid in 20% MeOH. The analytes were eluted with 3×400 μL of 2% NH4OH in 80% MeOH. The SPE extracts were evaporated to ∼20 μL under a stream of dry nitrogen (UHP grade) at 50 °C in a Turbovap 96 concentration workstation (Caliper Life Sciences, Hopkinton, MA). The pH in the remaining volume after evaporation was determined to be in the range of pH 5–6. At this pH range, the evaporated SPE extracts could be stored at or below 10 °C up to 4 days without detectable degradation (see below). The evaporated SPE extracts were reconstituted only right before the injection into the HPLC system by use of the Agilent 1100 HPLC autosampler (Agilent Technologies, Wilmington, DE), programmed to add 80 μL 1% formic acid in water to each SPE extract.
2.3. Two-dimensional HPLC
The 2D-HPLC system was constructed in-house by use of Agilent 1100 modules (Agilent Technologies), specifically two quaternary pumps (Pump I and II) with degassers, one autosampler, three external ten-port switching valves (Valve I, II, and III), and one column compartment with a six-port valve (Valve D). A schematic tubing diagram is shown in Fig. 2. A high-pressure mixing Tee was also incorporated between Valves II and III to allow for in-line mixing with an aqueous 0.5% formic acid flow provided by an isocratic pump, Pump III (Thermo Scientific, San Jose, CA); Pump III was turned on/off from the autosampler by contact closure circuits. The solvent gradients, switching valves movements, and contact closures were controlled by the Chemstation software (Agilent Technologies). The HPLC and MS systems were operated from separate computers, and they communicated only through a contact closure circuit.
Fig. 2.
Tubing connection diagram with a cascade of three two-position (1–2 and 1–10) ten-port valves. Each valve holds a different HPLC column; Valve I: SCX-t trapping column; Valve II: SCX-a analytical column; Valve III: RP-a analytical column. Each valve in 1–2 position allows the flow from Pump I (1.0 mL/min), while in 1–10 position allows the flow from Pump II (1.0 mL/min) through the corresponding HPLC column.
We used three HPLC columns (Phenomenex, Torrance, CA): Luna SCX 5μm (30 mm × 4.6 mm), Gemini C6-Phenyl RP 5μm (100 mm × 4.6 mm), and Luna SCX 5μm (100 mm × 4.6 mm). These three columns are labeled as SCX-t, RP-a, and SCX-a, respectively, in Fig. 2. Each valve was connected to a different HPLC column (Valve I to the SCX-t SPE column; Valve II to the SCX-a analytical column; and Valve III to the RP-a analytical column). For each valve, the 1–2 position allowed the flow from Pump I, while the 1–10 position allowed the flow from Pump II through the corresponding HPLC column.
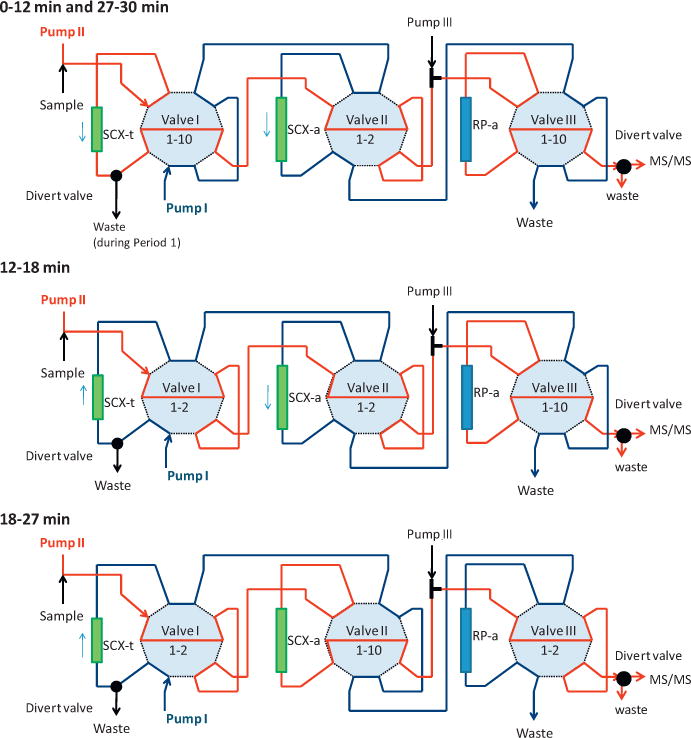
The HPLC separation can be divided into five periods. During these periods, simultaneous processes took place on the SCX-t, the RP-a, and SCX-a columns facilitated by different combinations of the switching valve positions (Fig. 3), and by the solvent gradient programs running concurrently on the two quaternary pumps. The description of the events that took place during each period follows. Period 1 (0–8 min): loading of the sample and transfer of the Cl ATZ metabolites from SCX-t to RP-a column (5–30% methanol gradient at pH 2.5), and concurrent equilibration of the SCX-a column (50% methanol at pH 6). Period 2 (8–12 min): transfer of the Mer ATZ metabolites from SCX-t to RP-a column, and concurrent RP separation of the Cl ATZ metabolites on the RP-a column (30–50% methanol gradient at pH 2.5–3.5). Period 3 (12–18 min): transfer of the OH ATZ metabolites from SCX-t to SCX-a column (60% methanol and pH 4–6 gradient), and concurrent RP separation of the Cl ATZ and Mer ATZ metabolites on the RP-a column (50–80% methanol gradient at pH 3.5–5). Period 4 (18–27 min): separation of the OH ATZ metabolites on the SCX-a column (50% methanol and pH 4–6 gradient), and concurrent regeneration and equilibration of the SCX-t and RP-a columns (60–100% methanol and pH 4–10, then 5% methanol at pH 2.5). Period 5 (27–30 min): system equilibration to initial conditions for the next sample injection.
Fig. 3.

Separation periods and concurrent loading/elution processes on the SCX-t SPE column, on the RP-a reversed phase analytical column, and on the SCX-a analytical column. Dual color indicates mixing of flows from two pumps.
The pH and methanol gradients with 1.0 mL/min flow rate were produced by mixing of 0.5% formic acid (A), 20 mM ammonium acetate (B), 100% methanol (C), and 0.1% ammonium hydroxide in methanol (D), pumped by each of the two quaternary pumps. During the first 12 min, 0.5% formic acid was pumped into the mixing-T with 0.2 mL/min. Chemstation time tables are provided in Supplementary information. The pH was estimated based on measurements in mixtures of A/B/C on a pH meter.
2.4. Mass spectrometry
A TSQ Quantum Ultra MS/MS instrument (Thermo Scientific) was used in positive ion APCI mode with the following settings: discharge current 4.5μA, vaporizer temperature 400 °C, sheath gas pressure 25 (arbitrary units), auxiliary gas pressure 5 (arbitrary units), capillary temperature 260 °C, collision pressure 1.5 mTorr. Tube lens offset and collision energy were optimized for each analyte. All channels were monitored with a 100 ms dwell time adding up to 1–2 s cycle times in segments. Precursor and product ions were selected for quantification/confirmation (Table 1) after taking into consideration signal-to-noise and relative absence of interferences. The selected fragment ions agreed with MS/MS fragmentation patterns observed by others [12].
Table 1.
Precursor and product ion masses (m/z) used for selective ion monitoring and quantification of atrazine derivatives.
| Analyte | Abbreviation | Precursor ion (M+H)+ (m/z) | Product ion (confirmation ion) (m/z) | Retention time (min) |
|---|---|---|---|---|
| Desalkyl atrazine (diaminochlorotriazine) | DAA 13C3-DAA |
146 149 |
79 (110) 113 |
4.1 |
| Desisopropyl atrazine | DIA 2H5-DIA |
174 179 |
79 (104) 101 |
8.4 |
| Desethyl atrazine | DEA 2H6-DEA |
188 194 |
104 (146) 147 |
10.3 |
| Atrazine | ATZ 2H11-ATZ |
216 221 |
174 (104) 179 |
15.6 |
| Desalkyl atrazine mercapturate | DAA-Mer 13C4-DAA-Mer |
273 277 |
102 (144) 102 |
12.9 |
| Desisopropyl atrazine mercapturate | DIA-Mer 13C4-DIA-Mer |
301 305 |
172 (102) 172 |
13.21 |
| Desethyl atrazine mercapturate | DEA-Mer 13C4-DEA-Mer |
315 319 |
186 (144) 186 |
13.61 |
| Atrazine mercapturate | ATZ-Mer 13C3-ATZ-Mer |
343 346 |
214 (172) 217 |
15.69 |
| Desalkyl atrazine hydroxide | DAA-OH 13C3-DAA |
128 | 86 (69) | 23.5 |
| Desisopropyl atrazine hydroxide | DIA-OH | 156 | 86 (69) | 23.8 |
| Desethyl atrazine hydroxide | DEA-OH 13C3-DEA-OH |
170 173 |
128 (86) 131 |
23.5 |
| Atrazine hydroxide | ATZ-OH 2H5-ATZ-OH |
198 203 |
156 (86) 161 |
23.9 |
2.5. Design of experiments (DOE) optimization
To evaluate the main eluent parameters that determined the off-line SPE clean-up and the MS/MS detection performance, we designed experiments using the JMP 7.0.2 Statistical Discovery software (SAS Institute Inc., Cary, NC). The fractional factorial DOE-screening designs included one center point with one or two pairs of duplicates. For each analyte, the evaluation of the effect screening or surface response data were performed on the basis of deviation from the mean response (contrast), expressed in percentage of the best measured response for each parameter.
2.6. Method validation
We validated the 2D-HPLC–MS/MS method using 10 μL, 100 μL, and 500 μL urine aliquots to accommodate the concentration range and sensitivity needs required for animal toxicology, occupational, and non-occupational studies, respectively. For animal and occupational studies, we diluted the urine samples 10× and 2×, respectively, and injected 10 μL of the dilute directly into the 2D-HPLC system (injections contained 1 μL and 5 μL urine, respectively). On the other hand, for non-occupational studies, 500 μL of urine was pre-concentrated by use of off-line SPE in ∼20 μL extract volume after evaporation, which was reconstituted with 1% formic acid to ∼100 μL. Into the 2D-HPLC system 10 μL of the extract was injected (equivalent of ∼50 μL of the original urine aliquot). The differences in the three application modes are summarized in Table 2.
Table 2.
Summary of method differences depending on application.
| Study application | Concentration range (μg/L) | Urine volume (μL) | Sample prep. | Sample in 10 μL injection | Target analytes |
|---|---|---|---|---|---|
| Non-occupational exposure | 0.25–50 | 500 | Off-line SPE 500 μL sample | ~50 μL urine | ATZ, DEA, DIA, DAA, ATZ-Mer, DEA-Mer, DIA-Mer |
| Occupational exposure | 2.5–500 | 100 | Dilution 2× | 5 μL urine | All 12 except DAA-Mer |
| Animal toxicology | 10–5000 | 10 | Dilution 10× | 1 μL urine | All 12 analytes |
The ng/sample content of the calibration standard series was the same regardless of urine amount, dilution or off-line SPE, 0.1–50 ng/sample in 20 μL. After dilution with water as needed to replace the volume of the urine aliquots, the calibration standards were either directly injected or SPE processed and then injected like the urine samples. The only time we spiked the calibration standards into blank urine instead of water was when we determined the LODs and measured spiked concentration measurement accuracies. In these cases, concentrations were calculated with calibration curves prepared in water.
We calculated the statistical LOD from quintuplicate measurements of standards spiked into blank urine. The lowest standard concentration was equal or lower than the LOD in Table 2. The statistical LOD was calculated according to the following formula: LOD = meanblank + 1.645 Stdevblank + 1.645 StdevLOD [15], where StdevLOD = slope × CLOD + intercept. The slope and intercept were determined from linear correlation trendline in the Stdev vs. concentration graphs for the near-LOD concentration range.
The QC pools were characterized by calculating the mean and the 95% and 99% control limits from 15 inter-day measurements of duplicates for each analyte. For the characterization of the spiked QC pools we used solvent-based calibration standards (only buffer and internal standards); the same way as for the measurement of unknown urine samples.
3. Results and discussion
3.1. 2D-HPLC–MS/MS method design
The gathering of theoretical and experimental information about the ionization of the analytes in the APCI LC–MS interface, and the characterization of chromatographic behavior on the SCX and RP stationary phases were essential to the effective conducive design of this 2D-HPLC–MS/MS method. Without the information we provide in Supplementary information, the optimization of concurrent quaternary pump gradient programs, tubing configurations (Fig. 2) and time tables (Fig. 3) would have been a hopeless “game of try and error”.
We found that one important parameter affecting the MS ionization was the total concentration of formic acid/formate indicating that the presence of sufficient concentration of formic acid in the gas phase was the most important mobile phase variable affecting the ionization of ATZ derivatives. Another important factor in the ionization of the ATZ metabolites was the degree and stability of vaporization temperature in the APCI probe, especially in case of the first eluting metabolites DAA and DIA.
Retention time and peak width data on the SCX and RP columns were generated through a series of isocratic mobile phase conditions. While the different N-desalkylated forms of Cl and Mer ATZ metabolites separated only on the RP column, the desalkylated OH metabolites separated only on the SCX column. On the SCX column at pH 4–7, the Mer analogs eluted as sharp peaks from the SCX column, but the OH analogs eluted with broad peaks. To produce sharp peaks for the OH derivatives on the SCX column, we had to increase the pH above 7 with addition of 0.1% ammonium hydroxide. We also found that increasing the methanol content increased the separation between Mer and OH metabolites on the SCX column.
On the basis of theoretical predictions and the experimental observations, we designed a 2D-HPLC time table as follows (Fig. 3): first, all ATZ metabolites from the urine matrix were captured on a SCX column (SCX-t). Then, the Cl and Mer analogs were eluted from the SCX-t column and sent to a reversed phase column (RP-a) for analytical separation. Last, the OH analogs were eluted from the SCX-t column to the second SCX-a column.
First the pH gradient on the SCX-t column was optimized to achieve the elution of the Cl and Mer metabolites from the OH metabolites in separate retention time intervals, 0–12 min and 12–18 min, respectively. After the optimal pH gradient was found, the methanol content of the eluent was optimized to achieve optimal separation of desalkylated Cl and Mer metabolites on the analytical RP-a column. Finally, the separation of the OH derivatives on the SCX-a column was optimized from 18 to 27 min by increasing the 0.1% ammonium hydroxide and methanol content in the mobile phase. The separation of the metabolites not only from each other, but also from endogenous urine interferences was further enhanced by T-mixing of 0.5% formic acid between the SCX-t column and the RP-a column (Fig. 2).
The MS/MS chromatograms, collected on the SCX-t column by use of the final gradient (without analytical columns), are shown in Fig. 4A. A chromatogram of a 50 μg/L spiked urine sample obtained with the complete column switching system is shown in Fig. 4B.
Fig. 4.

MS/MS chromatograms collected from a 50 μg/L spiked urine sample by connecting the mass spectrometer after the SCX-t SPE column without analytical columns (A), and by connecting the MS instrument after the analytical columns with the final 2D-HPLC–MS/MS method (B).
3.2. Optimizing the automated off-line solid phase extraction
For the off-line SPE purification and pre-concentration, we selected a mixed mode SCX/RP packing. As reported previously [14], with this combined SCX/RP phase we achieved better separation from interferences for DAA than with using other divinylbenzene, N-vinylpyrrolidone, or conventional C18 bonded silica phases. The effect contrasts plot (Fig. 5), measured by the MS/MS signal intensity, showed that either the urine matrix or methanol in the wash affected negatively the MS/MS signal intensity of DAA and DIA compared to the other analytes. There was also a clear effect of 1–5% ammonium hydroxide in the eluent, which negatively affected the Cl derivatives but affected positively the Mer/OH ATZ metabolites. Finally, methanol in the eluent with 50–100% concentration had no significant effect on DAA signal intensity, but it improved MS/MS signal recovery for all other analytes. These parameter effects on MS/MS signal intensities can be interpreted as effects either on gas phase ionization efficacy or on SPE recovery. On the basis of these DOE data, we selected the final conditions of the off-line SPE, as described in Section 2.
Fig. 5.

Analyte-specific effect of the solid phase extraction parameters on MS/MS signal intensity using fractional factorial experimental design. Parameter effect contrasts expressed in percent of maximum signal intensity found for each analyte.
3.3. Matrix effects and limit of detection
The LODs are reported both in ng/sample and μg/L sample concentration units in Table 3. LODs were in the 0.1–1 ng/sample range for most of the analytes, regardless of the amount of urine used, suggesting that the 2D-HPLC system was able to separate these analytes from the endogenous matrix components and reduce matrix effects. However, the amount of urine or urine extract injected into the HPLC system did affect the ng/sample LOD of three important metabolites: DAA, DAA-Mer and DAA-OH. The presence of the urine matrix strongly affected the ionization of DAA. Therefore, we were able to detect DAA at concentrations <1 μg/L (relevant for non-occupational exposures) only by using off-line SPE before the 2D-HPLC–MS/MS analysis. At higher than 1 μL urine on column, the amount of urine strongly affected the recovery of DAA-Mer on the SCX-t trapping column, and compromised the quantitation of DAA-OH by the presence of an interfering endogenous urine component. Therefore, we were only able to quantify DAA-Mer and DAA-OH at higher concentrations, when we injected up to only 1 μL urine (animal toxicology scenario). The relatively high statistical LOD for DIA-OH (0.5–2.5 ng/sample) can be explained by the lack of an isotope-labeled internal standard for this compound.
Table 3.
Limit of detection determined by using 5× pre-concentrated urine extract after offline SPE, and direct injection of 2× diluted urine and 10× diluted urine, equivalent of 50 μL, 5 μL and 1 μL urine injected into the 2D-HPLC–MS/MS system, respectively.
| Analyte abbreviation | LOD ng/sample (μg/L)
|
||
|---|---|---|---|
| 5× pre-conc. urine | 2× dil. urine | 10× dil. urine | |
| DAA | 0.25 (0.5) | 0.5 (5) | 0.1 (10) |
| DIA | 0.1 (0.25) | 0.25 (2.5) | 0.1 (10) |
| DEA | 0.1 (0.25) | 0.25 (2.5) | 0.1 (10) |
| ATZ | 0.25 (0.5) | 0.1 (1) | 0.1 (10) |
| DAA-Mer | – | – | 0.1 (10) |
| DIA-Mer | 0.05 (0.1) | 0.5 (5) | 0.1 (10) |
| DEA-Mer | 0.05 (0.1) | 0.5 (5) | 0.1 (10) |
| ATZ-Mer | 0.25 (0.5) | 0.25 (2.5) | 0.1 (10) |
| DAA-OH | 1.25 (2.5) | 0.5 (5) | 0.5 (50) |
| DIA-OH | 2.5 (5) | 2.5 (25) | 0.5 (50) |
| DEA-OH | 0.25 (0.5) | 0.5 (5) | 0.25 (25) |
| ATZ-OH | 0.5 (1) | 1 (10) | 0.25 (25) |
The method accuracy was assessed by five replicate analyses of spiked urine. At levels around 3×the LODs, spiked standard accuracies in urine ranged from 86%to 108%, with deviations of <20%.
3.4. Characterization of quality control materials
We used spiked and stored aliquots of QC materials with concentrations ranges of 1–1000 μg/L to assess inter-day variability (Table 4). The concentration range of these QC materials covered the range of all application scenarios. After preparing with appropriate dilution or off-line SPE pre-concentration (Table 2), the concentrations of the QCs were calculated with the same response ratio vs. 0.1–50 ng/sample calibration curve (prepared in water without urine). For the 500 and 1000 μg/L QCs, the coefficient of variation (CV) was 5–19% indicating good precision for all 12 analytes. For the 50 and 100 μg/L QCs, CVs were 7–26% for most analytes, except for DAA-OH. For the 10 μg/L QC, we were able to measure accurately all Cl derivatives and Mer analogs with 13–26% CVs μg/L, except for DAA and DAA-Mer. For the 1–10 μg/L QCs, we were able to measure accurately with 6–26% CV all the Cl and the Mer metabolites including DAA (the most frequently detected metabolite), but not DAA-Mer.
Table 4.
Precision, assessed by coefficient of variations (%CVs), of inter-assay measurements in QC urine pools.
| Application Concentration range Sample volume | Non-occupational exposure 0.1–50 μg/L 500 μL
|
Occupational exposure 2.5–500 μg/L 100 μL
|
Animal toxicology 10–5000 μg/L 10 μL
|
|||||
|---|---|---|---|---|---|---|---|---|
| Quality control (μg/L) | 1 | 2.5 | 10 | 10 | 50 | 100 | 500 | 1000 |
|
|
||||||||
| Analyte | %CV (n = 15) | %CV (n = 15) | %CV (n = 15) | |||||
| DAA | 24 | 21 | 16 | a | 19 | 16 | 14 | 8 |
| DIA | 16 | 17 | 6 | 22 | 18 | 17 | 9 | 9 |
| DEA | 12 | 17 | 6 | 13 | 12 | 12 | 9 | 9 |
| ATZ | 26 | 20 | 19 | 23 | 16 | 14 | 14 | 13 |
| DAA-Mer | a | a | a | a | 26 | 22 | 19 | 12 |
| DIA-Mer | 23 | 23 | 19 | 26 | 21 | 18 | 11 | 5 |
| DEA-Mer | 25 | 12 | 4 | 18 | 13 | 12 | 10 | 6 |
| ATZ-Mer | 20 | 12 | 23 | 13 | 7 | 11 | 11 | 5 |
| DAA-OH | a | a | a | a | a | 22 | 13 | 13 |
| DIA-OH | a | a | a | a | 26 | 20 | 21 | 16 |
| DEA-OH | a | a | a | a | 14 | 11 | 10 | 5 |
| ATZ-OH | a | a | a | a | 21 | 12 | 12 | 7 |
>26%CV.
3.5. Sample stability
We spiked DAA, DIA, DEA, ATZ, ATZ-Mer, and ATZ-OH into urine aliquots, acidified by adding 99% formic acid (1% in urine), and monitored the analytes concentrations for 4 days (Fig. 6). We programmed the autosampler to draw 10 μL of the acidified urine, dilute it with 1% formic acid (50 μL), and spike it with internal standard immediately before injection. During the first 6 h, concentrations of DAA, DEA, DIA, and ATZ decreased by 20–30%, and we observed the appearance of their OH analogs. Interestingly, ATZ produced only ATZ-OH, but not DEA-OH, DIA-OH, or DAA-OH. These findings suggest that the acid-mediated chemical hydrolysis of ATZ is limited to dechlorination but not dealkylation. Furthermore, ATZ-Mer and ATZ-OH concentrations also decreased, but without producing the corresponding desethyl and desisopropyl derivatives. These findings have importance in the evaluation of animal toxicology data. If animals are dosed with ATZ-OH only, detection of DAA-OH, DIA-OH and DEA-OH must be a result of biological metabolism and not chemical degradation. However, after ATZ dosing, if high levels of DAA, DIA and DEA are measured, low levels of OH derivatives may be due to chemical hydrolysis in the urine samples during storage and sample cleanup.
Fig. 6.

Four-day stability study of DAA, DIA, DEA, ATZ, ATZ-Mer, and ATZ-OH in urine acidified with 1% formic acid. DAA, DEA, DIA, and ATZ hydrolyzed to their hydroxyl analogs in 4 days. ATZ, ATZ-Mer, and ATZ-OH levels decreased without producing desethyl and desisopropyl derivatives.
We repeated the same 4-day stability study without acidifying the urine. Of interest, we did not detect any degradation products during the study period. These results together suggest that, in urine, ATZ and its derivatives are stable at around neutral pH but not at acidic pH. Therefore, to ensure the stability of the analytes during the 24 h run time of a typical 48 sample batch, each sample in the batch was diluted with 1% formic acid by the autosampler immediately before injection into the 2D-HPLC system. Similarly, during off-line SPE pre-concentration, the samples were diluted with 1% formic acid only right before loading them on the SPE cartridge.
3.6. Applicability to animal toxicology and human exposure studies
The ability of measuring the full panel of atrazine derivatives by using our method has important implications in animal toxicology and human occupational exposure studies. For example, the concurrent measurement of Cl and Mer atrazine analogs in animal toxicology studies can allow assessing the relative profile of atrazine metabolism pathways, such as desalkylation (phase I) vs. mercapturate adduct formation (phase II). In case of human exposure studies, measurement of Mer metabolites can be used to evaluate exposure pathways, such as dermal contact or inhalation vs. food exposure [10]. It is well known that DAA, DIA and DEA are the main atrazine metabolites found both in animals and humans [16,17], and they are the main biomarkers at detectable levels in non-occupational biomonitoring studies [18]. In terms of the analytical performance required for biomonitoring for atrazine and its metabolites, our method sensitivity (e.g., LODs of 0.1–0.5 mg/mL using 500 μL of urine) is adequate, albeit not as high as previously reported for some analytes using other methods [13,14]. However, compared to previous methods, the method selectivity (i.e., avoiding false positives) along with its robustness and ruggedness has greatly improved.
4. Conclusion
In summary, we applied a 2D-HPLC analytical separation approach with isotope dilution MS/MS detection to measure a comprehensive metabolic panel of atrazine in urine. The implementation of the 2D-HPLC approach was a challenging undertaking because of the wide range of pKa and the polarity of the analytes. However, we achieved good sensitivity and improved selectivity with this method (i.e., 0.1–0.5 ng/sample). With the addition of automated off-line SPE for pre-purification and pre-concentration of desalkyl/mercapturic metabolites before 2D-HPLC, the analytical range is adequate to allow for the characterization of environmental atrazine exposure for risk assessment.
Supplementary Material
Appendix A. Supplementary data
Supplementary data associated with this article can be found, in the online version, at http://dx.doi.org/10.1016/j.jchromb.2012.05.028.
Footnotes
Disclaimer: The use of trade names is for identification only and does not constitute endorsement by the U.S. Department of Health and Human Services or the Centers for Disease Control and Prevention (CDC). The findings and conclusions in this report are those of the authors and do not necessarily represent the views of CDC.
References
- 1.Erickson BE. Chem Eng News. 2010;88:31. [Google Scholar]
- 2.Sathiakumar N, MacLennan PA, Mandel J, Delzell E. Crit Rev Toxicol. 2011;41:1. doi: 10.3109/10408444.2011.554793. [DOI] [PubMed] [Google Scholar]
- 3.Winchester PD, Huskins J, Ying J. Acta Paediatr. 2009;98:664. doi: 10.1111/j.1651-2227.2008.01207.x. [DOI] [PMC free article] [PubMed] [Google Scholar]
- 4.Government Document, US Department of Health and Human Services, Agency for Toxic Substances and Disease Registry. Toxicological Profile for Atrazine. 2003 [PubMed] [Google Scholar]
- 5.Web Page, U.S. Environmental Protection Agency (U.S.EPA) Cumulative Risk from Triazine Pesticides. 2006 [Google Scholar]
- 6.Web Page, U.S. Environmental Protection Agency (U.S.EPA) Atrazine Science Reevaluation: Potential Health Impacts. 2009 [Google Scholar]
- 7.Chiovarou ED, Siewicki TC. Sci Total Environ. 2008;389:87. doi: 10.1016/j.scitotenv.2007.08.029. [DOI] [PubMed] [Google Scholar]
- 8.Lucas AD, Jones AD, Goodrow MH, Saiz SG, Blewett C, Seiber JN, Hammock BD. Chem Res Toxicol. 1993;6:107. doi: 10.1021/tx00031a017. [DOI] [PubMed] [Google Scholar]
- 9.Laws SC, Hotchkiss M, Ferrell J, Jayaraman S, Mills L, Modic W, Tinfo N, Fraites M, Stoker T, Cooper R. Toxicol Sci. 2009;112:78. doi: 10.1093/toxsci/kfp190. [DOI] [PubMed] [Google Scholar]
- 10.Perry MJ, Christiani DC, Mathew J, Degenhardt D, Tortorelli J, Strauss J, Sonzogni WC. Toxicol Ind Health. 2000;16:285. doi: 10.1177/074823370001600705. [DOI] [PubMed] [Google Scholar]
- 11.Koivunen ME, Dettmer K, Vermeulen R, Bakke B, Gee SJ, Hammock BD. Anal Chim Acta. 2006;572:180. doi: 10.1016/j.aca.2006.05.037. [DOI] [PubMed] [Google Scholar]
- 12.Baglio D, Kotzias D, Larsen BR. J Chromatogr A. 1999;854:207. doi: 10.1016/s0021-9673(99)00740-2. [DOI] [PubMed] [Google Scholar]
- 13.Panuwet P, Nguyen JV, Kuklenyik P, Udunka SO, Needham LL, Barr DB. Anal Bioanal Chem. 2008;391:1931. doi: 10.1007/s00216-008-2102-0. [DOI] [PubMed] [Google Scholar]
- 14.Panuwet P, Restrepo PA, Magsumbol M, Jung KY, Montesano MA, Needham LL, Barr DB, Chromatogr J. B Analyt Technol Biomed Life Sci. 2010;878:957. doi: 10.1016/j.jchromb.2010.02.025. [DOI] [PubMed] [Google Scholar]
- 15.Armbruster DA, Pry T. Clin Biochem Rev. 2008;29(Suppl 1):S49. [PMC free article] [PubMed] [Google Scholar]
- 16.McMullin TS, Brzezicki JM, Cranmer BK, Tessari JD, Andersen ME. J Toxicol Environ Health A. 2003;66:941. doi: 10.1080/15287390306454. [DOI] [PubMed] [Google Scholar]
- 17.Timchalk C, Dryzga MD, Langvardt PW, Kastl PE, Osborne DW. Toxicology. 1990;61:27. doi: 10.1016/0300-483x(90)90004-z. [DOI] [PubMed] [Google Scholar]
- 18.Barr DB, Panuwet P, Nguyen JV, Udunka S, Needham LL. Environ Health Perspect. 2007;115:1474. doi: 10.1289/ehp.10141. [DOI] [PMC free article] [PubMed] [Google Scholar]
Associated Data
This section collects any data citations, data availability statements, or supplementary materials included in this article.