Abstract
Nurse practitioners may manage patients with coagulopathic bleeding which can lead to life-threatening hemorrhage. Routine plasma-based tests such as prothrombin time and activated partial thromboplastin time are inadequate in diagnosing hemorrhagic coagulopathy. Indiscriminate administration of fresh frozen plasma, platelets or cryoprecipitate for coagulopathic states can be extremely dangerous. The qualitative analysis that thromboelastography provides can facilitate the administration of the right blood product, at the right time, thereby permitting the application of goal-directed therapy for coagulopathic intervention application and patient survival.
Keywords: Thromboelastography, thromboelastometry, viscoelastic testing, coagulopathy, trauma, fibrinolysis, hemorrhage, thromboelastogram
INTRODUCTION
Hospitalized patients may undergo coagulopathic bleeding, which can lead to life-threatening hemorrhage. Causes of coagulopathic bleeding can be due to pathophysiologic disturbances in clotting mechanisms due to traumatic injury,1 surgery,2 liver disease,3 sepsis and severe infections,4 cancer,5 pancreatitis,4 and acute solid organ transplant rejections.6 It is important that nurse practitioners (NPs) caring for such patients can diagnose where in the clotting cascade impairment is present, so that targeted therapy can be applied precisely and rapidly to control bleeding. Thromboelastography devices such as the TEG® and RoTem® provide for point-of-care monitoring tests (the thromboelastogram is the output of the TEG®) that assesses the viscoelastic proprieties of evolving clot in the patient’s whole blood, and can provide information about fibrin formation, platelet activation, and clot retraction. With such information, the NP can arrive at the correct coagulopathic diagnosis and initiate goal-directed transfusion therapy. The purpose of this article is to demonstrate the shortcomings of routine plasma-based tests such as prothrombin time (PT) and partial thromboplastin time (PTT) in diagnosing hemorrhagic coagulopathy, and the enhanced utility of thromboelastography as compared to routine tests in providing information about targeted coagulopathic intervention application.
BACKGROUND
As a general principle, treatment of hemorrhage begins with urgent volume resuscitation in the form of crystalloids, colloids, and uncrossmatched packed red blood cells (PRBCs) owing to their ease of availability in emergency. However, because type and crossmatch of blood and thawing of component replacement factors such as fresh frozen plasma (FFP) or cryoprecipitate requires time, the initial hemorrhage resuscitation with crystalloid and colloid may result in hemodilution or dilutional coagulopathy. The use of thromboelastography at the point of care can provide timely analysis of the precise coagulation derangement, enabling the NP to provide targeted replacement therapy much more quickly, thereby preventing exacerbation of coagulopathy and progression of hemorrhage.
Coagulation Cascade
The cell-based model of the coagulation cascade7 posits an enhanced understanding of the inadequacy of routine plasma-based tests such as PT and PTT in hemorrhage resuscitation. A brief review of the coagulation cascade can aid in understanding the potential shortcomings of these tests.
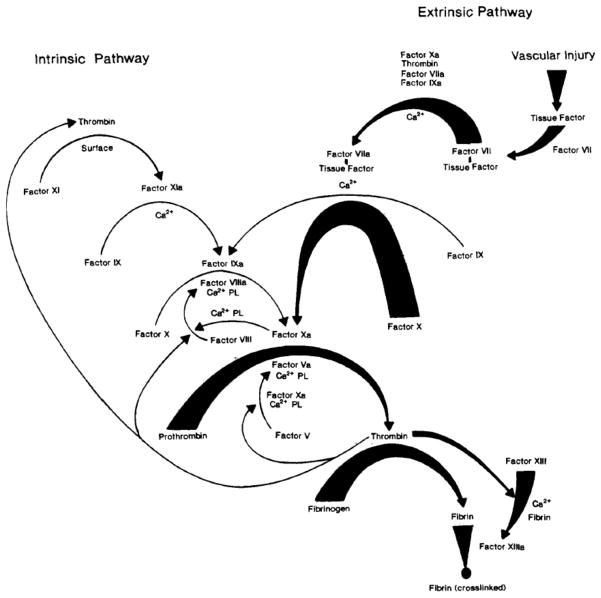
The coagulation cascade is a highly complex chain of cellular and biochemical reactions, but Figure 1 shows a simplified version, demonstrating the two cascade activation pathways. The extrinsic or tissue factor pathway is activated whenever there is tissue damage outside of the blood vessels, while the intrinsic (PTT) pathway is invoked with damage to the blood vessel. The extrinsic pathway is set in motion when tissue factor from an injured muscular endothelium activates factor VII to form factor VIIa, which, in the presence of tissue thromboplastin, activates factor X (the factor at the beginning of the common pathway). In contrast, the intrinsic pathway is set in motion when damage to the vascular surface in contact with blood activates factor XII, and continues with activated factor XIIa. It also includes factors XI and IX along with their activated factors XIa and IXa. Finally, factor VIII activates factor X, thus also arriving at the beginning of the common pathway at this point.
Figure 1.
Blood Coagulation Cascade (Copyright used with permission33)
Whether the common pathway is reached through extrinsic or intrinsic mechanisms, factor X is next activated to form factor Xa, which then combines with prothrombin (factor II) to form thrombin (factor IIa). Thrombin activates factor V to factor Va, and factor VIII to VIIIa, which serves as a positive feedback loop to increase thrombin production.8 Thrombin also acts on fibrinogen (factor I) and forms its activated form called fibrin (factor Ia). Thrombin also activates factor XIII, resulting in the cross-linking of fibrin strands. The major role of thrombin, however, is to activate platelets.9 In general, only a very small amount of thrombin is needed to convert fibrinogen to fibrin,10 but larger amounts are needed for platelet binding with the cross-linked fibrin strands to form clot.11 It is at the point of the formation of fibrin polymers where all routine coagulation tests stop their analysis. Thromboelastography is unique in that it provides information gained further into clot development, and a measure of the strength of the fibrin-platelet bonds in whole blood. Thromboelastography does so by measuring the mechanical properties of the hemostatic process, including the time taken before clot formation starts, the kinetics of the fibrin clot, the time taken to achieve maximum strength of the clot, and the final strength and stability of the clot.
OPERATING PRINCIPLES OF THE VISCOELASTIC TEST ANALYZER
Thromboelastography analyzers, such as the TEG®, consist of a torsion wire, a pendulum, and a cup to hold the sample of whole blood as shown in Figure 2. A small (0.36 ml) citrated whole blood sample is placed into the cup along with calcium chloride, kaolin, and phospholipid (which activates the intrinsic pathway) and heated to 37° C. The cup is rotated at a 4° 45′ arc, six times a minute, back and forth, imitating the sluggish blood flow in the venous circulation, for the entire duration of the test. A stationary pin attached to the torsion wire is inserted into the cup, and as fibrin begins to form it attaches to the pin, with subsequent fibrin-platelet binding dragging on the pin. The mechanical energy of the clot is transduced into an electrical current and is analyzed by a computer, which produces a split symmetrical reaction curve whose magnitude is directly proportional to the strength of the clot formed over time.
Figure 2.
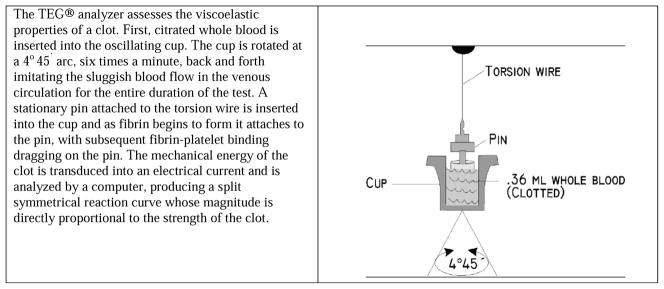
Thromboelastogram (TEG®) Analyzer (Copyright used with permission34)
THROMBOELASTOGRAPHY INTERPRETATION FOR DIAGNOSIS AND MANAGEMENT
Although the thromboelastograpy devices on the market are similar in terms of the variables measured, they vary in their nomenclature, variable definitions and ranges of their output. 12 For simplicity, we concentrate on explaining the output of one device—the TEG®. The visual output of the TEG® is the split symmetrical reaction curve which is generated by plotting time on the horizontal axis, and amplitude or strength of the clot on the vertical axis. There are 6 major values obtained from the resulting plot. The R time, K time, and α or the angle, measure fibrin contribution to clot formation. The maximum amplitude (MA), G value, and percentage of lysis after 30 minutes called LY30 measure the platelet contribution.
Reaction Time, R time or R
R indicates the time from the test start (blood sample placed into the analyzer) until the start of the clot or fibrin formation. Normal R values range between 7.5 and 15 minutes. In hemorrhaging patients, the R time could either be prolonged or shortened. Prolongation of the R time can occur due to hemodilution, the release of endogenous heparin due to tissue breakdown, or a deficiency in coagulation factors.13 Although thromboelastography does not provide information about the specific coagulation factor which is deficient, the treatment for prolonged R time is to administer FFP. This is because FFP contains all factors of the coagulation cascade, and can also replace volume without further coagulant hemodilution.14
A shortening of R time, usually considered <3 minutes, occurs in hypercoagulable states. Examples would be patients with early disseminated intravascular coagulation (DIC) or septicemia.15 In these situations, free thrombin is released into the circulating blood, triggering the clotting mechanisms and causing hypercoagulation. The patient later begins to bleed because of exhaustion of clotting factors. Thus, treatment with an anticoagulant to slow or reverse the inappropriate clotting would be beneficial.16
Kinetic Value, K value or K
This is the time taken to achieve a certain level of clot strength, identified by the time taken to reach amplitude of 20 mm. As such, this value indicates fibrin kinetics or the speed of clot formation, and indicates the speed of the bond formation between fibrin and platelets. It begins from the point where the R time ends, to the point on the plot where the amplitude reaches 20 mm. Normal K values range between 3 and 6 minutes.
α Value or angle
This is a measure of the speed at which fibrin builds up and cross-linking occurs, assessing the rate of clot formation. This angle is obtained by drawing an imaginary tangential line from the point where the symmetrical curve splits into two to the ending point of the K value. Since this measure is related to the fibrin-platelet interaction and cross-linking, it is also a measure of functional fibrinogen.17 Normal α value is between 45° and 55°.
Similar to R, K values can either be prolonged or shortened in hemorrhaging patients. As shown in Figure 3, a longer K value causes a shallow or more acute angle (<45°), while a shorter K value causes a steeper α angle (>45 °). Prolongation of the K value indicates that there is delayed time of formation of the clot, suggesting inadequate amounts of fibrinogen to form fibrin when seen in the presence of adequate platelet counts. The treatment for prolonged K value is therefore to administer fibrinogen.18 An α <45° suggests a less vigorous association of fibrin with platelets. In this case, treatment begins much higher on the coagulation cascade, with the replacement of both fibrinogen and factor VIII. Thus, these patients can be treated with the administration of cryoprecipitate.13,19
Figure 3.
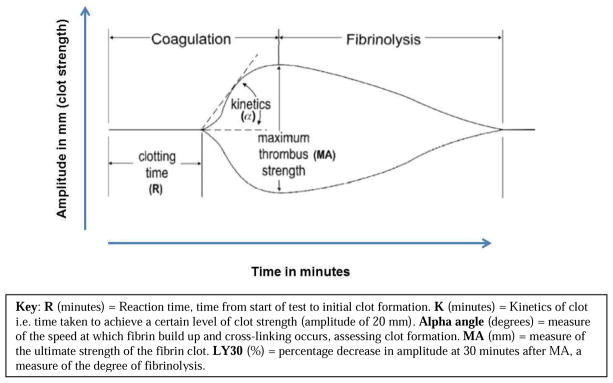
The thromboelastogram (TEG®) graph demonstrating the development of clot and clot strength over time. (Copyright used with permission34)
Shortening of the K-value indicates a very quick formation of clot, potentially due to hypercoagulability or inappropriate consumption of coagulation factors as described above. A shortened K value also corresponds to a steeper α (>45°). The treatment for shortened K and steeper α is anticoagulation therapy.20
The next parameters provided by TEG® assay measure the platelet contribution to clot formation.
Maximum Amplitude (MA)
This is the width of the tracing representing the overall maximum attainable clot strength. As the clot develops and increases in tensile strength due to platelet activation and binding to fibrin, the tracing increases it’s MA or appears to widen. Normal values are between 50–60 mm. Hemorrhaging patients can present with either high MA indicating a strong clot, or low MA indicating weak clot strength. High MA will occur in the setting of hyperactivity of platelets, and MA above 75 mm indicates a prothrombotic state.21 In this case, treating with an anticoagulant would be helpful. In contrast, a low MA occurs either due to hypofibrinogenemia, or poor or decreased platelet functioning and quality. It is possible for a patient to have decreased platelet function in the face of a normal platelet count, such as with liver disease, use of aspirin and other nonsteroidal anti-inflammatory drugs, and uremia.22 The preferable treatment for low MA includes transfusion of platelets to improve hemostatic conditions. Since platelets also contain significant amounts of plasma, transfusing platelets can also aid in releasing fibrinogen, which will in turn improve R time.23 The use of desmopressin (DDAVP) has also been suggested for mild dysfunction of MA.24 This is because the use of DDAVP increases the release of factor VIII, acting much higher on the coagulation cascade, leading ultimately to platelet activation.
Shear Elastic Modulus Strength, G-value or G
G is a measure of clot strength or clot firmness, and is calculated based on the amplitude value (A) until the maximum amplitude (MA) is reached. It is the single most important value of the entire assay because it represents the overall function or effectiveness of the clot. Normal G values are between 5.3 and 12.4 dynes/cm2. A G value >10 dynes/cm2 indicates increased risk of thrombosis.25 Treatment for high G is accomplished by the use of platelet inhibitors such as Clopidogrel or Aspirin. Aspirin is usually not preferred because it inhibits platelet adherence rather than platelet aggregation. A G <5 dynes/cm2 places a patient at increased risk of hemorrhage.26
Clot lysis
As time progresses during the TEG® assay, the tracing will remain at maximal amplitude for a period of time, after which clot lysis begins. Normally, lysis continues for a period of up to 15 minutes. A computerized algorithm automatically estimates the percentage of lysis occurring over time, using the information derived during the first 15 minutes of the lysis. This is called the Estimated Percentage of Lysis or EPL. After 30 minutes, EPL becomes EPL30 or succinctly LY30 (i.e. percentage of lysis at 30 minutes). Both the EPL and LY30 are measurements of excessive fibrinolysis since they measure the percentage decrease in amplitude after MA.27 An EPL between 7.5 and 15%, when accompanied by a very high G, reflects a hyperfibrinolytic and hypercoagulable state typical of patients with early DIC.28 A very high EPL or LY30 (>20%) may indicate the need for antifibrinolytic therapy, such as the use of transexamic acid29 or aminocaproic acid.30
Multiple abnormal values
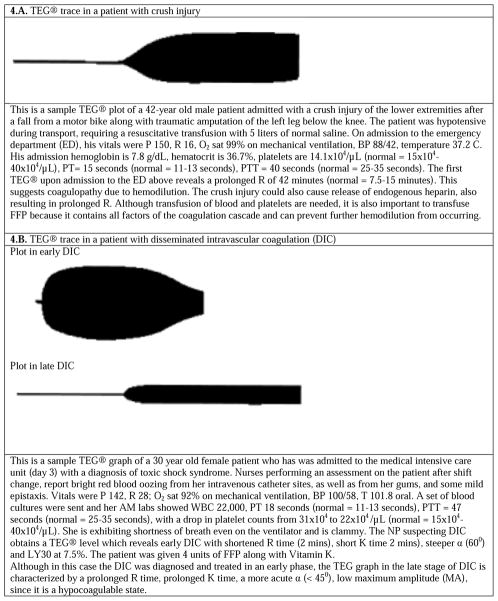
As long as hemorrhaging patients demonstrate alteration in only one of the TEG® parameters, the treatment strategies are straightforward. However, there may be clinical situations where patients present with multiple abnormal values, although in such cases they usually still demonstrate patterns of abnormalities. For example, factor deficiencies usually exhibit both a prolonged R and a low G. But, a prolonged R with low to normal G may indicate hemodilution. A normal R with low to normal G and LY30 >20% indicates primary fibrinolysis. A high G with R<4 minutes and an EPL between 7.5% and 20% indicates early DIC. However, a general rule of thumb is that it is important to treat the R value first—either by an infusion of FFP (if R is high) or an anticoagulant (if R is low), and then repeat the test, since this initial treatment may automatically correct the other abnormal values. Several examples of abnormal TEG® plots are displayed in Figure 4, along with background and targeted treatment options.
Figure 4.
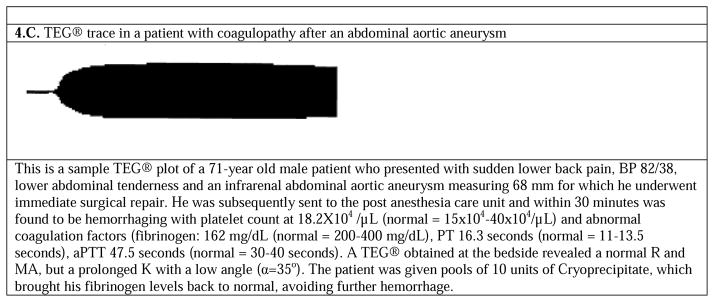
Several examples of abnormal thormoboelastogram (TEG®) graphs, along with background and treatment considerations. (figures adapted from 27)
PRACTICE CONSIDERATIONS FOR NPs
When NPs treat hemorrhaging patients, indiscriminate administration of FFP, platelets, or cryoprecipitate for coagulopathic states is not only uneconomical, but can also be extremely dangerous, either due to inappropriate side effects or delay of the correct treatment for the underlying problem. The qualitative analysis that thromboelastography provides can facilitate administration of the right blood product, at the right time, thereby permitting the application of goal-directed therapy.
In patients who have been on oral anticoagulants for a prolonged period of time and who need emergent surgery, the use of thromboelastography can reveal the patient’s likelihood of surgical bleeding.31 Similarly, bedside procedures such as the placement of central lines or other drains need not necessarily be delayed due to an elevated international normalized ratio (INR) value. Thromboelastography can accurately predict the risk of bleeding with the procedure, preventing delay of the procedure with targeted infusion of either platelets or plasma. If patients who come out from surgery are bleeding profusely from a surgical site, the use of thromboelastography can easily indicate whether the issue is due to a surgical problem or coagulopathy. A normal thromboelastography result would indicate the need to return to the operating room for re-exploration of the site, instead of NPs ordering more blood products. Conversely, an abnormal thromboelastography results would suggest that treatment of coagulopathy is first necessary. Finally, NPs encounter numerous patients on anticoagulation therapies to prevent the formation of blood clots. When these patients hemorrhage, thromboelastography can be used detect cases of ineffective platelet inhibitors or hypersensitivity to the anticoagulants.32 Thus thromboelastography offers both patients and NPs numerous benefits that can safely and effectively improve more targeted and timely patient care. The test is usually performed by trained personnel on a calibrated machine, and in most hospitals, it is usually performed in the laboratory, similar to most other assays. NPs are involved in interpreting the results of the test, and their competency includes familiarity with the use, application and interpretation of the test results. Most critical care intensivists, surgeons and anesthesia personnel are competent in this regard, and with some additional training NPs can become competent as well.
CONCLUSION
Further research incorporating the use of thromboelastography as a mainline treatment decision making strategy can expand the body of knowledge devoted to this subject and possibly improve patient care. Strategies must be implemented to assist NPs in the appropriate interpretation of the results of thromboelastography, as well as the formulation of appropriate treatment protocols. A paradigm shift is needed to embrace the use of valuable information that can easily be obtained from thromboelastography in diagnosis and management of coagulopathic bleeding. Such evidence-based practices can serve to decrease mortality rates in hemorrhaging patients, rendering a more cost-effective and safe hospital course.
Highlights.
Routine plasma-based tests are inadequate for hemorrhagic coagulopathy.
Indiscriminate treatment with blood products is dangerous for patients.
Nurse practitioners can use thromboelastography to manage coagulopathic interventions.
Acknowledgments
Funding: Supported by NIH Grant 1R01NR013912, National Institute of Nursing Research.
Footnotes
Publisher's Disclaimer: This is a PDF file of an unedited manuscript that has been accepted for publication. As a service to our customers we are providing this early version of the manuscript. The manuscript will undergo copyediting, typesetting, and review of the resulting proof before it is published in its final citable form. Please note that during the production process errors may be discovered which could affect the content, and all legal disclaimers that apply to the journal pertain.
Contributor Information
Eliezer Bose, Email: elb93@pitt.edu, eliezerbose@gmail.com, School of Nursing, University of Pittsburgh, 3500 Victoria St., 336 Victoria Building, Pittsburgh, PA 15261, USA, Phone: 412-680-3015.
Marilyn Hravnak, Email: mhra@pitt.edu, School of Nursing, University of Pittsburgh, 3500 Victoria St., 336 Victoria Building, Pittsburgh, PA 15261, USA, Phone: 412-624-3796.
References
- 1.Gonzalez E, Moore E, Moore H, Chapman M, Silliman C, Banerjee A. Trauma-induced Coagulopathy: An institution’s 35 year perspective on practice and research. Scandinavian Journal of Surgery. 2014;103(2):89–103. doi: 10.1177/1457496914531927. [DOI] [PMC free article] [PubMed] [Google Scholar]
- 2.Carvalho M, Rodrigues A, Gomes M, et al. Interventional Algorithms for the Control of Coagulopathic Bleeding in Surgical, Trauma, and Postpartum Settings Recommendations From the Share Network Group. Clinical and Applied Thrombosis/Hemostasis. 2014 doi: 10.1177/1076029614559773. 1076029614559773. [DOI] [PMC free article] [PubMed] [Google Scholar]
- 3.Shah NL, Intagliata NM, Northup PG, Argo CK, Caldwell SH. Procoagulant therapeutics in liver disease: a critique and clinical rationale. Nature Reviews Gastroenterology and Hepatology. 2014;11(11):675–682. doi: 10.1038/nrgastro.2014.121. [DOI] [PubMed] [Google Scholar]
- 4.Rossaint R, Bouillon B, Cerny V, et al. The STOP the bleeding campaign. Crit Care. 2013;17(2):136. doi: 10.1186/cc12579. [DOI] [PMC free article] [PubMed] [Google Scholar]
- 5.Johansen ME, Jensen J-U, Bestle MH, et al. Mild induced hypothermia: Effects on sepsis-related coagulopathy-results from a randomized controlled trial. Thrombosis research. 2015;135(1):175–182. doi: 10.1016/j.thromres.2014.10.028. [DOI] [PubMed] [Google Scholar]
- 6.Bhaskar B, Zeigenfuss M, Choudhary J, Fraser JF. Use of recombinant activated Factor VII for refractory after lung transplant bleeding as an effective strategy to restrict blood transfusion and associated complications. Transfusion. 2013;53(4):798–804. doi: 10.1111/j.1537-2995.2012.03801.x. [DOI] [PubMed] [Google Scholar]
- 7.Hoffman M, Dargaud Y. Mechanisms and monitoring of bypassing agent therapy. J Thromb Haemost. 2012;10(8):1478–1485. doi: 10.1111/j.1538-7836.2012.04793.x. [DOI] [PubMed] [Google Scholar]
- 8.Monroe DM, Hoffman M. Hemostasis and thrombosis. Oxford, UK: John Wiley & Sons Ltd; 2014. Theories of blood coagulation: basic concepts and recent updates; p. 1. [Google Scholar]
- 9.Clemetson KJ. Platelets and primary haemostasis. Thrombosis research. 2012;129(3):220–224. doi: 10.1016/j.thromres.2011.11.036. [DOI] [PubMed] [Google Scholar]
- 10.Levy JH, Szlam F, Tanaka KA, Sniecienski RM. Fibrinogen and hemostasis: a primary hemostatic target for the management of acquired bleeding. Anesthesia & Analgesia. 2012;114(2):261–274. doi: 10.1213/ANE.0b013e31822e1853. [DOI] [PubMed] [Google Scholar]
- 11.Innerhofer P, Kienast J. Principles of perioperative coagulopathy. Best Practice & Research Clinical Anaesthesiology. 2010;24(1):1–14. doi: 10.1016/j.bpa.2009.09.006. [DOI] [PubMed] [Google Scholar]
- 12.Espinosa A, Stenseth R, Videm V, Pleym H. Comparison of three point-of-care testing devices to detect hemostatic changes in adult elective cardiac surgery: a prospective observational study. BMC anesthesiology. 2014;14(1):80. doi: 10.1186/1471-2253-14-80. [DOI] [PMC free article] [PubMed] [Google Scholar]
- 13.Bolliger D, Seeberger MD, Tanaka KA. Principles and practice of thromboelastography in clinical coagulation management and transfusion practice. Transfusion medicine reviews. 2012;26(1):1–13. doi: 10.1016/j.tmrv.2011.07.005. [DOI] [PubMed] [Google Scholar]
- 14.Asehnoune K, Faraoni D, Brohi K. What’s new in management of traumatic coagulopathy? Intensive care medicine. 2014;40(11):1727–1730. doi: 10.1007/s00134-014-3388-3. [DOI] [PubMed] [Google Scholar]
- 15.Liou DZ, Shafi H, Bloom MB, et al. Defining Early Trauma-induced Coagulopathy Using Thromboelastography. The American surgeon. 2014;80(10):994–998. [PubMed] [Google Scholar]
- 16.Aron J, Gibbon A, Ward C, Ball J. Value of thromboelastography in managing hypercoagulopathy in intensive care. Critical Care. 2015;19(Suppl 1):340. [Google Scholar]
- 17.Harr JN, Moore EE, Ghasabyan A, et al. Functional fibrinogen assay indicates that fibrinogen is critical in correcting abnormal clot strength following trauma. Shock (Augusta, Ga) 2013;39(1):45. doi: 10.1097/SHK.0b013e3182787122. [DOI] [PMC free article] [PubMed] [Google Scholar]
- 18.Trapani LM. Thromboelastography: current applications, future directions. Open journal of Anesthesiology. 2013;3:23–27. [Google Scholar]
- 19.Müller MC, Meijers JC, Vroom MB, Juffermans NP. Utility of thromboelastography and/or thromboelastometry in adults with sepsis: a systematic review. Critical Care. 2014;18(1):R30. doi: 10.1186/cc13721. [DOI] [PMC free article] [PubMed] [Google Scholar]
- 20.Stravitz RT, Lisman T, Luketic VA, et al. Minimal effects of acute liver injury/acute liver failure on hemostasis as assessed by thromboelastography. Journal of hepatology. 2012;56(1):129–136. doi: 10.1016/j.jhep.2011.04.020. [DOI] [PMC free article] [PubMed] [Google Scholar]
- 21.Brazzel C. Thromboelastography-guided transfusion Therapy in the trauma patient. AANA journal. 2013;81(2):127–132. [PubMed] [Google Scholar]
- 22.Harrison P, Mackie I, Mumford A, et al. Guidelines for the laboratory investigation of heritable disorders of platelet function. British journal of haematology. 2011;155(1):30–44. doi: 10.1111/j.1365-2141.2011.08793.x. [DOI] [PubMed] [Google Scholar]
- 23.Johansson PI, Oliveri RS, Ostrowski SR. Hemostatic resuscitation with plasma and platelets in trauma. Journal of emergencies, trauma, and shock. 2012;5(2):120. doi: 10.4103/0974-2700.96479. [DOI] [PMC free article] [PubMed] [Google Scholar]
- 24.Svensson PJ, Bergqvist PB, Juul KV, Berntorp E. Desmopressin in treatment of haematological disorders and in prevention of surgical bleeding. Blood reviews. 2014;28(3):95–102. doi: 10.1016/j.blre.2014.03.001. [DOI] [PubMed] [Google Scholar]
- 25.Krzanicki D, Sugavanam A, Mallett S. Intraoperative hypercoagulability during liver transplantation as demonstrated by thromboelastography. Liver Transpl. 2013;19(8):852–861. doi: 10.1002/lt.23668. [DOI] [PubMed] [Google Scholar]
- 26.Mejia A, Mendoza ML, Mejia C, Lee GW. Thromboelastography Use in the Perioperative Transfusion Management of a Patient with Hemophilia A Undergoing Liver Transplantation. 2013;3(1) [Google Scholar]
- 27.da Luz LT, Nascimento B, Rizoli S. Thrombelastography (TEG®): practical considerations on its clinical use in trauma resuscitation. Scand J Trauma Resusc Emerg Med. 2013;21:29. doi: 10.1186/1757-7241-21-29. [DOI] [PMC free article] [PubMed] [Google Scholar]
- 28.Chapman MP, Moore EE, Ramos CR, et al. Fibrinolysis greater than 3% is the critical value for initiation of antifibrinolytic therapy. The journal of trauma and acute care surgery. 2013;75(6):961. doi: 10.1097/TA.0b013e3182aa9c9f. [DOI] [PMC free article] [PubMed] [Google Scholar]
- 29.Simmons J, Sikorski RA, Pittet J-F. Tranexamic acid: from trauma to routine perioperative use. Current Opinion in Anesthesiology. 2015;28(2):191–200. doi: 10.1097/ACO.0000000000000165. [DOI] [PMC free article] [PubMed] [Google Scholar]
- 30.Ipema HJ, Tanzi MG. Use of topical tranexamic acid or aminocaproic acid to prevent bleeding after major surgical procedures. Annals of Pharmacotherapy. 2012;46(1):97–107. doi: 10.1345/aph.1Q383. [DOI] [PubMed] [Google Scholar]
- 31.Whiting D, DiNardo JA. TEG and ROTEM: technology and clinical applications. American journal of hematology. 2014;89(2):228–232. doi: 10.1002/ajh.23599. [DOI] [PubMed] [Google Scholar]
- 32.Agarwal S, Johnson RI, Kirmani BH. Pre and Post Bypass Platelet Function Testing with Multiple Electrode Aggregometry and TEG® PlateletMapping in Cardiac Surgery. Journal of Cardiothoracic and Vascular Anesthesia. 2015 doi: 10.1053/j.jvca.2015.01.028. [DOI] [PubMed] [Google Scholar]
- 33.Davie EW, Fujikawa K, Kisiel W. The coagulation cascade: initiation, maintenance, and regulation. Biochemistry. 1991;30(43):10363–10370. doi: 10.1021/bi00107a001. [DOI] [PubMed] [Google Scholar]
- 34.Rivard GE, Kathleen B, Li F, Angelique H, Eli C, Kenneth MG. Evaluation of the Profile of Thrombin Generation during the Process of Whole Blood Clotting as Assessed by Thromboelastography. Paper presented at: ASH Annual Meeting Abstracts; 2004. [Google Scholar]


