

Abstract
The immune responses to influenza, a virus that exhibits strain variation, show complex dynamics where prior immunity shapes the response to the subsequent infecting strains. Original antigenic sin (OAS) describes the observation that antibodies to the first encountered influenza strain, specifically antibodies to the epitopes on the head of influenza's main surface glycoprotein, haemagglutinin (HA), dominate following infection with new drifted strains. OAS suggests that responses to the original strain are preferentially boosted. Recent studies also show limited boosting of the antibodies to conserved epitopes on the stem of HA, which are attractive targets for a ‘universal vaccine’. We develop multi-epitope models to explore how pre-existing immunity modulates the immune response to new strains following immunization. Our models suggest that the masking of antigenic epitopes by antibodies may play an important role in describing the complex dynamics of OAS and limited boosting of antibodies to the stem of HA. Analysis of recently published data confirms model predictions for how pre-existing antibodies to an epitope on HA decrease the magnitude of boosting of the antibody response to this epitope following immunization. We explore strategies for boosting of antibodies to conserved epitopes and generating broadly protective immunity to multiple strains.
Keywords: influenza, strain-variation, humoral immunity, epitope masking model
1. Introduction
We are rarely immunologically naive—even at the time of birth we have pre-existing antibodies from our mothers. Prior immunity affects the responses both to infections and to vaccines. Understanding the rules for how pre-existing immunity modulates the immune response to subsequent infections is particularly important in the case of infections with influenza A virus which exhibits strain variation [1,2]. As a result of selection pressure from the immune system the influenza virus changes its surface antigens, which are the main target of humoral immunity. This allows hosts to be infected multiple times, each time with a new strain, over their lifespan, generating complex dynamics at the within-host (immunological) as well as at the epidemiological level.
Influenza A is one of the best studied examples of viruses with strain variation and an ideal system to study the effects of prior immunity on subsequent infection and vaccination. Both the virus and the immune response to it have been extensively characterized at the molecular, immunological and epidemiological levels [1–10]. Current influenza vaccines focus on the generation of antibodies to the surface proteins haemagglutinin (HA) and, to a lesser extent, neuraminidase. HA dominates the surface of the influenza virus, being four to five times more abundant than neuraminidase, and is the main target of the antibody response to influenza [11–13]. HA is a homotrimeric integral membrane glycoprotein with a distinct head and stem structure [14]. The head of HA has about five highly variable epitopes, and the stem has fewer epitopes which are relatively conserved [7]. Eighteen different HA subtypes (H1–H18) have been identified in the zoonotic reservoir [15–17], and typically one or two of subtypes H1, H2 and H3 circulate in the human population at any given time [9]. The head region of HA changes dramatically between HA subtypes, and there is little cross-reactivity between antibodies to different HA heads. The stem region is relatively conserved between each of two phylogenetic groups (group 1 includes H1, H2, H5, H6, H8, H9, H11, H12, H13, H16, H17 and H18; and group 2 includes H3, H4, H7, H10, H14 and H15) [15–17]. Antibodies to epitopes on the HA stem can be broadly cross-reactive and able to recognize other subtypes within a group and even between the two groups [18–24].
Antigenic changes in influenza A are of two types, antigenic drift and antigenic shift. Antigenic drift is responsible for seasonal outbreaks and involves a gradual change in antibody binding epitopes on the head of HA within a given subtype [2]. This allows the new viruses to escape the antibodies generated following infection or vaccination with prior virus strains. Antigenic shift is responsible for relatively rare pandemics and involves replacement of the current circulating HA with a different subtype typically originating from zoonotic reservoirs [9]. Consequently, antigenic shift results in much larger changes to the HA head region in comparison with antigenic drift. Over the lifespan, an individual gets infected about a dozen times, predominantly by drift variants of a given subtype [25] and occasionally by new subtypes [9].
It was shown that for a given individual, the antibody response to the first influenza infection is enhanced and dominates following subsequent infections with drifted strains, and this effect was termed original antigenic sin (OAS) [26,27]. OAS has been characterized in studies of natural infections of humans and experimental infections and vaccinations of mice and ferrets [26–33]. In a classic experiment reporting OAS, ferrets were infected sequentially with three closely related virus strains of the same HA subtype (i.e. drifted strains) [30]. Incubating the final immune serum (i.e. after the third infection) with the first virus removed serum antibodies to all three viruses, indicating that antibody responses generated by the first infection dominated the responses to the subsequent virus strains. In contrast, incubation of the final immune serum with the second (or third) strain removed all antibodies to the second (or third) strain but only some of the antibodies to the other two strains. Similarly, in humans, the influenza strains circulating during childhood determine the predominant antibodies to influenza through life [25,29,34]. The phenomenon of OAS has been revisited and elaborated in recent seroepidemiological studies in humans [25,34,35].
The conventional explanation of OAS is as follows. When an individual is infected with influenza for the first time, this results in clonal expansion of the B cells specific for antigenic epitopes present on this strain. At the beginning of a subsequent infection of the same individual with a drifted strain, there will be a higher number of B cells specific for the epitopes shared between the drifted and original strain in comparison with (naive) B cells specific for new epitopes on the drifted strain. If we have similar levels of expansion of responses to old and new epitopes, the final response will be dominated by B cells and antibodies specific for old epitopes (i.e. those present on the initial strain) that are shared and thus boosted by the new strain.
Observations of OAS are based on measurements with the haemagglutination inhibition (HAI) assay [30,31,35] which quantify antibodies to the head of HA but not to the stem [6,36]. In this paper, we consider OAS following sequential immunizations with two strains of influenza. We define OAS quantitatively as the fraction of the final antibody to influenza that is specific for epitopes on the head of HA from the first strain.
More recently, there has been a focus on antibodies to the stem of HA, which could provide broadly cross-reactive protection. Stem-specific antibodies can be measured using a recently developed ELISA-based competitive inhibition assay [21]. In accord with the doctrine of OAS, we might expect to see boosting of antibodies to conserved epitopes on the stem of HA both following sequential infections or immunization with drifted or shifted strains, leading to the generation of broadly protective immunity. However, current vaccines do not typically generate sufficiently high levels of stem-specific antibodies to provide broad protection against different strains and subtypes, and much effort has been directed towards overcoming this limitation [37–44].
In this paper, we develop mathematical models for the generation of antibody responses to multiple epitopes on an antigen. Our models differ from previous models of antibody responses as they incorporate the masking of epitopes on the antigen by antibodies as well as steric interference between antibodies bound to different epitopes. We show that models with epitope masking allow us to recapitulate key features for how pre-existing immunity affects the dynamics of the antibody response following immunization with new strains. In particular, it allows us to reconcile the observation of OAS in the responses to epitopes on the head of HA with a lack of boosting of antibodies to conserved epitopes on the stem of HA. Analysis of recent data allows testing of the model prediction regarding how pre-existing immunity to a given epitope causes a decline in the boosting of the response to that epitope. Finally, we use the model to explore different strategies for boosting of antibodies to conserved epitopes on the stem of HA which could provide strain-transcending immunity and form the basis for a universal influenza vaccine.
2. Formulation of the multi-epitope model
Here, we formulate a model for the dynamics of antibody responses to multiple epitopes on an antigen. We first explore the effects of masking of an epitope by antibodies for the case of an antigen with a single epitope. We then extend the model to consider antigens with multiple epitopes. Our hypothesis is that both masking of epitopes on the antigen by pre-existing antibodies and antibodies generated during the immune response play a key role in shaping the humoral immune response.
(a). Epitope masking model for one epitope
We begin by considering an antigen, H, with a single epitope. The simplest model for an antibody response to an antigen includes B cells specific for the antigen, B, and the antibodies, A, that they secrete. In accord with clonal selection, B cells are stimulated and proliferate in a manner dependent on the concentration of antigen. B cells secrete antibodies that can bind to the antigen, and we let Hf and Hb be the concentrations of free antigen and antigen that is bound to antibody, respectively. Only free antigen is able to bind to and stimulate specific B cells. We keep the model of the immune response as simple as possible with basic clonal expansion modelled as in [45], a simplified version of antibody secretion from [46], and the addition of epitope masking. With these basic assumptions (which are detailed in the electronic supplementary material), we have
| 2.1 |
| 2.2 |
| 2.3 |
| 2.4 |
We chose the model parameters to obtain key features of a typical antibody response. We rescaled the initial values of antibodies and B cells to unity at the naive state (prior to primary influenza infection) and set a = dA, so that at equilibrium in naive or memory states we have B ≈ A. For the recall responses, the initial values of antibodies and B cells were set equal to the level of pre-existing immunity shown on the corresponding figures. The decay rate of free antibody dA = 0.1 d−1 is taken from the literature [47]. We set the maximum rate of clonal expansion of B cells during the generation of antibody responses to s = 1 d−1. We assume that clonal expansion in response to antigen results in about 103-fold expansion of the specific responses during primary responses [45,48]. We begin with antigen H(0) = 103 having a decay rate of dH = 0.5 d−1 and let the threshold for stimulation ϕ = 10, which results in proliferation of B cells for about 10 days. The rate constant of binding of antibody to antigen was set to k = 0.01 to have rapid binding of antibody to antigen compared with the time scale of the response. See the electronic supplementary material for further details.
In figure 1, we plot the dynamics of primary and recall responses following sequential immunization with antigen. We consider two cases: with and without epitope masking. We remove epitope masking from the model (2.1)–(2.4) by allowing both free and bound antigen to stimulate B cells, i.e. Ḃ = sBH/(ϕ + H), where H = Hf + Hb. In the absence of epitope masking, secondary immunization results in an increase in antibody titres that is similar to that observed during the primary response (figure 1a), and figure 1b shows that this is maintained for subsequent immunizations. Compared with the case of no masking, epitope masking results in a diminution of the primary response (compare panels a and c) and much larger reduction of the boost following subsequent immunizations (compare figure 1b and d). This is because the masking is greater, and the boost is smaller, as the amount of antibody prior to immunization increases.
Figure 1.

Primary and recall responses to sequential immunization with an antigen having a single epitope. Primary and recall response without (a,b) and with (c,d) epitope masking (EM). Parameters and equations are described in §2a. Initial conditions for primary response are Hf = 103, Hb = 0, B = 1, A = 1. The initial conditions for the recall responses were the same for the antigen, while values of B cells and antibodies were set to their final values at the end of previous immunization.
Figure 1d shows that saturation of the response in the model with epitope masking occurs rapidly, and, for the parameters chosen, there is little boosting after the secondary response. The time point at which this saturation occurs depends on the parameters (particularly, higher s and lower ϕ result in faster saturation). However, the above-described qualitative features are relatively robust to changes in the parameters within the biologically reasonable regime chosen, as indicated earlier (see electronic supplementary material, figure S1).
We now explore how the magnitude of the response in the epitope masking model (EMM) depends on two factors: the dose of antigen and the amount of pre-existing immunity. In the following discussion, pre-existing immunity equals the amount of B cells and antibodies (which are in equilibrium and due to scaling of parameters have similar levels) prior to immunization. We plot both the final antibody level and the fold expansion (both measured at day 30 when the magnitude of the response plateaus). Figure 2 shows how the antibody response depends on the antigen dose (x-axis) for different levels of pre-existing immunity (different lines). When we start in the ‘naive’ state (B(0) = A(0) = 1) an amount of antigen H(0) > ϕ is needed to stimulate B cells and elicit a response, and the magnitude of the response increases with increasing antigen dose.
Figure 2.
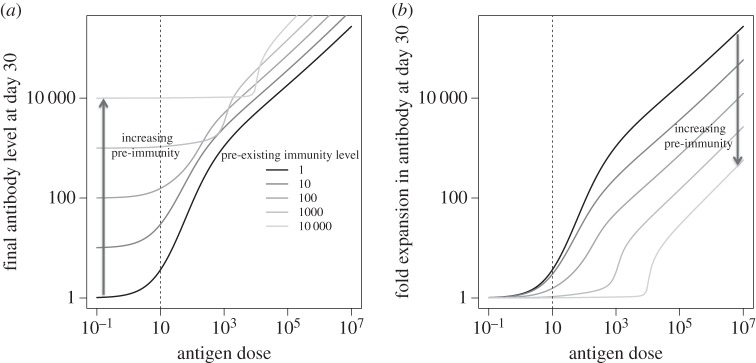
Response to antigen in the single epitope model. We plot how the final amount of antibodies (a) and the fold boosting (b) depend on the antigen dose for different levels of pre-existing immunity (initial value of B(0) = A(0) as indicated in the legend of panel a). Dashed vertical line at ϕ indicates the level of antigen required to stimulate B cells.
Pre-existing immunity has two effects: starting with a higher number of B cells (and antibodies) increases the magnitude of the response, but the increase in the antibodies they produce masks the antigen and leads to a decrease in the magnitude of the secondary response. If we have a high level of pre-existing immunity (B cells and antibody), then more antigen is needed (H(0) ≫ ϕ) to overcome the masking effect and boost the immune response.
(b). Epitope masking model for multiple epitopes
We now extend the EMM for one epitope by incorporating a second epitope and by including steric interference between the antibody responses to the different epitopes.
Let us consider an antigen HXY with two epitopes X and Y. We let BX and AX represent B cells and antibodies specific for epitope X (and similarly BY and AY for epitope Y). The free antigen is HXY, and there are three additional states for antigen bound to antibodies: HOY, HXO and HOO representing antigen with antibodies bound to X, Y or both epitopes, respectively. The parameter β is a measure of the degree of steric interference and describes the extent to which binding of antibodies to one epitope prevents the binding of antibodies to another epitope and ranges between zero and one. If the epitopes are widely separated spatially, then β = 0, and if the epitopes are in very close proximity such that binding of antibody to one epitope sterically inhibits binding to the adjacent epitope, then β = 1. A schematic for the potential antigen states is shown in figure 3 and gives rise to the following equations:
| 2.5 |
| 2.6 |
| 2.7 |
| 2.8 |
| 2.9 |
| 2.10 |
| 2.11 |
and
| 2.12 |
In figure 4, we plot how the amount of pre-existing immunity to epitope X affects the extent of boosting, measured by the fold increase in antibodies to this epitope as well as to epitope Y. We examine how this depends on the antigen dose and the degree of steric interference β.
Figure 3.
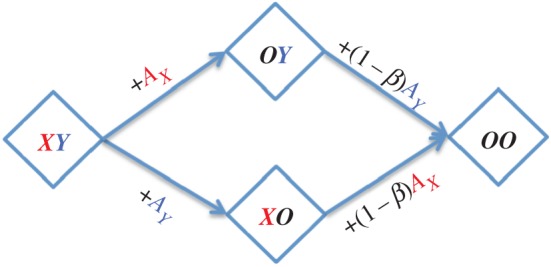
Two-epitope masking model with steric interference. Scheme shows the different states of an antigen with epitopes X and Y. The naive state XY has both epitopes accessible. Antibody binding to one epitope results in masking of that epitope and, depending on its proximity to the second epitope, interferes with the binding of antibody (and B cells) to the second epitope. The parameter β describes the extent to which binding of antibodies to one epitope prevents the binding of antibodies to another epitope and ranges between zero (no steric interference) and one (complete steric interference). (Online version in colour.)
Figure 4.

Fold boosting of antibody responses in the two-epitope model. Contour plots showing how the fold boosting of the antibody responses AX (top row) and AY (bottom row) to epitopes X and Y, respectively, depends on pre-existing immunity AX to epitope X (x-axis) as well as antigen dose (y-axis). The model results are shown for three levels of steric interference β, ranging from no steric interference (i.e. β = 0) in the left column to complete interference (β = 1) in the right column. Other parameters are as in figure 1.
The fold boosting of antibody responses to epitope X and epitope Y are shown for three different values of β in figure 4. The pre-existing antibody AX masks epitope X causing a reduction in the boosting of antibodies to this epitope with an increase in the level of pre-existing antibody. This effect is largely independent of β (top row). In the absence of steric interference (i.e. β = 0), binding of antibodies to epitope X does not mask epitope Y, and in this case, the antibody response to epitope Y is independent of the antibody to X and depends only on the antigen dose. When the value of β increases, antibody to epitope X also masks epitope Y, lowering the boosting of responses to this epitope. In the limit when there is complete interference (β = 1), the extent of boosting of the antibody response to epitope Y becomes identical to the extent of boosting of the antibody response to epitope X.
3. Application to influenza
Here, we adapt our multi-epitope model to explore how pre-existing antibodies to the major surface protein of influenza HA affect the antibody response following immunization with a new HA. We consider situations where the HA used for immunization is from a drift variant or from a new strain arising from antigenic shift. The simplest model to account for the features specific to the antibody response to HA requires three epitopes: to explore OAS we need (at least) two epitopes X and Y on the head of HA; and to understand the lack of boosting to the stem requires an additional epitope S on the stem of HA. We model sterical interference for the antibody binding to the head epitopes with parameter β described in §2b. This assumption is supported by a number of experimental studies [12,49,50]. In contrast to epitopes on the head of HA that are in close proximity, the epitope on the stem of HA is sufficiently far from the epitopes on the head to preclude interference between antibodies binding to the stem and head epitopes. The scheme showing the transitions between the different states of an antigen with epitopes X, Y and S, corresponding equations and additional influenza-specific assumptions are in the electronic supplementary material.
The final amount of antibody is determined by precursor frequencies of specific B cells and the amount of their expansion. The extent of expansion depends on the amount of the antigen (epitope) that is available for stimulation, and this can be modulated (decreased) if the epitope is masked by antibodies.
In the case of immunization with HA from a shifted strain, the head region changes dramatically, and there will be little or no pre-existing immunity to the epitopes X and Y on the head. However, there will be antibodies to the conserved epitope S on the stem of HA, provided the antigenic shift is to a virus from the same phylogenetic group. Consequently, there will be a larger fold increase of antibodies to the (new) head epitopes and less expansion of antibodies to the stem epitopes owing to masking. In the electronic supplementary material, figure S3a shows how the fold expansion of antibodies to the head and stem epitopes of HA from the shifted strain depends on the level of pre-existing immunity to the stem epitope (AS on x-axis) and antigen dose (on y-axis). The final amount of antibodies to the epitopes depends on both the initial level of immunity as well as the boosting (electronic supplementary material, figure S4a).
Seasonal antigenic drift is characterized by changes in one or a few amino acids at one of the epitopes (Y) on the head of HA. In this case, we begin with prior immunity to an unchanged epitope on the head and the conserved stem epitope. Consequently, we have epitope masking reducing the boosting of responses to the X and S epitopes. In this antigenic drift scenario, antibodies binding to the conserved X epitope on the head will also sterically block the ability of antibodies and B cells to bind to the new Y epitope, and this will lead to much reduced boosting of the response to this new head epitope in contrast with the scenario for antigenic shift as shown in the electronic supplementary material, figure S3b. The final amount of antibody to the different epitopes is a product of the initial level of immunity and the fold boosting as shown in the electronic supplementary material, figure S4b.
In both shift and drift, we see similarly limited boosting of responses to the conserved stem epitope because the epitope is masked by antibodies from pre-existing immunity (compare right panels on electronic supplementary material, figure S3). Boosting of responses to head epitopes shared between original and drifted strains is affected by epitope masking in a more complex way, and we use the model to dissect the role of different factors that contribute to OAS. In this paper, we consider OAS following sequential immunizations with two strains of influenza. We define OAS quantitatively as the fraction of the final antibody to influenza that is specific for epitopes on the head of HA from the first strain. Three different factors contribute to the extent of OAS. First, we begin the recall response to a drifted strain with a larger number of B cells specific for shared epitopes compared with new epitopes, and this is the basis for the conventional explanation of OAS (however, as mentioned in §1, this conventional explanation fails to account for the lack of boosting of antibodies to the stem of HA). Second, the EMM predicts that the amount of boosting in response to a given epitope will be smaller if we start from a higher level of pre-existing antibody to that epitope. This lowers the magnitude of OAS. Third, steric interference between the antibodies to the head epitopes (high β) results in a similar decrease in boosting for both old and new epitopes. As shown in figure 5 in the case of no epitope masking, increasing the initial level of antibody (AX) to the shared epitope (X) rapidly leads to high levels of OAS (OAS → 1) and this is shown by the thick dashed line. If we add epitope masking, then the level of OAS depends on the level of steric interference (β). In the absence of steric interference (β = 0), epitope masking leads to a lower level of OAS. Increasing the level of steric interference (β → 1) increases the level of OAS towards the high level observed in the absence of epitope masking.
Figure 5.
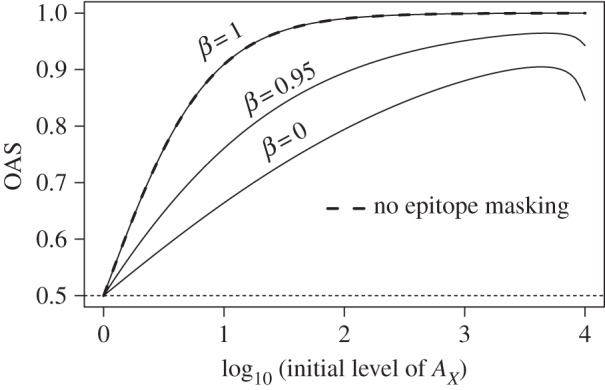
OAS as a function of two parameters: pre-existing immunity to an epitope shared between original and drifted strains AX and steric interference parameter β. We consider OAS following sequential immunizations with two strains of influenza. We define OAS quantitatively as the fraction of the final antibody to influenza that is specific for epitopes on the head of HA from the first strain. Results of EMM are shown at three different values of β (solid lines). The case of no epitope masking is shown with thick dashed line. The dotted line shows the minimal level of OAS for the model with two epitopes X and Y on the head of HA. The antigen dose is 104.
4. Model predictions
We focus on two key predictions of the EMM.
First, the EMM predicts how the boosting of the antibody response to an epitope depends on the amount of pre-existing immunity to that epitope. If we keep the antigen dose for boosting fixed, then we see that increasing the amount of pre-existing immunity leads to a lower fold boosting (see figure 2b and electronic supplementary material, figure S5). Electronic supplementary material, figure S5 shows that when there is sufficient antigen to cause a significant boost in immunity, the log fold expansion will decrease approximately linearly with the log of the pre-existing immunity to that epitope.
Second, the model predicts the outcome when the amount of pre-vaccination immunity (B cells and antibodies) is kept constant and we change the antigen dose. In these circumstances, the model predicts (figure 2b) that there is a threshold for an antigen dose below which there is almost no boosting and this level increases as the level of pre-vaccination immunity to that epitope increases. When the antigen dose exceeds this threshold, there is a rapid increase in antibody boosting in response to an increase in antigen dose.
In §§5 and 6, we describe preliminary tests for these predictions by reanalysis of existing data and then consider the implications of our predictions for vaccination.
5. Preliminary tests of the model predictions
We first test our prediction for how the level of pre-vaccination immunity (specific B cells and antibodies) to an epitope affects the boosting of the response to that epitope (see electronic supplementary material, figure S5). We analysed recently published data for vaccination of humans: one group has been vaccinated with the 2012/2013 trivalent influenza vaccine (TIV) which included HA from the pandemic H1N1 strain; another group received HA from inactivated H5N1 avian influenza virus [42]. In this study, they used assays that allowed independent measurement of the antibodies to the stem and head of HA.
In the 2012/2013 TIV vaccination part of the study, head- and stem-specific antibody responses were quantified by an ELISA-based competitive blocking assay using the competition between different dilutions of unlabelled polyclonal serum antibodies and head (15-2G04)- or stem (SF70)-specific monoclonal antibodies (mAb) as described in [42]. Fifty percent blocking-dilution (BD50) values for binding of head- and stem-specific mAbs were measured before (day 0) and after (day 30) vaccination (figure 6a,b). Note that the antibody titre in figure 6 is on a log scale. As described in [42], we see considerable variation in the magnitude of the immunity and the extent of boosting of antibodies to both head and stem, and on average, head-specific antibodies were boosted more (eightfold) than stem-specific antibodies (threefold). Our model predicts that when the antigen dose is fixed (as in this study) the fold expansion of antibodies to a given epitope will be determined by the pre-vaccination level of antibodies to that epitope, and this will be the case for both head and stem epitopes. We tested this prediction by re-plotting the experimental data (figure 6c). We see that the boosting of the antibody response to both the head (circles) and stem (triangles) of HA declines with an increase in the corresponding pre-vaccination antibody titre. Interestingly, we see a similar relationship (linear on a log–log plot) to the one predicted in electronic supplementary material, figure S5, and the pre-existing antibody titre explains just over half of the variation in the magnitude of boosting (R2 = 0.55).
Figure 6.

Serological data of HA head- and stem-specific antibody responses following immunization with 2012/13 TIV (a,b) and H5N1 (d,e) is taken from [42]. The relationship between the pre-vaccination antibody titre and fold increase in antibody titre for responses to both head (circles) and stem (triangles) epitopes following 2012/13 TIV (c) and H5N1 boost (f) vaccinations is shown. We note that the antibody titre is inherently log2 based and the fold increase is plotted on a log scale. (Online version in colour.)
This study also followed both prime and boost vaccination with inactivated H5N1 avian influenza virus [42]. They measured head- and stem-specific antibodies using ELISA assays against chimeric HAs that contained just the relevant head or stem. We focus on the data obtained following the boost as different individuals in the prime received HA from different strains of H5N1 (Vietnam and Indonesia strains), but all individuals received a boost with the Indonesia strain, and in all cases head-specific antibodies were measured by binding to the head of HA from the Indonesia strain. The experimental data are plotted in figure 6d–e. As is the case with the H1N1 vaccination, we see considerable variation in the magnitude of the immunity and boosting to both head and stem of HA, and on average, antibodies to the epitope on the head were boosted more than the antibodies specific for the epitope on the stem. In accord with the predictions of our model, we find that the log fold expansion decreases linearly with an increase in the log pre-vaccination antibody (figure 6f). We can add data to figure 6f for the expansion of stem antibodies (but not head, see above) following the prime vaccination, and this too follows the same pattern (electronic supplementary material, figure S6).
The second prediction of our model relates how the level of boosting depends on antigen dose. Interestingly, H5N1 vaccination led to much higher boosting of stem-specific antibody than 2012/2013 TIV [42]. We would like to point out the difference in the doses of antigen in 2012/2013 TIV and H5N1 vaccines (15 versus 90 μg per dose, respectively). As electronic supplementary material, figure S5 shows, the antigen dose is a critical parameter, having a higher dose of antigen (six times higher in H5N1 vaccine in comparison with H1N1 strain in TIV) can overcome antibody masking, and this leads to a higher boost of stem-specific cross-reactive responses.
6. Implication for vaccination
Strain variation is a key feature of influenza that allows new strains of the virus to evade immunity generated both by natural infection and immunization to prior strains. There is substantial interest in developing a more broadly protective vaccine against influenza by targeting conserved epitopes on HA. Several HA stem epitopes elicit broadly cross-reactive antibodies that are able to recognize all subtypes within the corresponding phylogenetic group [18–24]. Passive transfer of these cross-reactive stem-specific antibodies can provide protection to mice and ferrets [21,39,40], suggesting that at least in principle, stem-specific antibodies could be considered as a basis for a universal vaccine in humans. Several approaches have been proposed for generating and maintaining sufficiently high titres of these cross-reactive stem-specific antibodies.
One approach uses primary DNA immunization with HA from the H1N1 strain in the seasonal vaccine, followed by boosting with the same seasonal vaccine [37]. This strategy generated neutralizing antibodies that were protective in mice and ferrets to homologous and heterologous H1N1 strains. Immune sera from these mice also neutralized other group 1 influenza viruses such as H2N2 and H5N1 [37]. A second approach used immunization of HA-nanoparticles containing HA from H1N1 and generated much higher responses to both matched and unmatched H1N1 strains than immunization with TIV; this approach also showed greater control of viral load following challenge in ferrets [38]. A third strategy was to use sequential vaccinations with chimeric HA that have a conserved stem region but head regions from different subtypes [39–41]. For example, mice were given DNA immunization with cH9/1 (chimeric HA with H9 head and H1 stem) and boosted with the soluble cH6/1 HA followed by the cH5/1 HA [39]. These immunized mice could control lethal challenges with different HA subtypes from the same phylogenetic group, group 1 (e.g. H1N1), but not from group 2 (e.g. H3N2) which has a different stem from that in the immunizing chimeric HAs.
While these approaches show that stem-specific antibodies can be generated by vaccination, the rules for boosting of stem-specific antibodies are unclear. For example, some studies [39–41] suggest a key role is having different HA heads in the prime vaccination and subsequent boosts, whereas other studies successfully boosted cross-reactive stem-specific antibodies using a homologous HA boost [37,38]. Our models predict that using the same or different HA head is not a critical factor in the boosting of stem-specific antibodies following immunization with HA (compare right panels in electronic supplementary material, figure S3), and we have identified the two key parameters (pre-existing immunity and the antigen dose) for boosting cross-reactive stem-specific immunity.
7. Future studies
In this study, we have intentionally used simple phenomenological models because, in the absence of detailed information on the terms and parameters, simpler models frequently generate more robust qualitative results than complex models [51,52]. In application to influenza, we consider the immune response following immunization with HA, which is simplified to have three epitopes (two on the head of HA and one conserved epitope on the stem of HA), and B cells and antibodies specific for these epitopes. This relatively simple model has the advantage of allowing us to (i) propose hypotheses to explain the key features of antibody responses to influenza following antigenic drift and shift; and (ii) propose experiments that allow the model and these hypotheses to be experimentally tested.
The next step will be to include additional complexities to the model. These would include but not be restricted to incorporating subpopulations of B cells such as short and long-lived plasma cells, CD4 T cell-dependent affinity maturation, realistic numbers of epitopes (typically five on the head of the HA molecule and one or two on the stem [7,53]) and their immunodominance hierarchy. Spatial considerations are also likely to play a role and can be incorporated by including the structure of germinal centres in lymph nodes. Cross-reactivity in antibody responses to changed epitopes could be modelled in different ways, such as incorporating partially cross-reactive antibodies which have weaker binding for a changed epitope. Including these additional features into our model will result in a much more complex model and will need to be done in concert with experiments that estimate the many additional parameters of the models. Additional subpopulations of B cells and T-helper cells have been modelled in [46], albeit for the response to a single epitope. Affinity maturation has been modelled by Kepler & Perelson [54]. The interactions between cells and antigen in germinal centres and how they regulate affinity maturation have been modelled by Zhang et al. [55], who explored how a number of factors, including epitope masking by antibodies, affect affinity maturation. However, to the best of our knowledge, our paper is the first to explore the effect of epitope masking on the magnitude of the secondary responses. Another extension would be to include factors such as target cell limitation, innate immunity and T cell immunity in the response to live influenza infections [56–58]. Finally, in this paper, we focus on the rules of boosting of antibody responses and do not consider the longevity of humoral memory [47,59] which needs to be explicitly incorporated in order to have a predictive model for the longevity of immunological memory following vaccination. While some of our preliminary studies suggest that the main qualitative conclusions of our model are robust to incorporation of these additional complexities, much remains to be done.
The proposed model is consistent with the experimental data and provides one explanation for the differential boosting of antibodies to the head and stem of HA. Developing alternative models and discriminating between the different models will be the next step. This will require modelling in concert with experiments. Experimental studies will be needed to estimate key parameters of the models (such as the extent of steric interference in the binding of antibodies to different epitopes on HA and the rate constants for proliferation and differentiation of B cells during immune responses) as well as to test predictions, thus allowing us to discriminate between alternative models.
8. Conclusion
In this study, we used mathematical models to explore how pre-existing immunity affects the dynamics of antibody responses to influenza. Our models suggest that the masking of epitopes by antibody binding may play a key role in the dynamics of recall responses. We are able to recapitulate and explain the key features for boosting of immunity following immunization with antigenically drifted or shifted strains of influenza and reconcile the observation of OAS with a lack of boosting of antibodies to conserved epitopes on the stem of HA. We tested the predictions of the model by reanalysis of existing experimental data that measured responses to both the head and stem epitopes on HA. Finally, the models allow us to explore strategies for boosting of antibodies to conserved epitopes on the stem of HA which may provide strain-transcending immunity and thus set the framework for generating broadly protective universal influenza vaccines.
Supplementary Material
Acknowledgements
We thank Jennie Lavine and the reviewers for their comments and suggestions.
Authors' contributions
All co-authors discussed the problem, approach and results. V.Z. and R. Antia formulated the model. V.Z. ran simulations. A.E., C.D. and R. Ahmed conducted the experimental studies that are analysed in this paper. V.Z. and R. Antia wrote the paper, and all authors approved the final version.
Competing interests
We declare we have no competing interests.
Funding
V.Z., R. Antia, R. Ahmed and J.J. were supported by U19 AI1178918. Additionally, V.Z. and R. Antia were supported by NIH U54 GM111274, R. Ahmed was supported by NIAID HHSN266200700006C and A.E. was supported by training grant no. NIH T32AI074492.
References
- 1.Grebe KM, Yewdell JW, Bennink JR. 2008. Heterosubtypic immunity to influenza A virus: where do we stand? Microbes Infect. 10, 1024–1029. ( 10.1016/j.micinf.2008.07.002) [DOI] [PMC free article] [PubMed] [Google Scholar]
- 2.Yewdell JW. 2011. Viva la revolución: rethinking influenza a virus antigenic drift. Curr. Opin. Virol. 1, 177–183. ( 10.1016/j.coviro.2011.05.005) [DOI] [PMC free article] [PubMed] [Google Scholar]
- 3.Ferguson NM, Galvani AP, Bush RM. 2003. Ecological and immunological determinants of influenza evolution. Nature 422, 428–433. ( 10.1038/nature01509) [DOI] [PubMed] [Google Scholar]
- 4.Koelle K, Cobey S, Grenfell B, Pascual M. 2006. Epochal evolution shapes the phylodynamics of interpandemic influenza A (H3N2) in humans. Science 314, 1898–1903. ( 10.1126/science.1132745) [DOI] [PubMed] [Google Scholar]
- 5.Taubenberger JK. 2006. Influenza hemagglutinin attachment to target cells: ‘birds do it, we do it…’. Future Virol. 1, 415–418. ( 10.2217/17460794.1.4.415) [DOI] [PMC free article] [PubMed] [Google Scholar]
- 6.Wrammert J, et al. 2011. Broadly cross-reactive antibodies dominate the human B cell response against 2009 pandemic H1N1 influenza virus infection. J. Exp. Med. 208, 181–193. ( 10.1084/jem.20101352) [DOI] [PMC free article] [PubMed] [Google Scholar]
- 7.Das SR, et al. 2013. Defining influenza A virus hemagglutinin antigenic drift by sequential monoclonal antibody selection. Cell Host Microbe 13, 314–323. ( 10.1016/j.chom.2013.02.008) [DOI] [PMC free article] [PubMed] [Google Scholar]
- 8.Schmidt C. 2013. Vaccines for pandemics. Nat. Biotechnol. 31, 957–960. ( 10.1038/nbt.2733) [DOI] [PubMed] [Google Scholar]
- 9.Brooke CB, Yewdell JW. 2013. Host versus flu: antibodies win a round? Nat. Struct. Mol. Biol. 20, 245–246. ( 10.1038/nsmb.2524) [DOI] [PMC free article] [PubMed] [Google Scholar]
- 10.Chiu C, Ellebedy AH, Wrammert J, Ahmed R. 2015. B cell responses to influenza infection and vaccination. Curr. Top. Microbiol. Immunol. 386, 381–398. [DOI] [PubMed] [Google Scholar]
- 11.Wrigley NG. 1979. Electron microscopy of influenza virus. Br. Med. Bull. 35, 35–38. [DOI] [PubMed] [Google Scholar]
- 12.Taylor HP, Armstrong SJ, Dimmock NJ. 1987. Quantitative relationships between an influenza virus and neutralizing antibody. Virology 159, 288–298. ( 10.1016/0042-6822(87)90466-1) [DOI] [PubMed] [Google Scholar]
- 13.Bouvier NM, Palese P. 2008. The biology of influenza viruses. Vaccine 26(Suppl. 4), D49–D53. ( 10.1016/j.vaccine.2008.07.039) [DOI] [PMC free article] [PubMed] [Google Scholar]
- 14.Webster RG, Bean WJ, Gorman OT, Chambers TM, Kawaoka Y. 1992. Evolution and ecology of influenza A viruses. Microbiol. Rev. 56, 152–179. [DOI] [PMC free article] [PubMed] [Google Scholar]
- 15.Air GM. 1981. Sequence relationships among the hemagglutinin genes of 12 subtypes of influenza A virus. Proc. Natl Acad. Sci. USA 78, 7639–7643. ( 10.1073/pnas.78.12.7639) [DOI] [PMC free article] [PubMed] [Google Scholar]
- 16.Nobusawa E, Aoyama T, Kato H, Suzuki Y, Tateno Y, Nakajima K. 1991. Comparison of complete amino acid sequences and receptor-binding properties among 13 serotypes of hemagglutinins of influenza A viruses. Virology 182, 475–485. ( 10.1016/0042-6822(91)90588-3) [DOI] [PubMed] [Google Scholar]
- 17.Wu Y, Wu Y, Tefsen B, Shi Y, Gao GF. 2014. Bat-derived influenza-like viruses H17N10 and H18N11. Trends Microbiol. 22, 183–191. ( 10.1016/j.tim.2014.01.010) [DOI] [PMC free article] [PubMed] [Google Scholar]
- 18.Okuno Y, Isegawa Y, Sasao F, Ueda S. 1993. A common neutralizing epitope conserved between the hemagglutinins of influenza A virus H1 and H2 strains. J. Virol. 67, 2552–2558. [DOI] [PMC free article] [PubMed] [Google Scholar]
- 19.Okuno Y, Matsumoto K, Isegawa Y, Ueda S. 1994. Protection against the mouse-adapted A/FM/1/47 strain of influenza A virus in mice by a monoclonal antibody with cross-neutralizing activity among H1 and H2 strains. J. Virol. 68, 517–520. [DOI] [PMC free article] [PubMed] [Google Scholar]
- 20.Throsby M, et al. 2008. Heterosubtypic neutralizing monoclonal antibodies cross-protective against H5N1 and H1N1 recovered from human IgM+ memory B cells. PLoS ONE 3, e3942 ( 10.1371/journal.pone.0003942) [DOI] [PMC free article] [PubMed] [Google Scholar]
- 21.Corti D, et al. 2010. Heterosubtypic neutralizing antibodies are produced by individuals immunized with a seasonal influenza vaccine. J. Clin. Invest. 120, 1663–1673. ( 10.1172/JCI41902) [DOI] [PMC free article] [PubMed] [Google Scholar]
- 22.Corti D, et al. 2011. A neutralizing antibody selected from plasma cells that binds to group 1 and group 2 influenza A hemagglutinins. Science 333, 850–856. ( 10.1126/science.1205669) [DOI] [PubMed] [Google Scholar]
- 23.Ekiert DC, Bhabha G, Elsliger MA, Friesen RHE, Jongeneelen M, Throsby M, Goudsmit J, Wilson IA. 2009. Antibody recognition of a highly conserved influenza virus epitope. Science 324, 246–251. ( 10.1126/science.1171491) [DOI] [PMC free article] [PubMed] [Google Scholar]
- 24.Ekiert DC, et al. 2011. A highly conserved neutralizing epitope on group 2 influenza A viruses. Science 333, 843–850. ( 10.1126/science.1204839) [DOI] [PMC free article] [PubMed] [Google Scholar]
- 25.Kucharski AJ, Lessler J, Read JM, Zhu H, Jiang CQ, Guan Y, Cummings DAT, Riley S. 2015. Estimating the life course of influenza A(H3N2) antibody responses from cross-sectional data. PLoS Biol. 13, e1002082 ( 10.1371/journal.pbio.1002082) [DOI] [PMC free article] [PubMed] [Google Scholar]
- 26.Francis T., Jr 1955. The current status of the control of influenza. Ann. Intern. Med. 43, 534–538. ( 10.7326/0003-4819-43-3-534) [DOI] [PubMed] [Google Scholar]
- 27.Francis T. 1960. On the doctrine of original antigenic sin. Am. Phil. Soc. 104, 572–578. [Google Scholar]
- 28.Davenport FM, Hennessy AV, Francis T., Jr 1953. Epidemiologic and immunologic significance of age distribution of antibody to antigenic variants of influenza virus. J. Exp. Med. 98, 641–656. ( 10.1084/jem.98.6.641) [DOI] [PMC free article] [PubMed] [Google Scholar]
- 29.Davenport FM, Hennessy AV. 1956. A serologic recapitulation of past experiences with influenza A; antibody response to monovalent vaccine. J. Exp. Med. 104, 85–97. ( 10.1084/jem.104.1.85) [DOI] [PMC free article] [PubMed] [Google Scholar]
- 30.Jensen KE, Davenport FM, Hennessy AV, Francis T., Jr 1956. Characterization of influenza antibodies by serum absorption. J. Exp. Med. 104, 199–209. ( 10.1084/jem.104.2.199) [DOI] [PMC free article] [PubMed] [Google Scholar]
- 31.Fazekas de St G, Webster RG. 1966. Disquisitions of original antigenic sin. I. Evidence in man. J. Exp. Med. 124, 331–345. ( 10.1084/jem.124.3.331) [DOI] [PMC free article] [PubMed] [Google Scholar]
- 32.Kim JH, Skountzou I, Compans R, Jacob J. 2009. Original antigenic sin responses to influenza viruses. J. Immunol. 183, 3294–3301. ( 10.4049/jimmunol.0900398) [DOI] [PMC free article] [PubMed] [Google Scholar]
- 33.Kim JH, Davis WG, Sambhara S, Jacob J. 2012. Strategies to alleviate original antigenic sin responses to influenza viruses. Proc. Natl Acad. Sci. USA 109, 13 751–13 756. ( 10.1073/pnas.0912458109) [DOI] [PMC free article] [PubMed] [Google Scholar]
- 34.Lessler J, Riley S, Read JM, Wang S, Zhu H, Smith GJD, Guan Y, Jiang CQ, Cummings DAT. 2012. Evidence for antigenic seniority in influenza A (H3N2) antibody responses in southern China. PLoS Pathog. 8, e1002802 ( 10.1371/journal.ppat.1002802) [DOI] [PMC free article] [PubMed] [Google Scholar]
- 35.Fonville JM, et al. 2014. Antibody landscapes after influenza virus infection or vaccination. Science 346, 996–1000. ( 10.1126/science.1256427) [DOI] [PMC free article] [PubMed] [Google Scholar]
- 36.Tan GS, Lee PS, Hoffman RMB, Mazel-Sanchez B, Krammer F, Leon PE, Ward AB, Wilson IA, Palese P. 2014. Characterization of a broadly neutralizing monoclonal antibody that targets the fusion domain of group 2 influenza A virus hemagglutinin. J. Virol. 88, 13 580–13 592. ( 10.1128/JVI.02289-14) [DOI] [PMC free article] [PubMed] [Google Scholar]
- 37.Wei CJ, et al. 2010. Induction of broadly neutralizing H1N1 influenza antibodies by vaccination. Science 329, 1060–1064. ( 10.1126/science.1192517) [DOI] [PubMed] [Google Scholar]
- 38.Kanekiyo M, et al. 2013. Self-assembling influenza nanoparticle vaccines elicit broadly neutralizing H1N1 antibodies. Nature 499, 102–106. ( 10.1038/nature12202) [DOI] [PMC free article] [PubMed] [Google Scholar]
- 39.Krammer F, Pica N, Hai R, Margine I, Palese P. 2013. Chimeric hemagglutinin influenza virus vaccine constructs elicit broadly protective stalk-specific antibodies. J. Virol. 87, 6542–6550. ( 10.1128/JVI.00641-13) [DOI] [PMC free article] [PubMed] [Google Scholar]
- 40.Margine I, et al. 2013. Hemagglutinin stalk-based universal vaccine constructs protect against group 2 influenza A viruses. J. Virol. 87, 10 435–10 446. ( 10.1128/JVI.01715-13) [DOI] [PMC free article] [PubMed] [Google Scholar]
- 41.Krammer F, Margine I, Hai R, Flood A, Hirsh A, Tsvetnitsky V, Chen D, Palese P. 2014. H3 stalk-based chimeric hemagglutinin influenza virus constructs protect mice from H7N9 challenge. J. Virol. 88, 2340–2343. ( 10.1128/JVI.03183-13) [DOI] [PMC free article] [PubMed] [Google Scholar]
- 42.Ellebedy AH, et al. 2014. Induction of broadly cross-reactive antibody responses to the influenza HA stem region following H5N1 vaccination in humans. Proc. Natl Acad. Sci. USA 111, 13 133–13 138. ( 10.1073/pnas.1414070111) [DOI] [PMC free article] [PubMed] [Google Scholar]
- 43.Nachbagauer R, Wohlbold TJ, Hirsh A, Hai R, Sjursen H, Palese P, Cox RJ, Krammer F. 2014. Induction of broadly reactive anti-hemagglutinin stalk antibodies by an H5N1 vaccine in humans. J. Virol. 88, 13 260–13 268. ( 10.1128/JVI.02133-14) [DOI] [PMC free article] [PubMed] [Google Scholar]
- 44.Arinaminpathy N, Ratmann O, Koelle K, Epstein SL, Price GE, Viboud C, Miller MA, Grenfell BT. 2012. Impact of cross-protective vaccines on epidemiological and evolutionary dynamics of influenza. Proc. Natl Acad. Sci. USA 109, 3173–3177. ( 10.1073/pnas.1113342109) [DOI] [PMC free article] [PubMed] [Google Scholar]
- 45.Antia R, Levin BR, May RM. 1994. Within-host population-dynamics and the evolution and maintenance of microparasite virulence. Am. Nat. 144, 457–472. ( 10.1086/285686) [DOI] [Google Scholar]
- 46.Oprea M, Perelson AS. 1996. Exploring the mechanisms of primary antibody responses to T cell-dependent antigens. J. Theor. Biol. 181, 215–236. ( 10.1006/jtbi.1996.0127) [DOI] [PubMed] [Google Scholar]
- 47.Slifka MK, Antia R, Whitmire JK, Ahmed R. 1998. Humoral immunity due to long-lived plasma cells. Immunity 8, 363–372. ( 10.1016/S1074-7613(00)80541-5) [DOI] [PubMed] [Google Scholar]
- 48.Hovden AO, Cox RJ, Haaheim LR. 2005. Whole influenza virus vaccine is more immunogenic than split influenza virus vaccine and induces primarily an IgG2a response in BALB/c mice. Scand. J. Immunol. 62, 36–44. ( 10.1111/j.1365-3083.2005.01633.x) [DOI] [PubMed] [Google Scholar]
- 49.Taylor HP, Dimmock NJ. 1994. Competitive binding of neutralizing monoclonal and polyclonal IgG to the HA of influenza A virions in solution: only one IgG molecule is bound per HA trimer regardless of the specificity of the competitor. Virology 205, 360–363. ( 10.1006/viro.1994.1653) [DOI] [PubMed] [Google Scholar]
- 50.Poumbourios P, Brown LE, White DO, Jackson DC. 1990. The stoichiometry of binding between monoclonal antibody molecules and the hemagglutinin of influenza virus. Virology 179, 768–776. ( 10.1016/0042-6822(90)90144-G) [DOI] [PubMed] [Google Scholar]
- 51.Hilborn R, Mangel M. 1997. The ecological detective: confronting models with data. Monographs in population biology 28 Princeton, NJ: Princeton University Press. [Google Scholar]
- 52.May RM. 2004. Uses and abuses of mathematics in biology. Science 303, 790–793. ( 10.1126/science.1094442) [DOI] [PubMed] [Google Scholar]
- 53.Gerhard W, Yewdell J, Frankel ME, Webster R. 1981. Antigenic structure of influenza virus haemagglutinin defined by hybridoma antibodies. Nature 290, 713–717. ( 10.1038/290713a0) [DOI] [PubMed] [Google Scholar]
- 54.Kepler TB, Perelson AS. 1993. Cyclic re-entry of germinal center B cells and the efficiency of affinity maturation. Immunol. Today 14, 412–415. ( 10.1016/0167-5699(93)90145-B) [DOI] [PubMed] [Google Scholar]
- 55.Zhang Y, et al. 2013. Germinal center B cells govern their own fate via antibody feedback. J. Exp. Med. 210, 457–464. ( 10.1084/jem.20120150) [DOI] [PMC free article] [PubMed] [Google Scholar]
- 56.Handel A, Longini IM, Jr, Antia R. 2010. Towards a quantitative understanding of the within-host dynamics of influenza A infections. J. R. Soc. Interface 7, 35–47. ( 10.1098/rsif.2009.0067) [DOI] [PMC free article] [PubMed] [Google Scholar]
- 57.Baccam P, Beauchemin C, Macken CA, Hayden FG, Perelson AS. 2006. Kinetics of influenza A virus infection in humans. J. Virol. 80, 7590–7599. ( 10.1128/JVI.01623-05) [DOI] [PMC free article] [PubMed] [Google Scholar]
- 58.Saenz RA, et al. 2010. Dynamics of influenza virus infection and pathology. J. Virol. 84, 3974–3983. ( 10.1128/JVI.02078-09) [DOI] [PMC free article] [PubMed] [Google Scholar]
- 59.Amanna IJ, Carlson NE, Slifka MK. 2007. Duration of humoral immunity to common viral and vaccine antigens. N. Engl. J. Med. 357, 1903–1915. ( 10.1056/NEJMoa066092) [DOI] [PubMed] [Google Scholar]
Associated Data
This section collects any data citations, data availability statements, or supplementary materials included in this article.