

Abstract
Speciation and temperature measurements of methane oxidation during a nanosecond repetitively pulsed discharge in a low-temperature flow reactor have been performed. Measurements of temperature and formaldehyde during a burst of pulses were made on a time-dependent basis using tunable diode laser absorption spectroscopy, and measurements of all other major stable species were made downstream of a continuously pulsed discharge using gas chromatography. The major species for a stoichiometric methane/oxygen/helium mixture with 75% dilution are H2O, CO, CO2, H2, CH2O, CH3OH, C2H6, C2H4 and C2H2. A modelling tool to simulate homogeneous plasma combustion kinetics is assembled by combining the ZDPlasKin and CHEMKIN codes. In addition, a kinetic model for plasma-assisted combustion (HP-Mech/plasma) of methane, oxygen and helium mixtures has been assembled to simulate the measurements. Predictions can accurately capture reactant consumption as well as production of the major product species. However, significant disagreement is found for minor species, particularly CH2O and CH3OH. Further analysis revealed that the plasma-activated low-temperature oxidation pathways, particularly those involving CH3O2 radical reactions and methane reactions with O(1D), are responsible for this disagreement.
Keywords: ignition, non-equilibrium plasma, plasma-assisted combustion, methane oxidation
1. Introduction
The chemical behaviour of fuel oxidation in plasma-assisted combustion (PAC) has received increased attention in the light of experimental evidence suggesting that both the thermal and kinetic enhancement mechanisms are important in the context of ignition and flame stabilization [1–3]. To understand the detailed mechanism of PAC, the chemical kinetic pathways activated by the plasma discharge must be investigated and their reaction rates quantified, starting with reaction mechanisms for the simplest fuels such as hydrogen and methane. However, the development of such mechanisms poses a significant challenge, because of both the complexity of the reaction system and the lack of experimental data to explore and identify the chemical kinetic pathways at temperatures far below conventional combustion temperature. Some global data do exist, for example, ignition delay times in shock tubes [4–9] and extinction limits in counterflow diffusion flames [10–13]; however, measurements of species distributions in and after the plasma are less common [14–20]. Only time-dependent speciation histories in a well-defined reaction system can constrain the kinetic mechanism sufficiently to identify the major reaction pathways, and provide validation targets for kinetic mechanism development [21].
Our previous study of ethylene PAC in a room-temperature flow reactor [14] demonstrated the strong dependence of species concentrations on low-temperature reaction pathways, which proceeded primarily through O, OH and O2 addition reactions. Recent experiments on plasma-activated cool flames of dimethyl ether and n-heptane further demonstrated the importance of plasma-activated low-temperature chemistry in kinetic combustion enhancement by plasma [13,22]. It was found that the reactions involving low-temperature fuel oxidation are critical for predicting the experimental measurements of PAC. Thus, in order to extend our understanding of fuel oxidation in low-temperature PAC, and to resolve the issues observed in our previous studies, we focus our study on the oxidation kinetics of the simplest hydrocarbon fuel, methane.
Previous studies of methane oxidation in plasma have been conducted in various experimental and numerical platforms, including shock tubes [4–6], counterflow flames [11,12] and flow reactors [16–19]. In addition, there have been extensive studies of plasma fuel reforming using methane [23–31]. Plasma reforming of methane has shown the potential to efficiently produce hydrogen and/or syngas [24,26–28,31], methanol [25] and higher hydrocarbons [23]. Recent studies of dry reforming and partial oxidation of methane in a heated flow reactor with a dielectric barrier discharge (DBD) driven by an AC voltage waveform [29,30] revealed several interesting results. First, fuel reforming was significantly more efficient for the oxidation case compared with the dry reforming case. Second, while overall CH4 and O2 conversion is increased with initial temperature, reduced electric field (E/N) and plasma power (i.e. frequency of the AC field), only the initial temperature could affect the product selectivity. Modelling of the combustion chemistry (assuming some initial radical concentrations from the plasma) indicated that increased temperatures increased the rate of H abstraction from CH4 by O, OH and H radicals, which lead to subsequent reactions of fuel intermediates with O2, increasing the overall fuel and oxidizer conversion. However, no quantitative comparison with the measured species concentrations could be made owing to the lack of electron collision processes in the model, which has generally limited the analysis of plasma-based fuel conversion systems. Some recent work in PAC has made steps towards more quantitative modelling of the oxidation process.
In shock tubes, Kosarev et al. [4] measured ignition delays after a fast ionization wave in CH4/O2/Ar mixtures at initial temperatures from 1230 to 1719 K and pressures from 0.3 to 1.1 bar, finding that the ignition delay can be shortened by a factor of 30 using a nanosecond pulsed plasma, an enhancement that could not be replicated by assuming all plasma energy went to gas heating. Numerical modelling of the ignition process, including separate consideration of the electron collision processes and combustion kinetics, revealed that the plasma-produced species were mostly quenched to form neutral radicals, particularly O atoms, which then reacted with CH4 and its intermediates, resulting in the initiation of chain branching chemistry. However, no comparison between the actual species produced and the model prediction was made in this study.
Lou et al. [16] studied oxidation of methane/air mixtures in a nanosecond repetitively pulsed (NRP) discharge in a homogeneous flow reactor at initial temperature 290 K and pressure less than 100 Torr. For continuously pulsed plasma, it was found that up to 70% of the fuel could be consumed, producing approximately 500 K temperature rise, without any flame. This indicated that PAC could control fuel oxidation continuously, without any clear transition between ignition and frozen flow. Further studies in a similar reactor [17–19] measured temperature, NO, O and OH. In comparison with air plasmas, the addition of methane did not affect the NO concentration profile or the peak O concentration. There was, however, a decrease in the peak OH concentration, and there was a significant increase in the O and OH consumption rates after the plasma, indicating that reactions were indeed occurring between methane and/or its intermediates with radicals formed in the plasma. Modelling of the PAC processes could predict temperature and O atom concentration simultaneously, but different combustion kinetic models had mixed results predicting the OH profile, indicating the sensitivity of combustion kinetics at the relatively low temperatures in these experiments (less than 600 K).
In counterflow flames, Sun et al. [11] found that the extinction limits of a partially premixed CH4/O2/Ar mixture could be extended by more than a factor of 2 when a nanosecond pulsed discharge is applied to the mixture just before the exit of the fuel nozzle. The main cause was found to be prompt reforming of the fuel stream to a mixture of heated H2, CH2O, CO, CO2 and H2O, which was initiated by electron dissociation reactions in the plasma. Modelling efforts found that O and CH2O concentrations were well predicted, but the concentrations of H2, CO, CO2 and H2O could not be matched by the model predictions. Sun et al. [12] later integrated the plasma discharge directly into the counterflow burner such that the plasma was stabilized between the burner nozzles. In this experiment, it was found that the hysteresis between ignition and extinction could be smoothed into a continuous transition. The reason for this change was again the activation of methane oxidation by radical-produced O atoms, which initiated chain branching reactions at temperatures below the cross-over temperature for hot ignition, thus allowing chemical heat extraction at methane concentrations too small to otherwise sustain a flame.
To summarize: it has been found that a continuous transition from non-reacting to fully reacted methane/oxygen/diluents mixtures can be achieved by controlling the plasma parameters and mixture composition. The cause of this continuous transition is electron collision reactions producing a mixture of electronically excited species, ions and atoms, all of which quickly quench to form mostly O atoms, but also H atoms and OH radicals. These radicals will react with the fuel and fuel intermediates and, depending on the temperature, can lead to ignition of the mixture or to partial oxidation. While the power and E/N of the plasma affect the overall amount of fuel conversion, the product species composition is largely controlled by the chemical kinetics of combustion reactions at low temperature (300–700 K). However, a quantitative study of simultaneous temperature and multi-species concentrations in low-temperature methane PAC is still lacking, and the model predictability in terms of speciation data is limited, preventing a full assessment of the relevant reaction pathways.
The purpose of this study is to quantitatively measure species production and temperature in a homogeneous plasma discharge, and compare these results with kinetic modelling, focusing on the low-temperature initiation reactions. To accomplish this, a plasma produced with an NRP power supply in a dual DBD configuration is used, and is operated in both a pulse burst mode and continuous mode. In situ and time-dependent measurements of temperature and CH2O are performed using laser absorption spectroscopy (LAS) in a mini-Herriott cell during a 300 pulse burst. CH2O was identified to be a major intermediate species directly produced by plasma-generated O atoms [4,11,12], and is thus an ideal candidate to determine the fidelity of the initial oxidation reactions. In addition, temperature and species concentration were measured for a continuous discharge in order to gain a more complete understanding of the kinetic processes involved. These results are compared with modelling of the coupled plasma and chemical kinetic processes, including electron collision reactions, excited and ionized species quenching, and low-temperature methane oxidation kinetics.
2. Experimental set-up
(a). Plasma reactor
The experimental set-up has been previously described in [14,32–34]. A diagram of the set-up can be found in figure 1. All experiments were conducted at a total pressure of 60 Torr and initial temperature of 296 K. The mixture used is 0.083 CH4, 0.167 O2, 0.75 He (stoichiometric, 75% dilution), flowing at a velocity of 0.2 m s−1. All gases are metered by mass flow controllers, and the streams are mixed before entering the reactor. The reactor is a quartz and Macor rectangular cell, 14 mm in height, 45 mm in width and 152 mm in length, which is placed inside a larger stainless steel vacuum chamber (not shown in figure 1). One sidewall is quartz, which allowed observation into the cell for laser alignment, whereas the other is Macor ceramic, used for easy machining. Two 45×45 mm stainless steel electrodes are sandwiched between the pairs of quartz plates which make up the top and bottom of the reactor, forming a plane-to-plane double DBD with barrier thickness of 1.6 mm. The plasma is produced using a nanosecond pulsed power supply (FID GmbH, FPG 30-50MC4), which has a maximum repetition frequency of 30 kHz, FWHM of 12 ns and maximum peak voltage of 32 kV. An average peak voltage of 8.76 kV was used for all experiments presented in this work, which results in a peak applied electric field of 5.94 kV cm−1. The discharge pulses can be applied in either a continuous mode or a pulse burst mode via external triggering with a digital pulse generator (SRS DG535). Helium was used as the diluent gas owing to the large radius of the streamers formed in the plasma [35], which overlap with each other at 60 Torr, allowing the plasma to stay homogeneous even for continuous pulsing at high frequencies (up to 30 kHz). The current during the nanosecond discharge was measured using a Pearson coil current probe (model 6585), and the voltage externally applied to the discharge was measured using a Lecroy high-voltage probe (PPE20KV). The energy deposition per pulse is found to be 1.5±0.2 mJ, which was calculated by integrating the power (voltage×current) over a single pulse during continuous discharge. The applied electric field is computed using the equation Eapp=Vapp/(L+2l/ε), where Eapp is the applied electric field, Vapp is the measured peak applied voltage, L is the gap distance (14 mm), l is the dielectric layer thickness (1.6 mm) and ε is the dielectric constant (4.3 for quartz) [36,37].
Figure 1.

Diagram of experimental set-up. (Online version in colour.)
Sampling measurements were made using a gas chromatograph (GC) coupled with a thermal conductivity detector (TCD; Inficon 3000) to identify and quantify product species resulting from a continuously pulsed plasma discharge in the range of 100–30 000 Hz. Species sampling was performed using a quartz probe placed at the exit of the quartz reactor, and sample gas was drawn out of the reactor and through a heated line into the sample vessel using a vacuum pump. The sample vessel is fitted with a piston such that the pressure can be increased to 1 atm, which is required for injection to the GC. The sensitivity for all species other than H2 is 10 ppm, whereas H2 interferes with the large He peak from the diluents, limiting the sensitivity to about 1000 ppm. The uncertainty for GC-TCD quantification is assumed to be 5% for all species, not including uncertainties from the sampling procedure.
(b). Mid-IR laser absorption spectroscopy system
A continuous-wave external-cavity mode hop-free (CW-EC-MHF) quantum cascade laser (QCL) from Daylight Solutions and a distributed feedback (DFB) QCL from Alpes Lasers (sbcw3176) are used in the present in situ species and temperature measurements. The absorption lines used for methane and temperature quantification with the EC-QCL are located at 1343.56 and 1343.63 cm−1, and the line for CH2O quantification with the DFB-QCL is at 1726.79 cm−1. The two lines used for temperature measurement were selected following the guidelines of Farooq et al. [38]. As presented in figure 1, the two lasers are co-aligned and coupled into the 24-pass Herriott cell such that either laser can be used individually by flipping a mirror, allowing convenient measurements without realignment of the cell. The Herriott cell is made up of two opposed 12.7 mm OD, 50 mm focal length protected gold concave mirrors, which are located 30 mm downstream of the front edge of the electrodes. The laser light is coupled into the cell through a 2 mm hole in a stationary mirror in the quartz wall, and cell alignment is accomplished with the help of a two-dimensional tilt stage (Thorlabs KMS) fixed to the Macor wall. The effective laser path length through the plasma is 1.08 m. The transmitted output beams are incident on a mercury cadmium telluride (MCT) detector (Vigo PVM-2TE10.6). In order to eliminate atmospheric water absorption outside the test section, the laser path is purged with nitrogen.
The EC-QCL laser is scanned through the absorption lines by a 100 Hz sinusoidal signal sent to the controller for the piezo-electric actuator in the laser cavity (Thorlabs MDT694A) via an arbitrary function generator (SRS DS345). In the time-dependent measurements, the laser scan was timed such that the absorption peak occurred at a controllable delay after the first plasma discharge pulse. The absorption signal used for quantification was averaged over 50 plasma burst experiments. To scan the DFB-QCL, the laser temperature is held constant while the current is swept by a triangle waveform at a rate of 15 000 Hz. This allowed all time-dependent CH2O data points to be collected in a single scan, with an absorption measurement taken between every plasma pulse, and averaged over 100 experiments. The current controller for the DFB-QCL is a Wavelength Electronics QCL1000, the thermoelectric temperature controller is an ILX Lightwave LDT-5980 and the laser is housed in an ILX Lightwave LDM-4872 QCL mount. The wavelength scan rate of both lasers is monitored using a 50.8 mm germanium etalon (free spectral range, FSR≈0.74 GHz at 1345 cm−1). Owing to inconsistency in scan rates for the EC-QCL, the etalon signal is collected for every experiment. All signals are recorded on a Tektronix DPO 7104C oscilloscope.
The direct absorption profile at different conditions of temperature and pressure can be modelled using data from HITRAN [39]. Owing to a lack of available measurements for the line broadening properties of helium, the pressure broadening coefficient was treated as a variable parameter, along with the absorber concentration, in a least-squares nonlinear fitting algorithm for calculating the Voigt function [40,41]. The temperature was calculated by scanning over two different absorption lines of methane at the same delay after the pulse burst, and iteratively computing the temperature until the measured concentration is the same for both lines.
3. Numerical methods
(a). Plasma-assisted combustion solver
Numerical computations have been used to investigate the influence of non-equilibrium plasma generated by NRP discharges on the homogeneous ignition and related kinetics of different combustible mixtures. Electrons, ions and electronically excited levels of molecules are included in the detailed chemical model, and electron impact excitation, dissociation and ionization processes are considered. The code couples the commercially available zero-dimensional plasma kinetics solver ZDPlasKin [42] with the CHEMKIN [43] package. During the discharge processes, ZDPlasKin employs a Boltzmann equation solver [44] to calculate the electron temperature and reaction rates based on the input list of electron impact reaction cross sections. The cross-section data can be downloaded from the online database LXCat (http://nl.lxcat.net/home/). After each discharge pulse, CHEMKIN is used to calculate the thermal properties and chemical reaction rates at the conditions output by ZDPlasKin, and the species and temperature equations are integrated using a VODE [45] solver. At each interface between the two processes, a matrix including the values of time, temperature and species concentrations is used to transfer information.
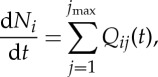
The ZDPlasKin model considers a non-equilibrium system with electron temperature much higher than gas temperature, whereas ion temperature is not considered. During the discharge process, the time evolution of species i through imax is computed using the equation [42]
 |
3.1 |
where Ni represents the number density of species i, Qij represents the source rates of species i corresponding to different reactions j, and imax and jmax are the total number of species and reactions considered in the model, respectively. Gas heating in the discharge is computed using the method of Flitti & Pancheshnyi [46], which distributes the external power deposited to the gas, denoted Pext, into three channels: the translational degree of freedom of electrons Pelec, the translational degree of freedom of the gas Pgas and the internal degree of freedom of the gas Pchem,
| 3.2 |
The gas temperature can then be computed considering energy deposition into all three channels using the following equations [42]
 |
3.3 |
| 3.4 |
| 3.5 |
 |
3.6 |
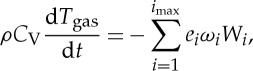
where γ is the specific heat ratio, kB is the Boltzmann constant, Tgas is the gas temperature, e is the elementary charge, Ne is the electron number density, υe is the electron drift velocity, E is the electric field, Te is the effective electron temperature and Qi is the potential energy of species i. During the interpulse time, CHEMKIN computes species evolution and heat addition for the constant-volume system using
| 3.7 |
and
 |
3.8 |
where ρ is gas density, Yi is the mass fraction of species i, t is time, ωi is the production or consumption rate of species i, Wi is the molecular weight of species i, CV is the specific heat of the gas at constant volume and ei is the internal energy for species i in mass units. In addition to gas heating, a heat loss term must be included to accurately predict the measured temperature profiles. Adamovich et al. [47] reported that the energy loss is primarily due to conduction to the quartz channel walls. In this zero-dimensional model, the heat loss is described by incorporating a conduction heat transfer term into the energy equation,
 |
3.9 |
where λ(Tgas) is the thermal conductivity as a function of gas temperature, Twall is the wall temperature, L is the channel height and L/π is the spatial scale for conduction heat transfer with uniform generation in the rectangular geometry.
(b). Kinetic model
The kinetic model can be separated into two parts: the combustion kinetic model and the plasma kinetic model. While excited species quenching reactions, electron–ion recombination reactions and charge exchange reactions are needed in both models, the excitation and ionization electron collision reactions are limited to the plasma model, whereas the combustion chemistry involving reactions of neutral ground-state species are mostly limited to the combustion model. The combustion model employed here is HP-Mech, previously described and available in [14], which includes hydrocarbon reactions for up to four-carbon chain length molecules, and is specifically designed for high-pressure and low-temperature (less than 800 K) chemistry. The plasma model has been assembled primarily from an air plasma model [42,48], with helium reactions from [11,49] and methane reactions from [4,11]. Included excited and ionized species are  , O2(C3Δu),
 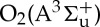 (all grouped as O2(4.5 eV) by analogy with [4]); O2(a1Δg);
  ;
;  ; O(1D); O(1S); O+; He(2s 1S); He+;
  ;
;  ; CH
; CH . Vibrationally excited species are neglected because their energy is insufficient to lead to dissociation of molecules and thus are not of significant kinetic importance in the present mixture. In terms of energy addition, at the reduced electric fields of this study, energy coupling into the plasma is strongly branched towards electronic excitation and ionization, with a relatively small amount being coupled into the vibrational states of molecules [46]. Thus, from both a kinetic and thermal perspective, it is reasonable to neglect the vibrational levels of O2 and CH4. In addition, negative ions and complex positive ions are neglected owing to their relatively low concentrations and short lifetimes in the present plasma. The electron collision cross sections for O2 and He are downloaded from the LXCat online database from the Phelps and Biagi databases, respectively [50,51], and cross sections for CH4 are computed by the method described by Janev & Reiter [52]. Comparisons of the electron collision cross sections among the databases available from LXCat are in agreement for total excitation and ionization of He and O2 [53]. However, there is some discrepancy for cross sections into particular excitation levels of O2. The Phelps database [50] was selected in this model owing to its use as the basis of many of the other datasets in the literature [54,55]. Electron collision reactions are not considered for any intermediate species because of their low concentration when compared with the reactants and helium. The plasma model is listed in table 1, and is included in the electronic supplementary material, along with the full combustion model.
Table 1.
Plasma kineticmodel for CH4/O2/He mixtures.
| equation | reaction | rate constant (cm3 s−1) | references |
|---|---|---|---|
| electron impact excitation | |||
| (3.10) | e+O2→e+O2(a1Δg) | σ | [50] |
| (3.11) |  |
σ | [50] |
| (3.12) | e+O2→e+O2(4.5 eV) | σ | [50] |
| (3.13) | e+He→e+He(2s 1S) | σ | [51] |
| electron impact dissociative excitation | |||
| (3.14) | e+O2→e+O+O | σ | [50] |
| (3.15) | e+O2→e+O+O(1D) | σ | [50] |
| (3.16) | e+O2→e+O+O(1S) | σ | [50] |
| (3.17) | e+CH4→e+CH3+H | σ | [52] |
| (3.18) | e+CH4→e+CH2+H2 | σ | [52] |
| (3.19) | e+CH4→e+CH+H2+H | σ | [52] |
| (3.20) | e+CH4→e+C+2H2 | σ | [52] |
| electron impact ionization and dissociative ionization | |||
| (3.21) |  |
σ | [50] |
| (3.22) | e+He→e+e+He+ | σ | [51] |
| (3.23) |  |
σ | [52] |
| (3.24) |  |
σ | [52] |
| quenching of excited O2 | |||
| (3.25) |  |
1.40×10⁻¹⁸ | [56] |
| (3.26) |  |
6.14×10⁻¹²exp(−17900/T) | [57] |
| (3.27) |  |
1.08×10⁻¹³ | [58] |
| (3.28) |  |
1.08×10⁻¹³ | est. |
| (3.29) |  |
8.00×10⁻²¹ (T/300)0.5 | [49] |
| (3.30) |  |
1.00×10⁻¹⁷ (T/300)0.5 | [49] |
| (3.31) | O2(4.5 eV)+He→O2(a1Δg)+He | 1.00×10⁻¹³ | [59] |
| (3.32) |  |
9.00×10⁻¹³ | [59] |
| (3.33) |  |
6.30×10⁻³³ | [59] |
| (3.34) |  |
1.00×10⁻³² | [59] |
| (3.35) |  |
7.00×10⁻¹⁶ | [48] |
| (3.36) |  |
3.80×10⁻¹⁸ exp(−205/T) | [48] |
| (3.37) |  |
5.20×10⁻¹¹ exp(−2840/T) | [48] |
| (3.38) |  |
7.00×10⁻²⁸T3.8 exp(700/T) | [48] |
| (3.39) |  |
8.10×10⁻¹⁴ | [48] |
| (3.40) |  |
3.40×10⁻¹¹ (300/T)0.1 exp(−4200/T) | [48] |
| (3.41) |  |
4.30×10⁻²²T2.4 exp(−281/T) | [48] |
| (3.42) |  |
2.20×10⁻¹¹ | [48] |
| (3.43) | O2(4.5 eV)+O→O2+O(1S) | 9.00×10⁻¹² | [48] |
| (3.44) |  |
3.00×10⁻¹³ | [48] |
| quenching of excited O | |||
| (3.45) |  |
1.13×10⁻¹⁰ | [60] |
| (3.46) |  |
3.00×10⁻¹¹ | [60] |
| (3.47) |  |
7.50×10⁻¹² | [60] |
| (3.48) | O(1D)+He→O+He | 1.00×10⁻¹³ | [49] |
| (3.49) | O(1D)+O→O+O | 8.00×10⁻¹² | [48] |
| (3.50) |  |
6.40×10⁻¹² exp(67/T) | [48] |
| (3.51) |  |
1.00×10⁻¹² | [48] |
| (3.52) |  |
2.60×10⁻¹¹ exp(67/T) | [48] |
| (3.53) | O(1D)+O3→O2+O+O | 1.20×10⁻¹⁰ | [48] |
| (3.54) | 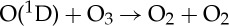 |
1.20×10⁻¹⁰ | [48] |
| (3.55) | O(1S)+O→O(1D)+O | 5.00×10⁻¹¹ exp(−300/T) | [61] |
| (3.56) |  |
1.30×10⁻¹² exp(−850/T) | [61] |
| (3.57) | O(1S)+O2→O+O+O | 3.00×10⁻¹² exp(−850/T) | [61] |
| (3.58) |  |
1.10×10⁻¹⁰ | [61] |
| (3.59) |  |
2.90×10⁻¹¹ | [61] |
| (3.60) | O(1S)+O2(a1Δg)→O+O+O | 3.20×10⁻¹¹ | [61] |
| (3.61) |  |
2.90×10⁻¹⁰ | [61] |
| (3.62) |  |
2.90×10⁻¹⁰ | [61] |
| quenching of excited He | |||
| (3.63) |  |
5.60×10⁻¹³ | [11] |
| (3.64) |  |
7.90×10⁻¹² | [62] |
| (3.65) |  |
8.30×10⁻¹² | [62] |
| (3.66) |  |
7.10×10⁻¹³ | [62] |
| (3.67) | He(2s 1S)+He(2s 1S)→He+He++e | 1.00×10⁻⁹ (T/300)0.5 | [49] |
| (3.68) |  |
2.54×10⁻¹⁰ (T/300)0.5 | [49] |
| (3.69) |  |
2.54×10⁻¹⁰ (T/300)0.5 | [49] |
| (3.70) |  |
2.54×10⁻¹⁰ (T/300)0.5 | [49] |
| (3.71) | He(2s 1S)+O→O++He+e | 2.54×10⁻¹⁰ (T/300)0.5 | [49] |
| (3.72) | He(2s 1S)+O(1D)→O++He+e | 2.54×10⁻¹⁰ (T/300)0.5 | [49] |
| (3.73) | He(2s 1S)+O(1S)→O++He+e | 2.54×10⁻¹⁰ (T/300)0.5 | [49] |
| electron–ion recombination | |||
| (3.74) |  |
5.11×10⁻⁸ (300/Te)0.7 | [63] |
| (3.75) |  |
8.48×10⁻⁸ (300/Te)0.7 | [63] |
| (3.76) |  |
5.02×10⁻⁸ (300/Te)0.7 | [63] |
| (3.77) |  |
7.90×10⁻⁹ (300/Te)0.7 | [63] |
| (3.78) | e+O++e→O+e | 7.00×10⁻²⁰ (300/Te)4.5 | [48] |
| (3.79) | e+O++M→O+M | 6.00×10⁻²⁷ (300/Te)1.5 | [48] |
| (3.80) | e+He+→He(2s 1S) | 6.76×10⁻¹³T−0.5e | [49] |
| (3.81) | e+e+He+→He(2s 1S)+e | 5.12×10⁻²⁷T−4.5e | [49] |
| (3.82) |  |
1.70×10⁻⁷ (300/Te)0.5 | [63] |
| (3.83) |  |
1.70×10⁻⁷ (300/Te)0.5 | [63] |
| (3.84) |  |
3.50×10⁻⁷ (300/Te)0.5 | [63] |
| (3.85) |  |
2.50×10⁻⁷ (300/Te)0.5 | [63] |
| charge exchange | |||
| (3.86) |  |
2.00×10⁻¹¹ (300/T)0.5 | [48] |
| (3.87) |  |
1.00×10⁻¹⁰ | [48] |
| (3.88) | He++O2→O++O+He | 1.07×10⁻⁹ (T/300)0.5 | [49] |
| (3.89) |  |
1.07×10⁻⁹ (T/300)0.5 | [49] |
| (3.90) |  |
3.30×10⁻¹¹ (T/300)0.5 | [49] |
| (3.91) |  |
1.07×10⁻⁹ (T/300)0.5 | [49] |
| (3.92) |  |
3.30×10⁻¹¹ (T/300)0.5 | [49] |
| (3.93) | He++O→O++He | 5.00×10⁻¹¹ (T/300)0.5 | [49] |
| (3.94) | He++O(1D)→O++He | 5.00×10⁻¹¹ (T/300)0.5 | [49] |
| (3.95) | He++O(1S)→O++He | 5.00×10⁻¹¹ (T/300)0.5 | [49] |
| (3.96) |  |
5.00×10⁻¹⁰ | [4] |
| optical transitions and pre-dissociation | |||
| (3.97) |  |
2.60×10⁻⁴ | [48] |
| (3.98) |  |
1.50×10⁻³ | [48] |
| (3.99) |  |
8.50×10⁻² | [48] |
| (3.100) | O2(4.5eV)→O2 | 1.10×101 | [48] |
| O3 reactions | |||
| (3.101) | O3+O2→O2+O+O2 | 2.51×10⁻¹⁰ exp(−11600/T) | [48] |
| (3.102) | O3+O→O2+O+O | 4.15×10⁻¹⁰ exp(−11430/T) | [48] |
| (3.103) | O3+O→O2+O2(a1Δg) | 1.00×10⁻¹¹ exp(−2300/T) | [48] |
| (3.104) | O+O2+O2→O3+O2 | 7.60×10⁻³⁴ (300/T)1.9 | [48] |
| (3.105) | O+O2+O→O3+O | 3.90×10⁻³³ (300/T)1.9 | [48] |
| (3.106) | O+O2+He→O3+He | 3.40×10⁻³⁴ (300/T)1.2 | [49] |
4. Results
In order to model the discharge process, a reduced electric field (E/N) profile as a function of time and an initial electron number density must be supplied as inputs to the ZDPlasKin part of the solver. Because the one-dimensional solution for charge separation in an electric field is not solved, it is not possible to calculate the reduced electric field a priori from the applied voltage waveform. Thus, in order to provide E/N, a square wave was assumed, and the peak E/N and discharge duration were adjusted to bring the temperature prediction into approximate agreement with the measurement, which resulted in an E/N of 180 Td (townsend, 1 Td=10−17 V cm2) and a discharge time of 3–4 ns, which needed to be adjusted to keep total energy addition per pulse constant as gas temperature increased. In our previous publication [14], the concentration of a major intermediate species was used to fit E/N because this species was only sensitive to the reaction rate of electron dissociative ionization of the fuel. In this case, temperature is used as the fitting parameter for E/N owing to the sensitivity of heat addition on electron collision processes, and the importance of temperature on the reaction rates of most combustion reactions. In order to confirm that the speciation results are not sensitive to the choice of E/N, values of 160–200 Td were tested while keeping energy deposition per pulse equal to the 180 Td condition by varying the discharge duration. This resulted in less than 5% variation in the gas temperature, and fuel, oxidizer and product species concentrations. Thus, while E/N is not accurately known, this parameter is not found to significantly change the results in a range of ±20 Td from the chosen value.
The measurement of temperature by two-line absorption in a 300 pulse burst discharge at 30 kHz repetition frequency is presented in figure 2. The heat loss rate is fitted using a modified L/π value of 0.0064 m in equation (3.9) (instead of the calculated 0.0044 m) and a wall temperature of 300 K. The temperature increases steadily throughout the pulse burst until it peaks on the last pulse (at 10 ms), at which point heat losses take over and return the gas back to its original temperature. In our previous study of stoichiometric C2H4/O2/Ar with 75% dilution, heat loss could be neglected on the time scale of the experiment. However, there is a large effect of heat loss when using He as the diluent. At 1 atm and 293.15 K, the thermal conductivity (λ in equation (3.9)) of He is 0.1535 W m−1 K−1, whereas λ=0.01738 W m−1 K−1 for Ar. Thus, according to equation (3.9), the heat loss will be an order of magnitude faster with He as the diluent, and thus must be considered for accurate model predictions.
Figure 2.

Temperature measurements and model predictions during and after a 300 pulse burst at 30 kHz repetition rate in a stoichiometric CH4/O2/He mixture with 75% dilution. (Online version in colour.)
Figure 3 presents the mole fraction of formaldehyde as a function of time at the same conditions as in figure 2. The model under-predicts the peak concentration of formaldehyde by a factor of 4, indicating major limitation in the model’s predictive ability of this primary intermediate. The primary formation pathway reported for formaldehyde in methane PAC [4,11] is
| 4.1 |
Thus, formaldehyde is formed directly from two species produced in the plasma, because O atom is produced in (3.14)–(3.16) and methyl radical is produced in (3.17). This may indicate that the electron collision rates are not properly modelled, or that the rate of (4.1) is inaccurate. To fully understand the reason for the disagreement between the model and the measurement, additional species information is required.
Figure 3.

Formaldehyde measurements and model predictions during and after a 300 pulse burst at 30 kHz repetition rate in a stoichiometric CH4/O2/He mixture with 75% dilution. (Online version in colour.)
To collect a more complete set of product species, the plasma is run in continuous mode and gas sampling is performed downstream for multiple species quantification using GC-TCD, as well as temperature measurements by two-line absorption. Because of the fast thermal conductivity rate of helium, the gas temperature will quickly reach a steady state in which the heat loss to the walls balances the heat addition by the plasma. Figure 4 presents the gas temperature during steady-state NRP discharges at frequencies from 100 to 30 000 Hz. At lower frequencies (less than 10 000 Hz), the model and the measurement are in reasonable agreement. However, at higher frequencies, the model and the measurement diverge such that at 30 000 Hz there is a 50 K differential between the measurement and the model. This is due to wall heating in the continuous plasma, which decreases the heat loss rate, and thus allows the steady-state temperature to rise higher than in the pulse burst case. In the model, the wall temperature is assumed to be fixed at 300 K, and in the absence of wall temperature measurements during the discharge, the heat loss cannot be accurately predicted. Nevertheless, the overall trend is well represented by the model.
Figure 4.

Temperature measurements and model predictions in a continuous plasma at 30 kHz repetition rate in a stoichiometric CH4/O2/He mixture with 75% dilution. (Online version in colour.)
Figure 5 presents measured and predicted species concentration as a function of NRP frequency. Figure 5a presents the concentrations of the reactants and water, the largest product species. It is found that the fuel and oxygen consumption are predicted to within 5% of the measured value, which is smaller than the experimental uncertainty. Because the consumption of the reactants is almost entirely due to electron collision reactions and quenching of excited species (as will be discussed in the following sections), we can assume that the total electron collision rates are well modelled. The production of water is predicted to within 20% of the measured value, which is in excellent agreement considering the order-of-magnitude disagreement for water in our previous study of ethylene oxidation [14]. Figure 5b presents the other major products: carbon monoxide, carbon dioxide and hydrogen. The model captures the correct trends and relative concentrations of the three species, but under-predicts the absolute concentrations, particularly at the highest frequency conditions. Nevertheless, carbon monoxide agreement is within 30% of the measured value, whereas carbon dioxide and hydrogen are within 40%. The minor species are plotted in figure 5c. Agreement is comparatively poor between the model and measurements of formaldehyde, methanol, ethane, ethylene and acetylene. Similar to the time-dependent results, formaldehyde is under-predicted by approximately a factor of 4, whereas methanol is over-predicted by an order of magnitude. The remaining species only appear in relatively small concentrations in the experiment, and are all under-predicted by the model. In summary, the major trends of reactant consumption and major product species production are well captured by the model, indicating that the electron collision rates and dominant reaction pathways are well modelled, but the minor species modelling results in significant disagreement, indicating that perhaps some secondary rates need further attention.
Figure 5.

Species measurements and model predictions in a continuous plasma at 30 kHz repetition rate in a stoichiometric CH4/O2/He mixture with 75% dilution. (Online version in colour.)
In addition to the major species measured in this study, the concentrations of plasma-produced radical, excited and ionized species are of central importance in PAC kinetics. The model predictions for these species are presented in figure 6 for a single discharge pulse and interpulse period for steady-state 30 000 Hz operation (plot shown is for 3000th pulse). While most excited species and ions are quenched during the interpulse time, some longer-lifetime species survive in appreciable concentrations, such as O2(a1Δg),  and
and  . The reactions of these species with methane remain unclear [4,64], and may quench faster than predicted in the model. In addition, the reactions of
  with helium is an estimate from [49], as no measurements for this rate could be found in the literature. The ground-state radicals generated in the plasma react slowly with methane, and thus these radicals build up to a steady-state concentration. At higher gas temperatures, the large radical concentration would lead to chain branching reactions and ignition. However, methane at temperatures below ≈ 800 K can only react in chain propagating reactions.
Figure 6.

Model predictions of the concentration of radical, excited and ionized species in a continuous plasma at 30 kHz repetition rate and 8.76 kV peak voltage in a stoichiometric CH4/O2/He mixture with 75% dilution. (Online version in colour.)
To understand which reactions are of importance, a path flux analysis is performed. Figure 7 presents the consumption pathways of methane for 30 000 Hz continuously pulsed plasma at steady-state temperature as predicted by the model (407 K). The major fuel consumption pathways are through electron collision reactions, reactions with O(1D) and reaction with OH. Electron collision dissociative excitation reactions (3.17)–(3.20) account for 16% of fuel consumption, whereas ionization (3.23) and dissociative ionization (3.24) reactions account for 20%. The dissociative excitation reactions lead to methyl radical (CH3) and methylene radical (CH2), whereas the dissociative ionization reaction leads to methyl cation ( ). The charge exchange reactions for methyl cation found in the literature lead to more complex ions, the chemistry of which was ignored in the current model. Thus, the only consumption pathway for methyl cation is dissociative recombination with electrons, leading to methylene and hydrogen atom (3.84). In total, 10% of fuel consumption leads to methylene radical production. The methylene radical is completely consumed by reaction with oxygen,
| 4.2 |
| 4.3 |
| 4.4 |
| 4.5 |
resulting in the formation of product species. Reaction (4.2) accounts for 47% of carbon monoxide formation, and reactions (4.3) and (4.4) together account for 99% of carbon dioxide formation. Reaction (4.4) accounts for 19% of hydrogen formation, whereas dissociative excitation of methane (3.18)–(3.20) accounts for another 35% of hydrogen production, thus accounting for a total of 54% of the hydrogen formation. Because all three species are reasonably well predicted by the model, we can conclude that the reaction rates and branching ratios in the CH4+e→CH2+H2 and CH2+O2→CO, CO2, H2 pathways are well modelled.
Figure 7.

Path flux analysis of fuel consumption integrated over a single pulse period during continuous discharge at 30 kHz repetition frequency and steady-state temperature conditions. Bold species represent those which are measured in figure 5, red arrows refer to reactions from the combustion model, and blue arrows are from the plasma model. R represents any radical species, and M represents any species acting as a third-body collider. (Online version in colour.)
The other primary intermediate species is methyl radical, formed mainly by reactions (3.17) and (3.45), renumbered below,
| 4.6 |
| 4.7 |
| 4.8 |
which together account for a total of 65% of fuel consumption. Considering that the model and measurements of methane concentration are in good agreement, it is unlikely that the total initial consumption rates are significantly incorrect. In addition, (4.8) is responsible for 35% of water formation, which is well predicted by the model. Methyl radical is consumed via
| 4.9 |
| 4.10 |
The competition between these two rates determines the model prediction of methanol, as (4.10) leads to methyl peroxy radical (CH3O2), which reacts via
| 4.11 |
| 4.12 |
| 4.13 |
Reaction (4.11) is responsible for 82% of methanol formation, while further methoxy radical (CH3O) reactions result in the remaining 18% of methanol formation, as presented in figure 8. The methyl submodel also plays a large role in formaldehyde production, as (4.9) accounts for 16% of formaldehyde formation, and methoxy radical reactions account for another 19%. An increase in the rate of (4.9) would increase CH2O formation while decreasing CH3OH formation. However, both (4.9) and (4.10) have received considerable attention in the literature [65,66], as they are major pathways in methane combustion. Thus, they are not expected to have significant uncertainty that could account for the over-predication of methanol and under-prediction of formaldehyde. Another possibility is that there are other reactions participating in methyl radical oxidation that are not in the model, for example
| 4.14 |
At 400 K, there is a difference of five orders of magnitude between the H-abstraction rate from methane by O atom or by O(1D). If there is also such a difference between (4.9) and (4.14), it could change the amount of methyl radical going towards the formation of methanol when compared with that going towards formaldehyde. However, no rates for this reaction could be found in the literature. Reaction (4.9) has a rate of 1.12×10⁻¹⁰ cm3 s−1, thus, in analogy with the five-order-of-magnitude difference in methane H-abstraction rates by O atom and O(1D), (4.14) was given a rate of 1.12×10⁻⁵ cm3 s−1. However, this only increased the CH2O concentration by 27% and decreased the CH3OH concentration by 42%, which is not the order-of-magnitude change needed to bring the model into quantitative agreement with the measurement. However, it did improve model accuracy significantly, and deserves further exploration.
Figure 8.

Path flux analysis of formaldehyde and methanol formation integrated over a single pulse period during continuous discharge at 30 kHz repetition frequency and steady-state temperature conditions. Bold species represent those which are measured in figure 5, red arrows refer to reactions from the combustion model, and blue arrows are from the plasma model. R represents any radical species. (Online version in colour.)
Another explanation for the disagreement may lie in the methyl peroxy submodel. Consumption of methyl peroxy radical has not received nearly the same degree of attention as the initial methyl radical reactions. Reaction (4.11) has only been estimated [67], whereas (4.12) and (4.13) were each measured once [68]. In the model, all three rates are those suggested in [67]. If (4.11) is decreased, the reaction flux shifts towards the production of methoxy radical, which will increase the relative concentration of formaldehyde when compared with methanol. The model was recomputed with a factor of 5 decrease in (4.11), but the relative concentration of formaldehyde to methanol was minimally affected owing to the fact that most of the methoxy is recycled to methyl radical, which loops back to the production of methanol (figure 7). Thus, changing (4.11) has a non-monotonic effect on the formaldehyde to methanol ratio. In the original paper measuring (4.12) by Šlemr & Warneck [69], the reaction is suggested to proceed through an alternative reaction pathway that results in the direct formation of formaldehyde
| 4.15 |
which is dominant over the channel recommended by Tsang et al. [67]. Tsang et al. determined that surface reactions in the Šlemr & Warneck measurement were responsible for the observed formaldehyde concentration, and thus dismissed any contribution from (4.15). However, changing (4.12) to (4.15) also has a minimal effect on the formaldehyde to methanol ratio, because (4.13) is a factor of 3 faster than (4.12), and thus dominates the H-abstraction reaction pathway. Further investigation into the reaction pathways of methyl peroxy radicals is needed to resolve this issue. The methoxy submodel may also be responsible for the disagreement in methanol concentration. However, similar to the methyl radical oxidation rates, methoxy has received considerable attention [65,67,70], as it is one of the primary intermediates in methanol and other alcohol oxidation.
Dominating the formation pathways for formaldehyde are the reactions of O(1D) with methane (3.45–3.47), which are the most significant consumption pathways, accounting for 53% of total fuel consumption. The total rate and branching ratios of this reaction are taken from Sander et al. [60], in which available rates were reviewed and a recommended rate and branching ratios were prescribed. Even a small change in the branching ratio of this reaction shifts the relative concentrations of methanol and formaldehyde significantly. As discussed in [60], there is still significant disagreement among measurements of the branching ratio for this reaction. Further studies of O(1D) + CH4 could lead to improved model predictions in PAC of methane. The disagreement for formaldehyde and methanol formation in the low-temperature region of this study thus remains an open topic, and requires a more in-depth understanding of the kinetic pathways involved, particularly for the methyl peroxy reactions and the reaction of methane and O(1D).
All of the ethane, ethylene and acetylene formation proceeds via radical–radical recombination reactions. As the radical pool composition cannot be measured in this study, it is difficult to identify which reactions are responsible for the disagreement. One possibility is that more electron collision reactions need to be considered for electron collision dissociation of the intermediate and product species. However, as each of the C2 species are only present in mole fractions of under 100 ppm, the failure of the model to accurately predict these species does not constitute a major shortcoming, and thus no major consideration was taken to improve the calculated under-prediction of these species.
5. Conclusion
Time-dependent and steady-state measurements of temperature and species of a plasma discharge in a stoichiometric methane/oxygen mixture with 75% helium dilution have been performed using LAS and GC-TCD sampling techniques. In addition, a PAC modelling tool for homogeneous PAC systems as well as a high-pressure plasma kinetic mechanism (HP-Mech/plasma) for CH4/O2/He oxidation have been assembled and used to simulate the experimental measurements. To match the E/N in the model to approximately the experimental value, E/N was varied to fit the time-dependent temperature profile. In situ time-dependent measurements of CH2O in the plasma found a factor of 4 disagreement between the measurement and the modelled results, prompting the need for further investigation into low-temperature PAC pathways. For this purpose, temperature measurements in the continuous plasma and species sampling downstream of the plasma region were performed. The temperature measurements indicated limitations in heat loss prediction due to wall heating by the continuous plasma, under-predicting the temperature by up to 50 K. However, overall prediction of the heating trend was captured. Species measurements found H2O to be the largest product species, followed by CO, CO2, H2, CH2O, CH3OH, C2H4, C2H2 and finally C2H6. The model accurately predicts fuel and oxygen consumption, as well as the production of H2O, CO, CO2 and H2. However, the intermediate species CH2O, CH3OH, C2H2, C2H4 and C2H6 are not well predicted by the model. CH3OH is over-predicted by an order of magnitude and CH2O is again under-predicted by a factor of 4. Reaction pathway analysis indicates that the reactions primarily responsible for H2O, CO, CO2 and H2 formation proceed via electron dissociative excitation and dissociative ionization reactions leading to methylene radical. The routes leading to CH2O and CH3OH formation are largely through electron dissociative excitation and H-abstraction reactions leading to methyl radicals, as well as directly through the reactions of methane with O(1D). It is found that the methyl radical submechanism proceeds primarily through a molecular oxygen addition pathway leading to methyl peroxy radicals. The low-temperature consumption pathways of methyl peroxy radicals are not well known and may be the reason for the significant failure of the model in terms of formaldehyde and methanol prediction. Further studies into the reactions of methyl peroxy are necessary to bring the model into agreement with the present measurements. In addition, the branching ratio of methane and O(1D) can be altered to improve agreement. The sensitivity of PAC kinetics to low-temperature hydrocarbon chemistry indicates the need for further evaluation of reaction processes at temperature below 700 K participating in the negative temperature coefficient range of hydrocarbon oxidation, even for the smallest hydrocarbon species.
Supplementary Material
Data accessibility
The model, including the electron collision cross sections, the plasma reaction set, the ground-state species reaction set (HP-Mech) and the thermodynamic data, is included in the supplementary material.
Authors’ contributions
J.K.L. carried out the flow reactor experiments, performed the data analysis, assembled the kinetic model, participated in the design of the study and drafted the manuscript; P.G. carried out the assembly of the modelling code and ran all computations; A.R. participated in the measurements and data processing; Y.J. conceived of the study, coordinated the study and helped draft the manuscript. All authors gave final approval for publication.
Competing interests
We have no competing interests.
Funding
The authors acknowledge the NSF nano-manufacturing grant AWD1004057 and the AFOSR MILD Combustion project (grant no. FA9550-13-1-0119) for supporting this work.
References
- 1.Ju Y, Sun W. 2015. Plasma assisted combustion: dynamics and chemistry. Prog. Energy Combust. Sci. 48, 21–83. ( 10.1016/j.pecs.2014.12.002) [DOI] [Google Scholar]
- 2.Starikovskaia SM. 2006. Plasma assisted ignition and combustion. J. Phys. D, Appl. Phys. 39, 265 ( 10.1088/0022-3727/39/16/r01) [DOI] [Google Scholar]
- 3.Starikovskiy A, Aleksandrov N. 2013. Plasma-assisted ignition and combustion. Prog. Energy Combust. Sci. 39, 61–110. ( 10.1016/j.pecs.2012.05.003) [DOI] [Google Scholar]
- 4.Kosarev IN, Aleksandrov NL, Kindysheva SV, Starikovskaia SM, Starikovskii AY. 2008. Kinetics of ignition of saturated hydrocarbons by nonequilibrium plasma: CH4-containing mixtures. Combust. Flame 154, 569–586. ( 10.1016/j.combustflame.2008.03.007) [DOI] [Google Scholar]
- 5.Aleksandrov NL, Kindysheva SV, Kosarev IN, Starikovskaia SM, Starikovskii AY. 2009. Mechanism of ignition by non-equilibrium plasma. Proc. Combust. Inst. 32, 205–212. ( 10.1016/j.proci.2008.06.124) [DOI] [Google Scholar]
- 6.Starikovskaya SM, Aleksandrov NL, Kosarev IN, Kindysheva SV, Starikovskii AY. 2009. Ignition with low-temperature plasma: kinetic mechanism and experimental verification. High Energy Chem. 43, 213–218. ( 10.1134/s0018143909030096) [DOI] [Google Scholar]
- 7.Kosarev IN, Aleksandrov NL, Kindysheva SV, Starikovskaia SM, Starikovskii AY. 2009. Kinetics of ignition of saturated hydrocarbons by nonequilibrium plasma: C2H6- to C5H12-containing mixtures. Combust. Flame 156, 221–233. ( 10.1016/j.combustflame.2008.07.013) [DOI] [Google Scholar]
- 8.Bozhenkov SA, Starikovskaia SM, Starikovskii AY. 2003. Nanosecond gas discharge ignition of H2- and CH4-containing mixtures. Combust. Flame 133, 133–146. ( 10.1016/s0010-2180(02)00564-3) [DOI] [Google Scholar]
- 9.Starikovskaia S, Kukaev E, Kuksin A, Nudnova M, Starikovskii A. 2004. Analysis of the spatial uniformity of the combustion of a gaseous mixture initiated by a nanosecond discharge. Combust. Flame 139, 177–187. ( 10.1016/j.combustflame.2004.07.005) [DOI] [Google Scholar]
- 10.Sun W, Uddi M, Ombrello T, Won SH, Carter C, Ju Y. 2011. Effects of non-equilibrium plasma discharge on counterflow diffusion flame extinction. Proc. Combust. Inst. 33, 3211–3218. ( 10.1016/j.proci.2010.06.148) [DOI] [Google Scholar]
- 11.Sun W, Uddi M, Won SH, Ombrello T, Carter C, Ju Y. 2012. Kinetic effects of non-equilibrium plasma-assisted methane oxidation on diffusion flame extinction limits. Combust. Flame 159, 221–229. ( 10.1016/j.combustflame.2011.07.008) [DOI] [Google Scholar]
- 12.Sun W, Won SH, Ombrello T, Carter C, Ju Y. 2013. Direct ignition and S-curve transition by in situ nano-second pulsed discharge in methane/oxygen/helium counterflow flame. Proc. Combust. Inst. 34, 847–855. ( 10.1016/j.proci.2012.06.104) [DOI] [Google Scholar]
- 13.Sun W, Won SH, Ju Y. 2014. In situ plasma activated low temperature chemistry and the S-curve transition in DME/oxygen/helium mixture. Combust. Flame 161, 2054–2063. ( 10.1016/j.combustflame.2014.01.028) [DOI] [Google Scholar]
- 14.Lefkowitz JK, Uddi M, Windom BC, Lou G, Ju Y. 2015. In situ species diagnostics and kinetic study of plasma activated ethylene dissociation and oxidation in a low temperature flow reactor. Proc. Combust. Inst. 35, 3505–3512. ( 10.1016/j.proci.2014.08.001) [DOI] [Google Scholar]
- 15.Mintusov E, Serdyuchenko A, Choi I, Lempert WR, Adamovich IV. 2009. Mechanism of plasma assisted oxidation and ignition of ethylene–air flows by a repetitively pulsed nanosecond discharge. Proc. Combust. Inst. 32, 3181–3188. ( 10.1016/j.proci.2008.05.064) [DOI] [Google Scholar]
- 16.Lou G, Bao A, Nishihara M, Keshav S, Utkin YG, Rich JW, Lempert WR, Adamovich IV. 2007. Ignition of premixed hydrocarbon–air flows by repetitively pulsed, nanosecond pulse duration plasma. Proc. Combust. Inst. 31, 3327–3334. ( 10.1016/j.proci.2006.07.126) [DOI] [Google Scholar]
- 17.Uddi M, Jiang N, Adamovich IV, Lempert WR. 2009. Nitric oxide density measurements in air and air/fuel nanosecond pulse discharges by laser induced fluorescence. J. Phys. D, Appl. Phys. 42, 075205 ( 10.1088/0022-3727/42/7/075205) [DOI] [Google Scholar]
- 18.Uddi M, Jiang N, Mintusov E, Adamovich IV, Lempert WR. 2009. Atomic oxygen measurements in air and air/fuel nanosecond pulse discharges by two photon laser induced fluorescence. Proc. Combust. Inst. 32, 929–936. ( 10.1016/j.proci.2008.06.049) [DOI] [Google Scholar]
- 19.Yin Z, Montello A, Carter CD, Lempert WR, Adamovich IV. 2013. Measurements of temperature and hydroxyl radical generation/decay in lean fuel–air mixtures excited by a repetitively pulsed nanosecond discharge. Combust. Flame 160, 1594–1608. ( 10.1016/j.combustflame.2013.03.015) [DOI] [Google Scholar]
- 20.Yin Z, Adamovich IV, Lempert WR. 2013. OH radical and temperature measurements during ignition of H2–air mixtures excited by a repetitively pulsed nanosecond discharge. Proc. Combust. Inst. 34, 3249–3258. ( 10.1016/j.proci.2012.07.015) [DOI] [Google Scholar]
- 21.Samukawa S, et al. 2012. The 2012 plasma roadmap. J. Phys. D, Appl. Phys. 45, 253001 ( 10.1088/0022-3727/45/25/253001) [DOI] [Google Scholar]
- 22.Won SH, Jiang B, Dievart P, Sohn CH, Ju Y. 2015. Self-sustaining n-heptane cool diffusion flames activated by ozone. Proc. Combust. Inst. 35, 881–888. ( 10.1016/j.proci.2014.05.021) [DOI] [Google Scholar]
- 23.Suib SL, Zerger RP. 1993. A direct, continuous, low-power catalytic conversion of methane to higher hydrocarbons via microwave plasmas. J. Catal. 139, 381–391. ( 10.1006/jcat.1993.1034) [DOI] [Google Scholar]
- 24.Lesueur H, Czernichowski A, Chapelle J. 1994. Electrically assisted partial oxidation of methane. Int. J. Hydrogen Energy 19, 139–144. ( 10.1016/0360-3199(94)90118-X) [DOI] [Google Scholar]
- 25.Okumoto M, Rajanikanth BS, Katsura S, Mizuno A. 1998. Nonthermal plasma approach in direct methanol synthesis from CH4. IEEE Trans. Ind. Appl. 34, 940–944. ( 10.1109/28.720433) [DOI] [Google Scholar]
- 26.Bromberg L, Cohn DR, Rabinovich A, Alexeev N. 1999. Plasma catalytic reforming of methane. Int. J. Hydrogen Energy 24, 1131–1137. ( 10.1016/S0360-3199(98)00178-5) [DOI] [Google Scholar]
- 27.Lee DH, Kim KT, Cha MS, Song YH. 2007. Optimization scheme of a rotating gliding arc reactor for partial oxidation of methane. Proc. Combust. Inst. 31, 3343–3351. ( 10.1016/j.proci.2006.07.230) [DOI] [Google Scholar]
- 28.Hwang N, Song Y-H, Cha MS. 2010. Efficient use of CO2 reforming of methane with an arc-jet plasma. IEEE Trans. Plasma Sci. 38, 3291–3299. ( 10.1109/TPS.2010.2064179) [DOI] [Google Scholar]
- 29.Zhang X, Cha MS. 2013. Electron-induced dry reforming of methane in a temperature-controlled dielectric barrier discharge reactor. J. Phys. D, Appl. Phys. 46, 415205 ( 10.1088/0022-3727/46/41/415205) [DOI] [Google Scholar]
- 30.Zhang X, Cha MS. 2014. Partial oxidation of methane in a temperature-controlled dielectric barrier discharge reactor. Proc. Combust. Inst. 35, 3447–3454. ( 10.1016/j.proci.2014.05.089) [DOI] [Google Scholar]
- 31.Jasiński M, Dors M, Mizeraczyk J. 2008. Production of hydrogen via methane reforming using atmospheric pressure microwave plasma. J. Power Sources 181, 41–45. ( 10.1016/j.jpowsour.2007.10.058) [DOI] [Google Scholar]
- 32.Lefkowitz JK, Guo P, Rousso A, Ju Y. 2015. Low temperature oxidation of methane in a nanosecond pulsed plasma discharge. In 53rd AIAA Aerospace Sciences Meeting, Kissimmee, FL, 5–9 January American Institute of Aeronautics and Astronautics. [Google Scholar]
- 33.Lefkowitz JK, Windom BC, MacDonald W, Adams S, Chen T, Uddi M, Ju Y. 2014. Time dependent measurements of species formation in nanosecond-pulsed plasma discharges in C2H4/O2/Ar mixtures. In 52nd AIAA Aerospace Sciences Meeting, National Harbor, MD, 13–17 January American Institute of Aeronautics and Astronautics. [Google Scholar]
- 34.Uddi M, Lefkowitz JK, Ju Y. 2013. Species measurements of ethylene oxidation in a nanosecond-pulsed plasma discharge using QCL absorption spectroscopy near 7.6 μm. In 51st AIAA Aerospace Sciences Meeting including the New Horizons Forum and Aerospace Exposition, Grapevine, TX, 7–10 January American Institute of Aeronautics and Astronautics. [Google Scholar]
- 35.Kogelschatz U. 2003. Dielectric-barrier discharges: their history, discharge physics, and industrial applications. Plasma Chem. Plasma Process. 23, 1–46. ( 10.1023/A:1022470901385) [DOI] [Google Scholar]
- 36.Adamovich IV, et al. 2009. Plasma assisted ignition and high-speed flow control: non-thermal and thermal effects. Plasma Sources Sci. Technol. 18, 034018 ( 10.1088/0963-0252/18/3/034018) [DOI] [Google Scholar]
- 37.Takashima K, Yin Z, Adamovich IV. 2013. Measurements and kinetic modeling of energy coupling in volume and surface nanosecond pulse discharges. Plasma Sources Sci. Technol. 22, 015013 ( 10.1088/0963-0252/22/1/015013) [DOI] [Google Scholar]
- 38.Farooq A, Jeffries JB, Hanson RK. 2008. In situ combustion measurements of H2O and temperature near 2.5 μm using tunable diode laser absorption. Meas. Sci. Technol. 19, 075604 ( 10.1088/0957-0233/19/7/075604) [DOI] [Google Scholar]
- 39.Rothman LS, et al. 2009. The HITRAN 2008 molecular spectroscopic database. J. Quant. Spectrosc. Radiat. Transf. 110, 533–572. ( 10.1016/j.jqsrt.2009.02.013) [DOI] [Google Scholar]
- 40.Armstrong BH. 1967. Spectrum lines profiles: the Voigt function. J. Quant. Spectrosc. Radiat. Transf. 7, 61–88. ( 10.1016/0022-4073(67)90057-X) [DOI] [Google Scholar]
- 41.Weideman JAC. 1994. Computation of the complex error function. SIAM J. Numer. Anal. 31, 1497–1518. ( 10.1137/0731077) [DOI] [Google Scholar]
- 42.Pancheshnyi S, Eismann B, Hagelaar GJM, Pitchford LC.ZDPlasKin. 2008. See http://www.zdplaskin.laplace.univ-tlse.fr . University of Toulouse, LAPLACE, CNRS-UPS-INP, Toulouse, France.
- 43.Lutz AE, Kee RJ, Miller JA. SENKIN: A FORTRAN program for predicting homogeneous gas phase chemical kinetics with sensitivity analysis. 1988 Sandia National Laboratories Report SAND87-8248. [Google Scholar]
- 44.Hagelaar GJM, Pitchford LC. 2005. Solving the Boltzmann equation to obtain electron transport coefficients and rate coefficients for fluid models. Plasma Sources Sci. Technol. 14, 722–733. ( 10.1088/0963-0252/14/4/011) [DOI] [Google Scholar]
- 45.Brown PN, Byrne GD, Hindmarsh AC. 1989. VODE: a variable-coefficient ODE solver. SIAM J Sci. Stat. Comput. 10, 1038–1051. ( 10.1137/0910062) [DOI] [Google Scholar]
- 46.Flitti A, Pancheshnyi S. 2009. Gas heating in fast pulsed discharges in N2–O2 mixtures. Eur. Phys. J. – Appl. Phys. 45, 21001 ( 10.1051/epjap/2009011) [DOI] [Google Scholar]
- 47.Adamovich IV, Nishihara M, Choi I, Uddi M, Lempert WR. 2009. Energy coupling to the plasma in repetitive nanosecond pulse discharges. Phys. Plasmas 16, 113505 ( 10.1063/1.3264740) [DOI] [Google Scholar]
- 48.Capitelli M, Ferreira CM, Osipov AI, Gordiets BF. 2000. Plasma kinetics in atmospheric gases. Berlin, Germany: Springer. [Google Scholar]
- 49.Stafford DS, Kushner MJ. 2004. O2(1Δ) production in He/O2 mixtures in flowing low pressure plasmas. J. Appl. Phys. 96, 2451 ( 10.1063/1.1768615) [DOI] [Google Scholar]
- 50.Phelps database. See www.lxcat.net (accessed on 4 October 2014).
- 51.Biagi-v7.1 database. See www.lxcat.net (accessed on 4 October 2014).
- 52.Janev RK, Reiter D. 2002. Collision processes of CHy and CHy+ hydrocarbons with plasma electrons and protons. Phys. Plasmas 9, 4071 ( 10.1063/1.1500735) [DOI] [Google Scholar]
- 53.Alves LL, et al. 2013. Comparisons of sets of electron–neutral scattering cross sections and swarm parameters in noble gases. II. Helium and neon. J. Phys. D, Appl. Phys. 46, 334002 ( 10.1088/0022-3727/46/33/334002) [DOI] [Google Scholar]
- 54.Biagi-v8.9 database. See www.lxcat.net (accessed on 4 October 2014).
- 55.TRINITI database. See www.lxcat.net (accessed on 4 October 2014).
- 56.Becker KH, Groth W, Schurath U. 1971. Environmental simulation chambers: application to atmospheric chemical processes. Chem. Phys. Lett. 8, 259–262. ( 10.1016/0009-2614(71)85004-2) [DOI] [Google Scholar]
- 57.Mayer SW, Schieler L. 1968. Activation energies and rate constants computed for reactions of oxygen with hydrocarbons. J. Phys. Chem. 72, 2628–2631. ( 10.1021/j100853a066) [DOI] [Google Scholar]
- 58.Dunlea EJ, Talukdar RK, Ravishankara AR. 2005. Kinetic studies of the reactions of O2(b1Σg+) with several atmospheric molecules. J. Phys. Chem. A 109, 3912–3920. ( 10.1021/jp044129x) [DOI] [PubMed] [Google Scholar]
- 59.Hicks A, Norberg S, Shawcross P, Lempert WR, Rich JW, Adamovich IV. 2005. Singlet oxygen generation in a high pressure non-self-sustained electric discharge. J. Phys. D, Appl. Phys. 38, 3812–3824. ( 10.1088/0022-3727/38/20/007) [DOI] [Google Scholar]
- 60.Sander SP, et al. 2006. Chemical kinetics and photochemical data for use in atmospheric studies Pasadena, CA: Jet Propulsion Laboratory, California Institute of Technology; Evaluation no. 15, JPL publication 06-2 [Google Scholar]
- 61.Kossyi I, Kostinsky AY, Matveyev A, Silakov V. 1992. Kinetic scheme of the non-equilibrium discharge in nitrogen–oxygen mixtures. Plasma Sources Sci. Technol. 1, 207 ( 10.1088/0963-0252/1/3/011) [DOI] [Google Scholar]
- 62.Tsuji M, Kobarai K, Obase H, Kouno H, Nishimura Y. 1991. Dissociative excitation of CH4 by collisions with helium active species. J. Chem. Phys. 94, 277 ( 10.1063/1.460732) [DOI] [Google Scholar]
- 63.Florescu-Mitchell AI, Mitchell JBA. 2006. Dissociative recombination. Phys. Rep. 430, 277–374. ( 10.1016/j.physrep.2006.04.002) [DOI] [Google Scholar]
- 64.Ombrello T, Won SH, Ju Y, Williams S. 2010. Flame propagation enhancement by plasma excitation of oxygen. II. Effects of O2(a1Δg). Combust. Flame 157, 1916–1928. ( 10.1016/j.combustflame.2010.02.004) [DOI] [Google Scholar]
- 65.Baulch DL. 2005. Evaluated kinetic data for combustion modeling: supplement II. J. Phys. Chem. Ref. Data 34, 757 ( 10.1063/1.1748524) [DOI] [Google Scholar]
- 66.Fernandes RX, Luther K, Troe J. 2006. Falloff curves for the reaction CH3 + O2 (+ M) → CH3O2 (+ M) in the pressure range 2–1000 bar and the temperature range 300–700 K. J. Phys. Chem. A 110, 4442–4449. ( 10.1021/jp056850o) [DOI] [PubMed] [Google Scholar]
- 67.Tsang W, Hampson RF. 1986. Chemical kinetic data base for combustion chemistry. I. Methane and related compounds. J. Phys. Chem. Ref. Data 15, 1087 ( 10.1063/1.555759) [DOI] [Google Scholar]
- 68.Zellner R, Hartmann D, Karthauser J, Rhasat D, Weibring G. 1988. A laser photolysis/LIF study of the reactions of O(3P) atoms with CH3 and CH3O2 radicals. J. Chem. Soc., Faraday Trans. 2 84, 549–568. ( 10.1039/f29888400549) [DOI] [Google Scholar]
- 69.Šlemr F, Warneck P. 1977. Kinetics of the reaction of atomic hydrogen with methyl hydroperoxide. Int. J. Chem. Kinet. 9, 267–282. ( 10.1002/kin.550090210) [DOI] [Google Scholar]
- 70.Xu K, Xu ZF, Lin MC. 2010. Ab initio kinetic prediction of branching rate constants for reactions of H atoms with CH3O and CH2OH. Mol. Phys. 105, 2763–2776. ( 10.1080/00268970701630924) [DOI] [Google Scholar]
Associated Data
This section collects any data citations, data availability statements, or supplementary materials included in this article.
Supplementary Materials
Data Availability Statement
The model, including the electron collision cross sections, the plasma reaction set, the ground-state species reaction set (HP-Mech) and the thermodynamic data, is included in the supplementary material.