Abstract
The study of pulsed laser- and microwave-induced plasma interactions with atmospheric and higher pressure combusting gases requires rapid diagnostic methods that are capable of determining the mechanisms by which these interactions are taking place. New rapid diagnostics are presented here extending the capabilities of Rayleigh and Thomson scattering and resonance-enhanced multi-photon ionization (REMPI) detection and introducing femtosecond laser-induced velocity and temperature profile imaging. Spectrally filtered Rayleigh scattering provides a method for the planar imaging of temperature fields for constant pressure interactions and line imaging of velocity, temperature and density profiles. Depolarization of Rayleigh scattering provides a measure of the dissociation fraction, and multi-wavelength line imaging enables the separation of Thomson scattering from Rayleigh scattering. Radar REMPI takes advantage of high-frequency microwave scattering from the region of laser-selected species ionization to extend REMPI to atmospheric pressures and implement it as a stand-off detection method for atomic and molecular species in combusting environments. Femtosecond laser electronic excitation tagging (FLEET) generates highly excited molecular species and dissociation through the focal zone of the laser. The prompt fluorescence from excited molecular species yields temperature profiles, and the delayed fluorescence from recombining atomic fragments yields velocity profiles.
Keywords: filtered Rayleigh scattering, Thomson scattering, depolarized Rayleigh scattering, radar resonance-enhanced multi-photon ionization, femtosecond laser electronic excitation tagging
1. Introduction
The coupling of laser and microwave energy into combusting environments provides opportunities for acoustic control, flame speed enhancement, suppression of extinction, rapid re-ignition, extension of the lean combustion limit, spatially selective and distributed ignition and reduction of pollutant formation. For practical combustion systems, this coupling needs to occur at atmospheric or high pressures, which tends to favour microwave and laser approaches over electric discharges for many applications. The mechanisms for achieving this coupling include microwave absorption by flame-generated ionization, microwave and laser energy addition facilitated by laser preionization, and direct laser energy addition. The coupling occurs through direct heating, through the production of activated species and radicals, and/or through ionization. Understanding these mechanisms cannot be accomplished by physical probes due to their interactions with the combustion and plasma generation processes and the nature of the coupling mechanisms. Furthermore, the coupling is often accomplished in a well-localized region and over a short time interval that may be smaller than the scale and time response of external probes. Thus it is important to explore methods for quantitative measurement of microwave and laser coupled interactions. Here we discuss the development of several new methods for characterizing these interactions using time accurate laser-related approaches.
Typically the laser and microwave interactions can be categorized into strong and weak, with strong interactions leading to significant ionization, dissociation, radical production, shock wave generation and heating. Weak interactions lead to a few hundred kelvin heating, but without the generation of increased ionization or dissociated species. In the strong interaction cases, changes in the properties of the gas can occur on extremely fast time scales, frequently in the picosecond to nanosecond regime. In both cases, the evolution of the gas and the interaction with the combusting or combustible mixture following the energy deposition is of great interest.
The examples presented here include both weak and strong interactions and are chosen to demonstrate the capabilities of these new diagnostic approaches. Microwaves are especially useful for coupling to existing flames or flamelets. The microwaves’ wavelength is large compared with the flame dimensions and the microwaves fill the resonator cavity in which the flame is located. The microwave field is maintained below the air breakdown threshold, and the natural ionization in the flame localizes the energy deposition. Consequently, energy is deposited only in the flame zone. Laser-related energy deposition involves short-pulsed interactions, including femtosecond, picosecond and nanosecond processes. In these cases, energy is added at the location of the laser focal region, primarily through nonlinear interactions. These interactions can ignite combustible mixtures and can also provide methods for nonlinear diagnostics. As the nonlinearity of the interaction is primarily a function of the laser intensity rather than the energy, femtosecond lasers can achieve interactions with a few millijoules of energy whereas nanosecond lasers require approximately 100 mJ. These are strong interactions and can cause significant local heating, molecular dissociation, ionization and electronic excitation.
2. Rayleigh and Thomson scattering methods
Microwave coupling to the plasma in a flame is a good example of a weak interaction. In that case, the microwave field couples to electrons arising from ionization that is naturally present in a flame associated with the HCO+ radical [1] and provides a method for increasing the flame speed [2,3]. Typical temperature increases are in the hundreds of kelvin range. Pulsed microwave interactions are many times more efficient than continuous microwave interactions, achieving similar flame speed increases and providing a method to reduce the lean equivalence ratio limit [3,4]. For pulsed microwaves time accurate measurements are desired in order to determine the location of the energy deposition relative to the flame zone, the increase in flame temperature, the change in the flame speed and the impact on the production of nitric oxide. These measurements can be taken together with the measurement of the power transferred into the microwave resonator cavity and the reflected power to establish the power coupled into the flame and the efficiency of that coupling.
This experiment provides an excellent example of the utility of filtered Rayleigh scattering [5] for the measurement of the instantaneous temperature increase. Filtered Rayleigh scattering takes advantage of the thermal and acoustic broadening that is associated with narrow linewidth laser scattering from a gas with moving molecules. By tuning a narrow linewidth laser to the centre of an optically thick atomic or molecular absorption line and placing a cell with that atomic or molecular species in front of the camera, the laser light scattered from the windows and walls of the microwave cavity can be strongly suppressed while the skirts of the spectrally broadened scattering from the gas can pass through and be imaged by the camera. In the absence of such a filter, the strength of the background laser scattering overwhelms the detection system, obscuring the light scattered from the gas.
The relative contributions of acoustic and thermal broadening are captured by the y parameter, which is defined as the ratio of the virtual scattering interference pattern wavelength, λs, to the mean free path, lm. The virtual scattering wavelength is determined by the geometry of the experiment, and corresponds to the fringe pattern created by the interference of the illumination laser beam and the scattered light (figure 1). Density fluctuations on this length scale are seen in the Rayleigh spectrum. An approximation of the y parameter for air yields
 |
2.1 |
where θ is the scattering angle defined relative to the laser propagation direction, λ is the laser wavelength in nanometres, T is the temperature in kelvin and P is the pressure in atmospheres [6].
Figure 1.
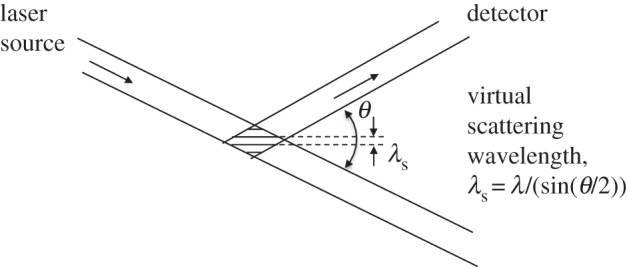
Virtual scattering wavelength.
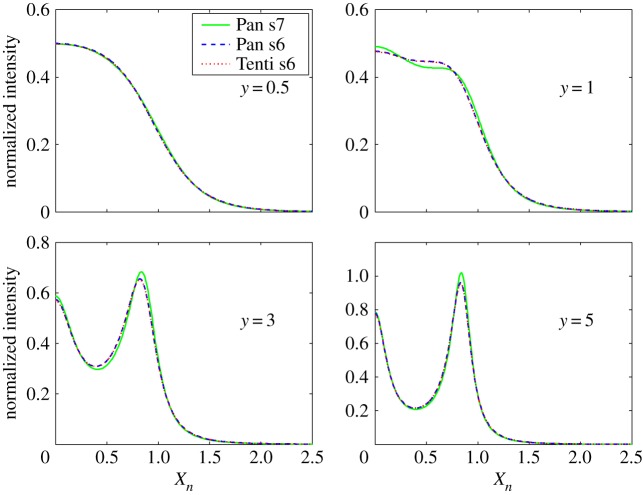
The broadening of the Rayleigh line can be described using either sixth moment (Tenti, Pan) or seventh moment (Pan) models of the density fluctuation spectrum, derived from approximate solutions of the time-dependent Boltzmann equation [7,8]. Figure 2 shows the computed sixth and seventh moment Rayleigh scattering nitrogen spectra for various values of y plotted against the normalized frequency shift,
 |
2.2 |
where ωR is the Rayleigh frequency shift in radians;
 |
2.3 |
where kb is the Boltzmann constant, T is the temperature and M is the mass of the molecule. The area under each curve is normalized to 1/2. The peaks of the acoustic sidebands correspond to the frequency shift associated with the speed of sound (xn=√(0.7)=0.8367). The difference between the sixth and seventh moment models is negligible at atmospheric pressure for room temperature and higher, but can be significant at low temperature or at high pressure. The y parameter for 532 nm laser (frequency-doubled Nd:YAG) scattering at 90° at atmospheric pressure and at 298 K is 0.79, so the lineshape includes acoustic effects and is not Gaussian. At the high temperatures associated with combustion, y is much less than 1 and the broadening is Gaussian, reflecting only the thermal motion of the molecules.
Figure 2.
Rayleigh line broadening computed using the conventional sixth moment Tenti model and alternative sixth and seventh moment models for pure nitrogen [7,8]. (Online version in colour.)
For the microwave coupling experiments [3,4], the microwave frequency is 3 GHz with a corresponding wavelength of 10 cm, and the peak microwave power is 25 kW. The microwave pulse lengths are varied from 1 to 3 μs and the pulse repetition rate is varied from 0 to 1 kHz. Figure 3 shows the experimental set-up. The microwaves are passed from the magnetron through a circulator into a resonant microwave cavity with a Q of approximately 1000. This resonator cavity increases the microwave field and allows the microwaves to be efficiently coupled into the flame even with a small microwave absorption constant. The three-stub tuner at the entrance to the resonator cavity and the sliding short at the far end allow the cavity to be tuned to resonance with the 3 GHz microwave radiation. Without the cavity the microwaves would continue to propagate past the flame and very little power would be absorbed. A laminar flame is stabilized against a flat stagnation plate at the top of the microwave cavity, and the location of the flame within the cavity is established at the point where the flame speed just matches the diverging premixed methane/air flow entering at the bottom of the resonant chamber [2]. The power into and reflected from the cavity is measured with rectifying diodes, and the reflected power is diverted by the circulator into an absorbing termination stub. As no power is coupled out past the sliding short, the reflected power is an indication of the internal cavity losses. A reduction in the reflected power is a measure of the power absorbed into the flame.
Figure 3.
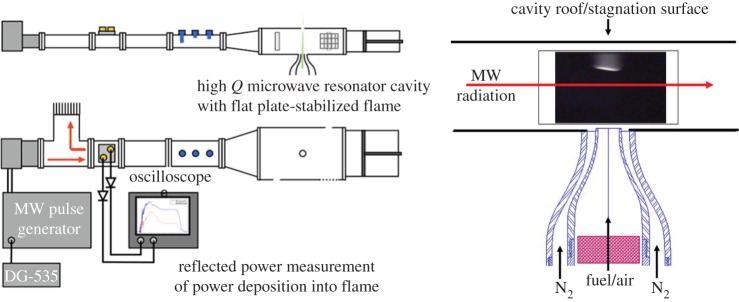
Experimental set-up for the study of pulsed microwave energy coupling into a laminar methane/air flame [3,4]. (Online version in colour.)
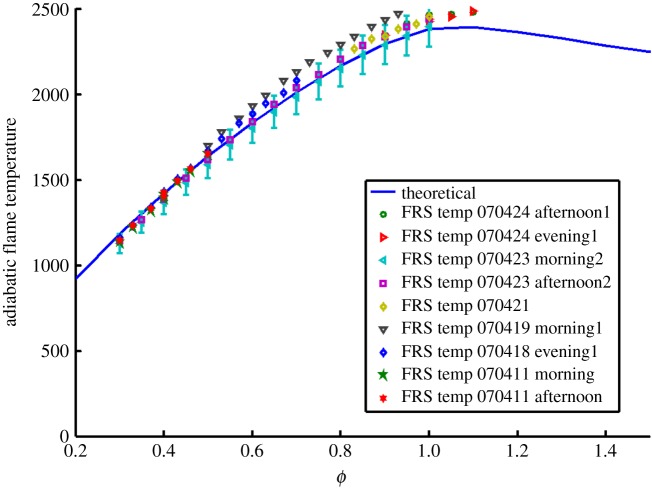
Figure 4a shows the modelled overlap of the laser with the absorption spectrum of iodine vapour along with the thermally and acoustically broadened Rayleigh scattering from a 532 nm laser-illuminated region in atmospheric pressure nitrogen observed at 90° to the illumination laser propagation direction. Figure 4b shows the transmission of the nitrogen Rayleigh wings with temperature relative to the transmission at room temperature, assuming constant (atmospheric) pressure. This curve serves as a calibration for the measurement of temperature in an isobaric environment. Assuming the Rayleigh cross section of a gas mixture or combustion flame is dominated by nitrogen, this calibration curve can be used to extract the flame temperature. Figure 5 shows the measurement of the temperature just downstream of a nearly adiabatic hydrogen/air Hencken burner flame with varying equivalence ratio using this calibration curve. The measurements show good agreement with the predicted adiabatic flame temperature to within the approximately 10% experimental error. Note that there is some day-to-day variation. That variation has to do with the drift of the laser relative to the centre of the iodine absorption line.
Figure 4.
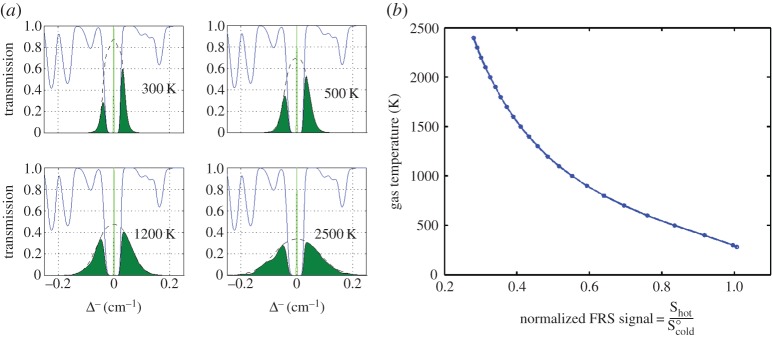
Filtered Rayleigh scattering concept. (a) The Rayleigh scattering from the gas is broadened by acoustic and thermal motion of the molecules. The iodine filter allows the skirts of the Rayleigh line to pass but blocks the laser light. (b) At constant pressure the transmission through the iodine filter with temperature provides a calibration curve for measurement of temperature [2–4]. (Online version in colour.)
Figure 5.
Filtered Rayleigh scattering measurement of the temperature just downstream of a Hencken burner hydrogen/air flame as a function of the equivalence ratio compared with predicted adiabatic flame temperatures (curve). (Online version in colour.)
The sensitivity of the measurement to the position of the laser wavelength relative to the centre of the iodine absorption line is indicated in figure 6, where different ‘calibration’ curves are associated with different laser wavelengths off the centre wavelength. What is interesting to note is that, even though an offset laser wavelength gives an incorrect measure of the absolute temperature, the measurement of temperature differences at high temperatures is relatively insensitive to that offset. Figure 7 shows that error for different offsets from the 18 787.795 cm−1 centre wavelength position. This is important for measurements of the microwave energy addition into the flame, which occurs at high temperature.
Figure 6.
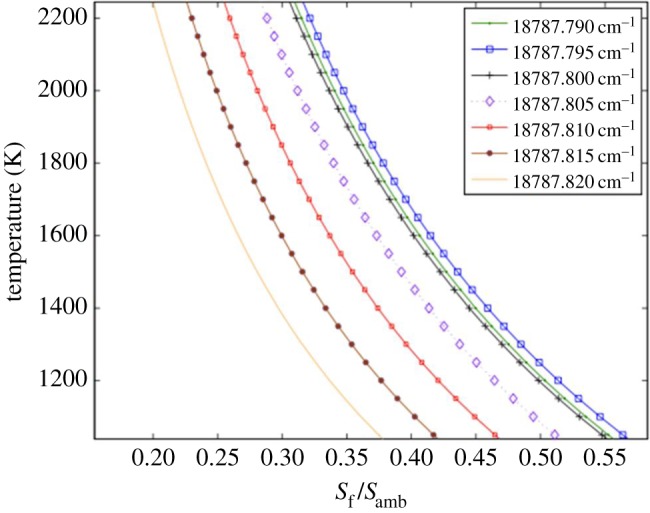
Sensitivity of the calibration curve to the laser wavelength [4]. (Online version in colour.)
Figure 7.
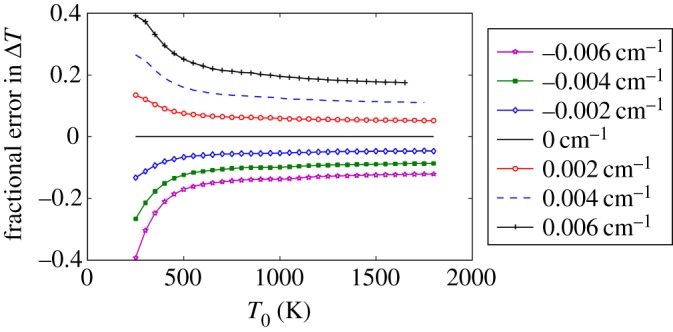
Sensitivity of the filtered Rayleigh measurement of temperature difference as a function of laser wavelength offset from the 18 787.795 cm−1 wavelength [4]. (Online version in colour.)
The measurement of the temperature increase associated with the absorption of pulsed 3 GHz microwave radiation into the flame and the associated increase in flame speed is achieved by passing the laser beam through a small hole in the top plate of the microwave chamber and down through the product gases, through the flame and into the unburned methane/air reactant mixture. The Rayleigh scattering from that line is imaged by the camera through the iodine cell. The measurement is time frozen by the 10 ns pulse length of the frequency-doubled, injection-locked Nd:YAG laser. Figure 8 shows the geometry of the experiment and figure 9 shows the flame luminescence, indicating the location of the flame zone and the increase in the flame speed as a function of the pulse repetition rate of the microwave. Depending on the equivalence ratio, the microwave pulse energy and the repetition rate, a flame speed increase of more than 25% is measured. The filtered Rayleigh scattering experiment was conducted to determine where the energy deposition was occurring and what percentage of the microwave energy was being transferred into heat.
Figure 8.
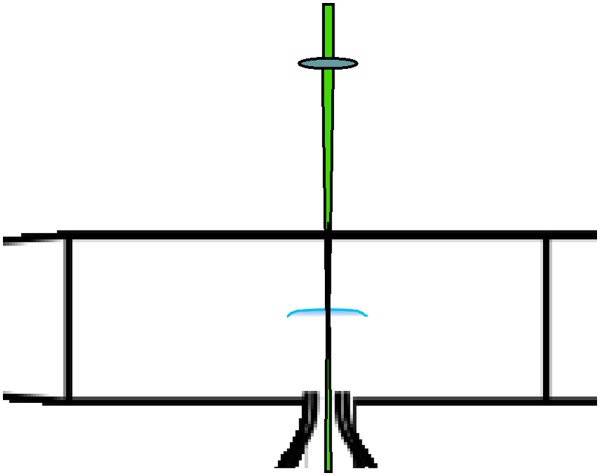
Laser illumination configuration for filtered Rayleigh imaging of the temperature profile through the flame. The narrow linewidth frequency-doubled Nd:YAG laser enters through a hole in the top plate of the microwave cavity [3]. (Online version in colour.)
Figure 9.

Flame luminescence indicating the flame speed increase as a function of the microwave pulse repetition frequency [3]. (Online version in colour.)
Figure 10 shows the results of the filtered Rayleigh measurement for microwave pulse energies of 25 and 50 mJ (1 and 2 μs pulses). Note that the measurement of the absolute temperature past the flame in the absence of microwave energy addition is low, but, as pointed out above, the measurement of the temperature difference associated with the microwave energy addition is reliable. The curves are shifted in position to compensate for the change in flame speed so a direct comparison of temperature change can be made. Here we see that the pulsed microwave energy is added just downstream of the flame front. For 25 mJ this corresponds to approximately a 200 K increase, and for 50 mJ the increase is almost twice that. Given the extent of the flame zone and the increase in the temperature, the energy addition can be estimated using the heat capacity. From this calculation it is found that approximately 60% of the microwave pulse energy is deposited into heating. The measurement of the change in the reflected microwave energy yields approximately the same value, indicating that virtually all of the absorbed microwave energy is deposited as heat. This is a useful result, suggesting that the formation of long-lived radical species produced from the microwave interaction is minimal. The increase in the flame speed is therefore due to the rapid thermal diffusion of heat to the flame front, creating the effect of combustion in higher temperature mixtures.
Figure 10.
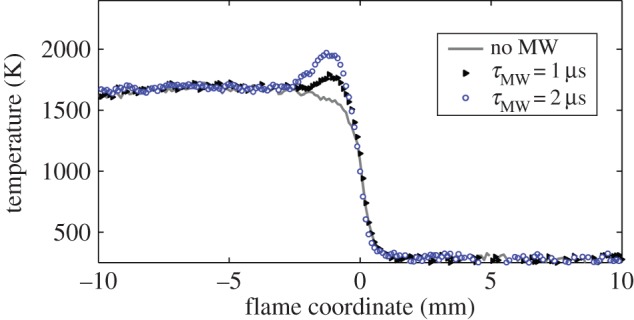
Filtered Rayleigh measured temperature profiles through the flame showing temperature increase from 25 to 50 mJ microwave pulses. The profiles are shifted in position to overlap [4]. (Online version in colour.)
Rayleigh scattering and filtered Rayleigh scattering become less reliable for the measurement of temperature for strong interactions, where the energy addition is rapid, leading to significant ionization, dissociation and heating that occurs in times that are shorter than the acoustic propagation time. In that case, the pressure is no longer uniform and the species present may include significant mole fractions of atomic dissociation fragments, ions and free electrons. This is the typical case when the energy deposition is from a short-pulsed laser. Nevertheless, Rayleigh and filtered Rayleigh scattering can still provide useful information. For example, the depolarization of the Rayleigh scattering can be used as a measure of the dissociation fraction, as atomic species do not depolarize the Rayleigh scattering, but molecular species do [9].
The total Rayleigh scattering power from a molecular gas can be found from the expression
 |
2.4 |
where η is the collection efficiency, Il is the incident laser intensity, N is the number density of scatterers (gas molecules), V is the volume of a resolution element, ΔΩ is the collection solid angle and ∂σ/∂Ω is the differential Rayleigh scattering cross section. If the illuminating laser is polarized orthogonal to the scattering plane (the plane defined by the source, the scatterer and the detector), then for spherically symmetric scatterers the Rayleigh scattering is fully polarized parallel to the illuminating laser polarization. For diatomic molecules, the anisotropy of the polarizability and the random orientation of the molecules leads to some depolarization. The ratio of the depolarized to polarized scattering is [10]
 |
2.5 |
where a is the mean polarizability and γ is the anisotropy. The scattering thus includes a polarization component that lies parallel to the scattering plane. In terms of the ‘King correction factor’, F,
| 2.6 |
For standard air (298 K, 1 atm) at 532 nm, F=1.049 [6], so the depolarization ratio is 0.014. The depolarization ratio for pure oxygen is 0.027, and for nitrogen it is 0.10 [11].
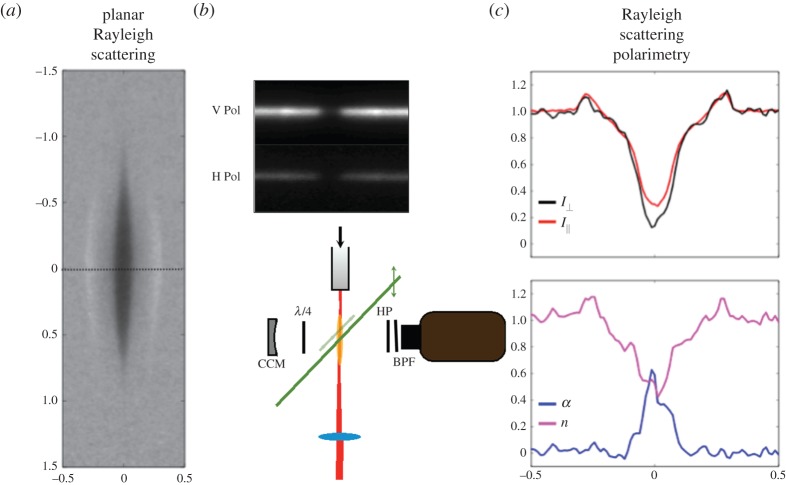
Figure 11 shows the Rayleigh image of a focused, 50 fs laser-heated region in nitrogen taken 0.5 μs after the femtosecond laser pulse. In the image, the region of high temperature corresponding to low density is seen along with the departing shock waves. By measuring the depolarization ratio transversely across the centre of the energy addition region the distribution of dissociated atomic species can be determined, along with the total atomic number density (figure 11a). This is achieved by using a double line imaging approach, as shown in the figure 11b. A polarizer is placed in front of the camera, passing only horizontal polarization (the depolarized component). The vertical component is captured in an offset line that is formed by reimaging the scattering away from the camera after a double pass through a quarter wave plate. Thus two lines are seen on the camera, one of the horizontal component and the other of the vertical component. By analysing these two polarization components, the dissociation fraction and the relative atomic number density can be determined, as shown in figure 11c. By following the total scattering and the depolarization with time, the recombination rate can be found. Figure 12 shows the evolution of the total density, the dissociation fraction, the atomic number density and the nitrogen recombination (first positive) emission at the centre of the laser-heated region as a function of time.
Figure 11.
Planar Rayleigh image of the femtosecond laser pulse energy deposition region in nitrogen (a). Set-up for Rayleigh polarimetry (b). Simultaneous measurement of the dissociation fraction, α, and the atomic number density, n, across the interaction region (c) [9]. (Online version in colour.)
Figure 12.

Time evolution of the dissociation fraction, atomic nitrogen density, total density and the first positive emission from the femtosecond laser energy deposition in nitrogen [9]. (Online version in colour.)
Illuminating the laser-heated region simultaneously with three different wavelength laser beams provides a method for separating Thomson scattering from Rayleigh scattering by normalizing the scattering amplitude from each by the inverse fourth power of the wavelength [12]. Rayleigh scattering increases as the inverse fourth power of the wavelength, but Thomson scattering does not. Figure 13 shows the scattering collected across the centre of a spark in air 2 μs after it was created by a focused Nd:YAG 1.064 μm laser pulse. The strong shock waves can be seen moving outwards symmetrically from the centre of the spark. The simultaneous scatterings from the three wavelengths, 532 nm, 633 nm and 780 nm, are scaled by the inverse fourth power of the wavelength and are normalized to fall on top of each other in the unperturbed air region beyond the shock wave. Within the shock they are also closely overlapped, indicating that the shock is not strong enough to create ionization. Within the thermally heated core of the spark, they are widely separated, indicating that Thomson scattering from electrons dominates in this region.
Figure 13.

Separation of Thomson from Rayleigh scattering using three simultaneous laser wavelengths and normalizing to the Rayleigh wavelength scaling [12]. (Online version in colour.)
The spectral broadening of the Thomson scattering is similar to that of the Rayleigh, but arises from the motion of electrons and ions rather than neutral species. The broadening parameter, α, is analogous to the Rayleigh y parameter
 |
2.7 |
where lD is the Debye length
 |
2.8 |
and ε0 is the free space permittivity, kb is the Boltzmann constant, Te is the electron temperature, ne is the electron density and e is the electron charge. If α≫1, then the Thomson scattering is in the coherent regime, and the spectra are peaked around the electron plasma and ion acoustic waves. For α≪1, the broadening reflects the electron and ion velocity distributions, which are assumed to be Maxwell–Boltzmann for this study. The Thomson spectrum is the sum of the electron and ion components. The Thomson scattering ion component is caused by the influence of ion density fluctuations on the electrons, mediated through the Coulomb interaction. The observed scattering is physically from electrons. The broadening from ions and electrons is very different owing to their mass difference. Figure 14 shows the spectral profiles of each for various values of α, plotted against the normalized frequency shift,
 |
2.9 |
where ve,i is the thermal velocity of electrons and ions, respectively,
 |
2.10 |
and ωT is the Thomson spectral frequency shift in radians. The scales in figure 14a,b reflect the relative strengths of the scattering, and the total integrated contribution, S, from ions and electrons as a function of α is shown in figure 15. Note that with increasing α the ion contribution increases relative to the electron contribution. The Thomson ion spectral broadening is much less than the electron broadening by the square root of the mass ratio. For example, for atomic nitrogen ions, ion broadening is 0.006 of the electron broadening.
Figure 14.
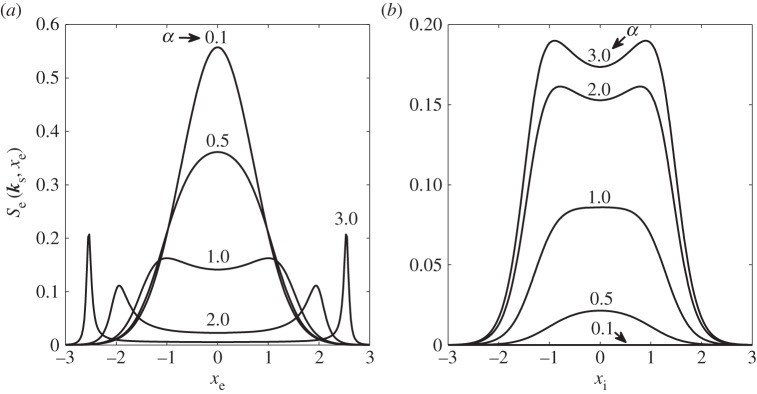
Electron (a) and ion (b) Thomson scattering spectra as a function of normalized frequency for various values of α.
Figure 15.
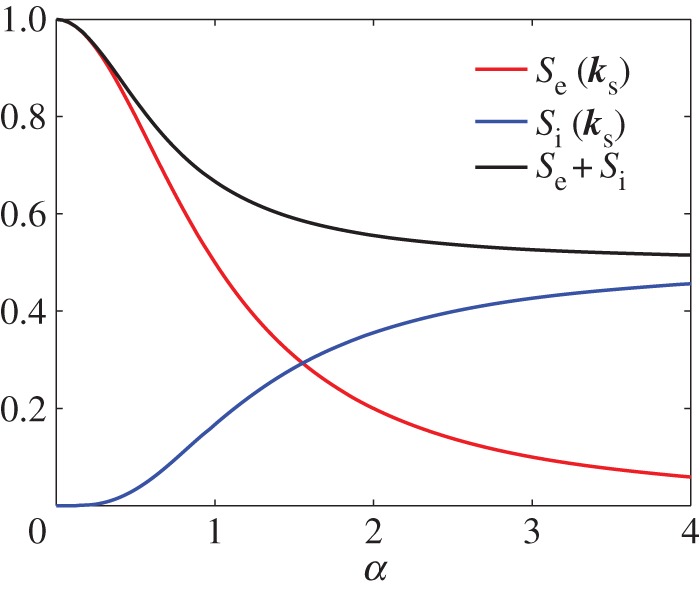
Normalized integrated line strengths of the electron and ion Thomson scattering as a function of α. (Online version in colour.)
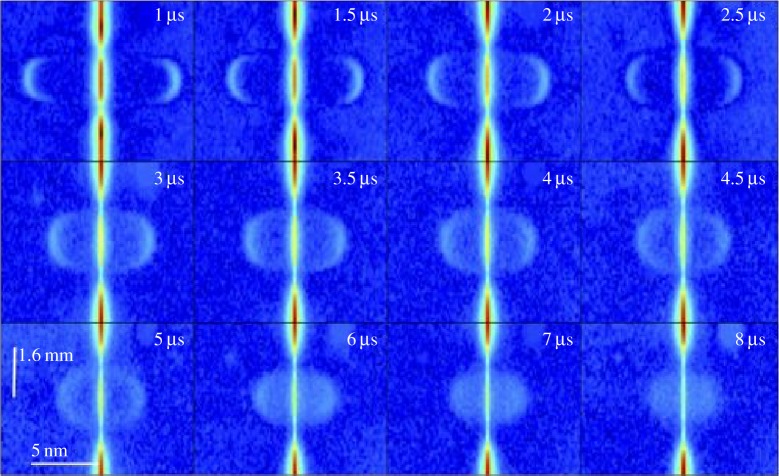
Thomson scattering through a cross section of the laser-generated spark along the probe laser line can be imaged onto the entrance slit of a spectrometer to create hyperspectral time-sequenced images, which provide a time accurate measure of electron density and temperature [12]. Figure 16 shows these images with the vertical direction corresponding to the position along the probe laser as it crosses through the spark and the horizontal direction showing the Thomson scattering spectrum as a function of that position. Outside of the spark region (above and below the centre of the line in each panel), the scattering is purely Rayleigh and the broadening is too small to be resolved by the spectrometer. The continuation of that line through the spark is the unresolved Thomson scattering from the ions and residual Rayleigh scattering from the neutral species. The electron Thomson scattering spectra are very broad due to the high temperature, small mass and corresponding high velocity of the electrons. Note that, in the short time domain (<5 μs), coherent Thomson scattering dominates and the scattering is peaked at the frequency associated with electron plasma waves. In the incoherent limit (long delays), the spectrum reflects the electron velocity distribution.
Figure 16.
Hyperspectral images of Thomson scattering profiles across the laser spark for time delays from 1 to 8 μs [12]. (Online version in colour.)
The spectral profiles in these images give a measure of the time evolution of the electron number density and electron temperature along the laser spark. Extracting the electron number density and temperature by modelling and fitting of the experimental spectra is described in Froula et al. [13]. Figure 17 shows the time evolution of these quantities at the centre point of the laser spark.
Figure 17.
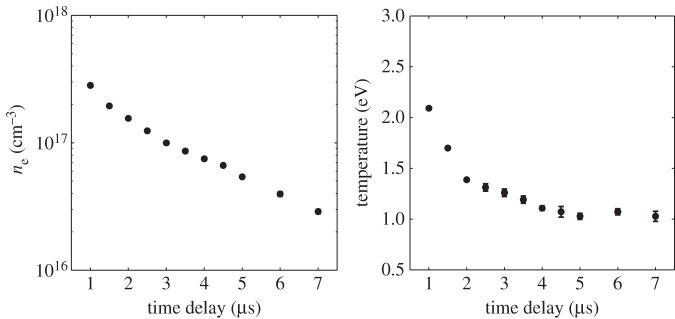
Time evolution of the electron density and temperature at the centre of the laser-generated spark computed from the images in figure 16 [12].
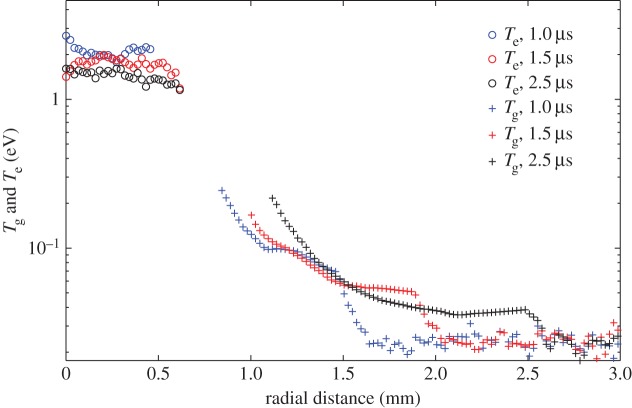
If the laser is tuned to a wavelength near the rising edge of the optically thick iodine absorption line, then a velocity component in the flow frequency shifts the scattering and changes the transmission of the filter. The Doppler frequency shift of the Rayleigh scattered light is associated with the motion of the molecules along the direction corresponding to the bisector of the angle between the illumination source and the detector. Thus bringing two laser beams from the same laser simultaneously from opposing directions and offsetting the two images produces a pair of line images, one upshifted in frequency and the other downshifted in frequency associated with the motion of the gas [14]. Figure 18 shows the normalized filtered scattering from the two counter-propagating probe beams as well as the unfiltered Rayleigh scattering as a function of position from the centre of the laser-produced plasma for various time delays. The scattering in the core (0 mm) is predominantly Thomson and the scattering from the shock and the air further away from the core is predominantly Rayleigh. The edge-filtered Rayleigh signal strengths associated with the positive moving component compared with the negative moving component of the shock gives a good measure of the shock velocity and strength. These three components can be used to determine the shock speed, the temperature, the density and the pressure as a function of time and radial distance to within about 1 mm of the core. Combining the Thomson scattering with the filtered Rayleigh scattering yields electron and gas temperature profiles for the spark evolution, as shown in figure 19.
Figure 18.
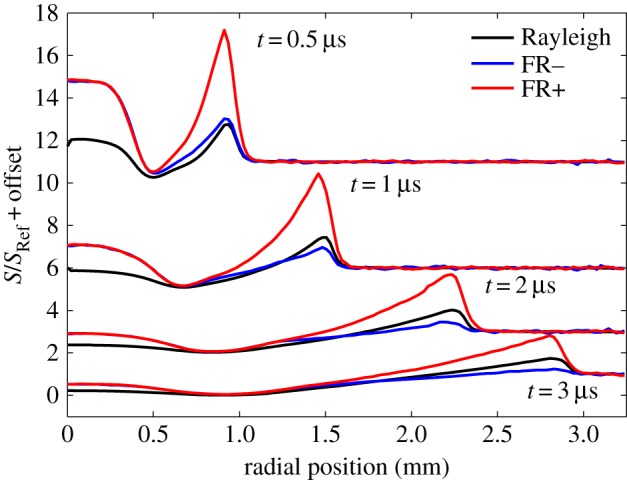
Normalized profiles of Rayleigh, Thomson and separate filtered Rayleigh from opposite propagating laser probes across a laser spark showing the evolution of the shock front and unfiltered scattering at various time delays [14]. (Online version in colour.)
Figure 19.
Radial profiles of electron and gas temperatures combining Thomson, Rayleigh and filtered Rayleigh images [14]. (Online version in colour.)
3. Radar resonance-enhanced multi-photon ionization
Measuring the concentration of radical species in combusting and in plasma environments is normally accomplished by laser-induced fluorescence (LIF) or two-photon absorption laser-induced fluorescence (TALIF) methods. Establishing quantitative species concentration values by LIF or TALIF measurement is difficult owing to quenching of the fluorescence. This problem arises due to the long fluorescence lifetimes (tens to hundreds of nanoseconds) associated with many of the species of interest, much longer than the collision time. Quenching is a function of the colliding species concentrations, the temperature and the pressure associated with the local environment [15]. Radar REMPI [16] has the potential to overcome that problem through laser-driven resonant multi-photon ionization of the selected species and the immediate detection of that ionization by microwave scattering. The detection uses the very high sensitivity associated with homodyne and heterodyne microwave signal detection. Picosecond laser multi-photon ionization and 100 GHz microwave scattering detected with heterodyne mixing lead to detection in sub-nanosecond time scales, minimizing the influence of collisional quenching. Radar REMPI also makes possible in situ measurements of the electron loss rate in arbitrary gas mixtures. An example is the direct measurement of the three-body electron attachment rates in dry and humid air [17]. The measured electron attachment rate to oxygen of ν=0.76±0.05×10⁸ s−1 in dry air at 1 atmosphere is in very good agreement with predictions based on low-pressure literature data.
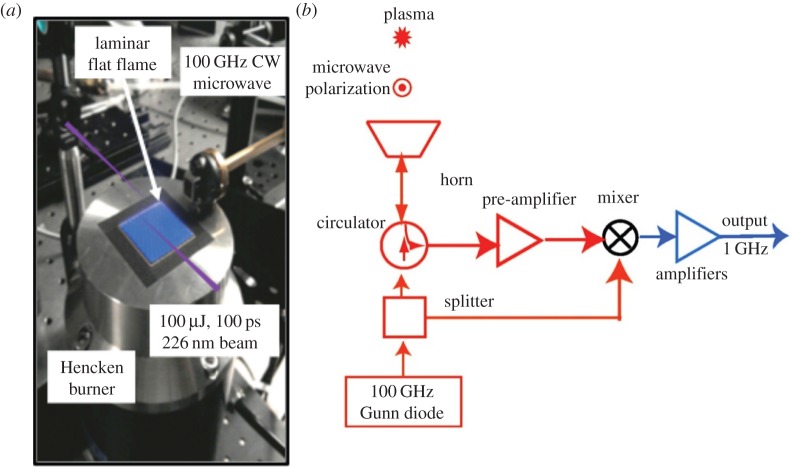
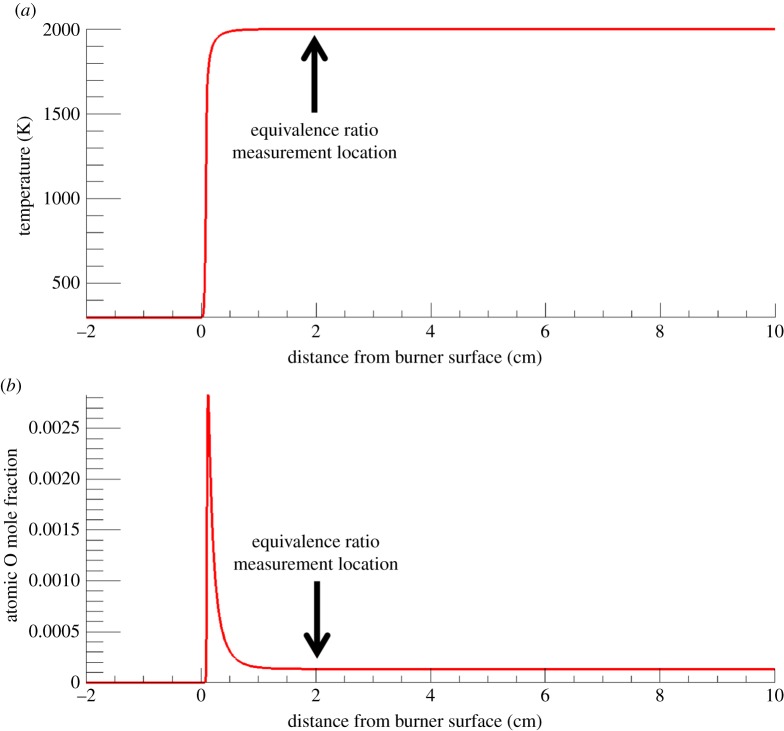
The application of radar REMPI to flames provides opportunities for the localized measurement of atomic and molecular species. For example, the measurement of atomic oxygen uses a two-photon resonant, three-photon ionization process (2+1 REMPI) with the laser tuned to the 2s22p43P2 (ground state) to 2s22p3(4S°) 3p3P oxygen transition at 225.6 nm, shown in figure 20a. Xenon has a similar two-photon resonant, three-photon ionization at almost the same wavelength, shown in figure 20b. This can serve as a convenient reference if a known mole fraction of xenon is added to the combusting gas. The experimental set-up for the application of radar REMPI for the measurement of atomic oxygen over a Hencken burner is shown in figure 21 [18]. The 100 GHz microwave is operated continuously (CW), radiating a few tens of milliwatts through a few millimetre scale microwave horn seen in the picture, and illuminates the general region where the measurement is to be made. The microwaves scattered from the laser-generated resonant-enhanced multi-photon ionization are collected by the same horn and passed through a pre-amplifier into the mixer. The output signal bandwidth is approximately 1 GHz, permitting the high temporal resolution. Figure 22 shows the location of the measurement relative to the flame front and the Chemkin predicted temperature and atomic oxygen mole fraction for an equivalence ratio of 0.8. Figure 23 shows the linearity of the xenon radar REMPI signal in a methane/air mixture and figure 24 presents the measurement of the atomic oxygen mole fraction downstream of the flame over the Hencken burner [19]. The measurement of the atomic oxygen mole fraction with distance (figure 14a) is relatively constant in the 5–30 mm region, as predicted by Chemkin. The non-zero off-resonance signal indicates that some background ionization may be contributing. With the background subtracted, the radar REMPI measurement with equivalence ratio (figure 14b) echoes the Chemkin prediction. The origin of the non-resonant signal is currently under study, but may arise from laser dissociation of molecular oxygen on the fuel-lean side and carbon dioxide on the fuel-rich side [18].
Figure 20.
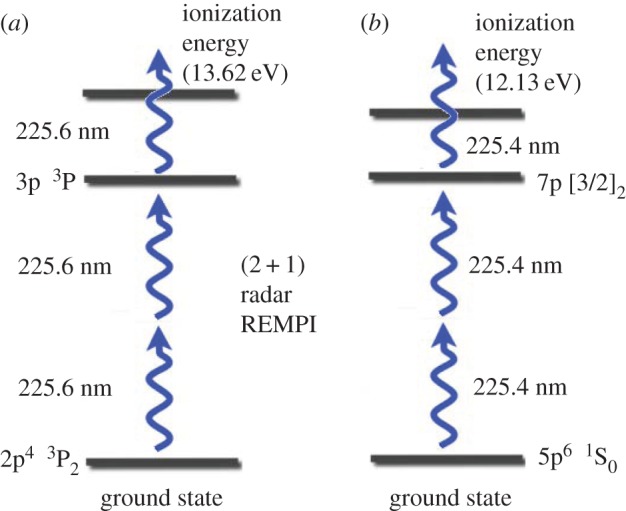
2+1 radar REMPI transitions in atomic oxygen (a) and xenon (b). The close proximity of the two-photon transitions to each other makes xenon a convenient reference species. (Online version in colour.)
Figure 21.
Radar REMPI set-up for the measurement of atomic oxygen over a Hencken burner (a) and diagram of the microwave homodyne detection system (b) [18]. (Online version in colour.)
Figure 22.
Temperature and oxygen mole fractions above a methane/air Hencken burner flame. (a) Chemkin-predicted temperature profile. (b) Chemkin-predicted oxygen mole fraction [18]. Arrows show the location of the equivalence ratio measurements. (Online version in colour.)
Figure 23.
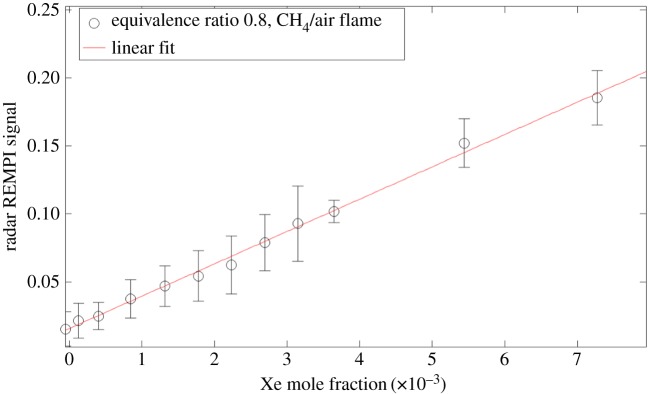
Experimental radar REMPI measurement of the xenon mole fraction in air showing linearity of the signal with mole fraction concentration [18]. (Online version in colour.)
Figure 24.
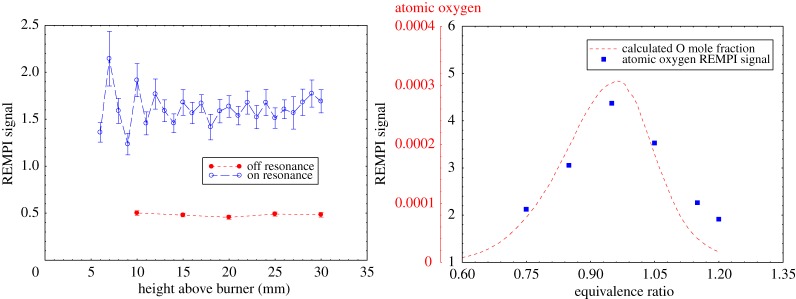
Radar REMPI measurement of the atomic oxygen concentration variation with distance and equivalence ratio downstream of a methane/air flame. Height measurements are at an equivalence ratio of 0.8. Equivalence ratio measurements are taken 2 cm above the burner surface [19]. (Online version in colour.)
Radar REMPI applied to molecular species can be used to determine temperature through the rotational–vibrational spectrum associated with the resonant transitions. For example, over the wavelength range between 283.5 and 293.9 nm there are a number of well-resolved rotation lines associated with the two-photon resonant transition from the nitrogen  ground state to the a1Πg excited state [20]. Following the excitation of these two-photon resonances, another two photons promote the molecules to ionization, leading to a 2+2 radar REMPI signal. By scanning the laser through the rotational levels and fitting the spectrum, the Boltzmann distribution of rotational state populations can be recovered, providing a measurement of the rotational temperature. For this measurement, circular polarized light is required in order to remove background interference [21]. The theoretical and experimental two-photon resonant 2+2 radar REMPI spectra of molecular nitrogen at three temperatures are shown together with the fitted theoretical spectra in figure 25.
Figure 25.
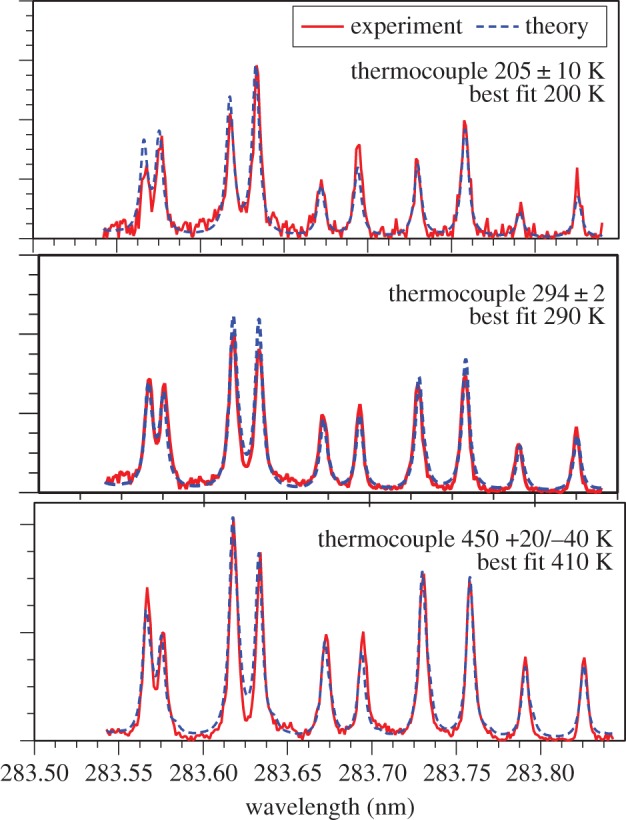
Experimental and theoretical fits for the radar REMPI measurement of temperature using the rotational spectrum of nitrogen [21]. (Online version in colour.)
Nitric oxide is another species of great interest for combustion as it is a major contributor to pollution associated with combustion processes. Much work is underway to minimize the formation of nitric oxide, and spatially precise and time accurate measurements of that species in high-pressure environments are of particular interest. Nitric oxide is an excellent candidate for radar REMPI as the one-photon resonance near 226 nm can be used and a second photon at the same wavelength leads to ionization. Figure 26 shows the 1+1 radar REMPI spectra of nitric oxide in the vicinity of 226.4 nm (44 170 cm−1) in nitrogen. Measurements of trace nitric oxide in air have been achieved to tens of parts per billion [22]. The production of nitric oxide that is associated with plasma-enhanced combustion is relevant as one of the motivations for plasma-enhanced combustion is operation at lower temperatures leading to a reduction of nitric oxide.
Figure 26.

Nitric oxide spectrum in the vicinity of 226.4 nm [22]. (Online version in colour.)
Experiments were conducted to determine what the pulsed microwave coupling to the flame did with regard to the formation of nitric oxide [4]. In this case, the nitric oxide was detected far from the flame front in the gas exiting the small hole in the top of the microwave resonant chamber (figure 27). The radar REMPI set-up used a 100 GHz continuous microwave source and the same homodyne arrangement as shown in figure 21. The measurement is taken with the laser tuned to the largest NO peak at 44 177 cm−1. The results are shown in figure 28 for a methane/air flame with an equivalence ratio of 0.8. They indicate that at the 12 W maximum power absorbed, corresponding to a microwave pulse repetition rate of 1000 Hz, the NO concentration has increased by a factor of 3. This result corresponds to what would be expected from an average temperature increase of between 50 and 100 K over the adiabatic flame temperature. Referring back to figure 10 this is significantly less than the peak temperature associated with the microwave energy addition.
Figure 27.

Experimental set-up for the detection of nitric oxide produced by the microwave energy coupled to the flame inside the microwave cavity [4]. (Online version in colour.)
Figure 28.
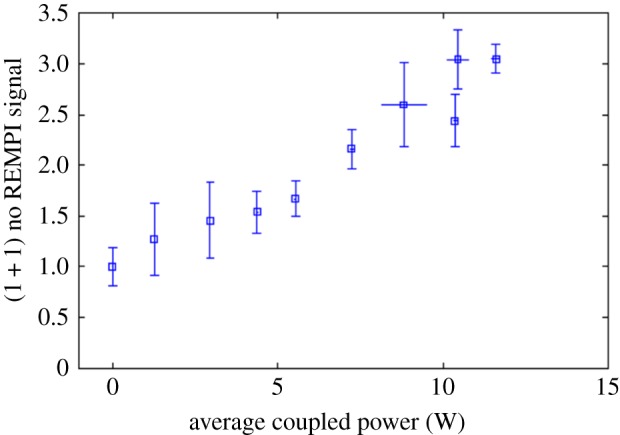
Radar REMPI measurement of the increase in nitric oxide associated with the microwave coupling to a 0.8 equivalence ratio methane/air flame [4]. (Online version in colour.)
4. Femtosecond laser electronic excitation tagging
The development of millijoule and higher energy femtosecond laser technology provides new avenues for diagnostics. Femtosecond lasers interact with air and gas mixtures in very different ways from longer pulsed lasers as the interaction time is fast compared with the electron avalanche breakdown time [23]. This enables the laser to penetrate into the gas without generating a bright spark and deposit energy in a well-defined and controllable pattern. The high intensity of the lasers also leads to multi-photon interactions, enabling very high energy states to be excited and dissociation to be achieved with laser pulses whose photon energy is far below single-photon thresholds for these processes. Thus interactions that usually require ultraviolet wavelengths can be achieved with infrared photons. Femtosecond laser electronic excitation tagging (FLEET) [24,25] is an example of this. As the laser passes through the gas mixture, it both excites and dissociates the molecular species in that mixture. This interaction occurs along the track of the laser, through the laser focal zone. This process can be used to measure both velocity and temperature profiles. A convenient example is nitrogen [26], which is present in almost all gases of interest for combustion. A simplified energy-level diagram for nitrogen is shown in figure 29. Note that the photon energy of the Ti:sapphire laser, indicated by the arrow at the bottom of the figure, is far below any of the excited electronic states. Through multi-photon interactions, the femtosecond laser pulse excites and dissociates the nitrogen, producing prompt and delayed fluorescence. The prompt fluorescence lasts for tens of nanoseconds and is primarily from first negative (N to X) and second positive (N2 C to B) emission as indicated on the figure. The delayed fluorescence arises from the recombination of the dissociated nitrogen atoms (dashed line in figure 29) which populate the electronic B state leading to first positive emission (N2B to A). This emission is delayed by the time it takes for the atoms to recombine, which is tens of microseconds.
Figure 29.
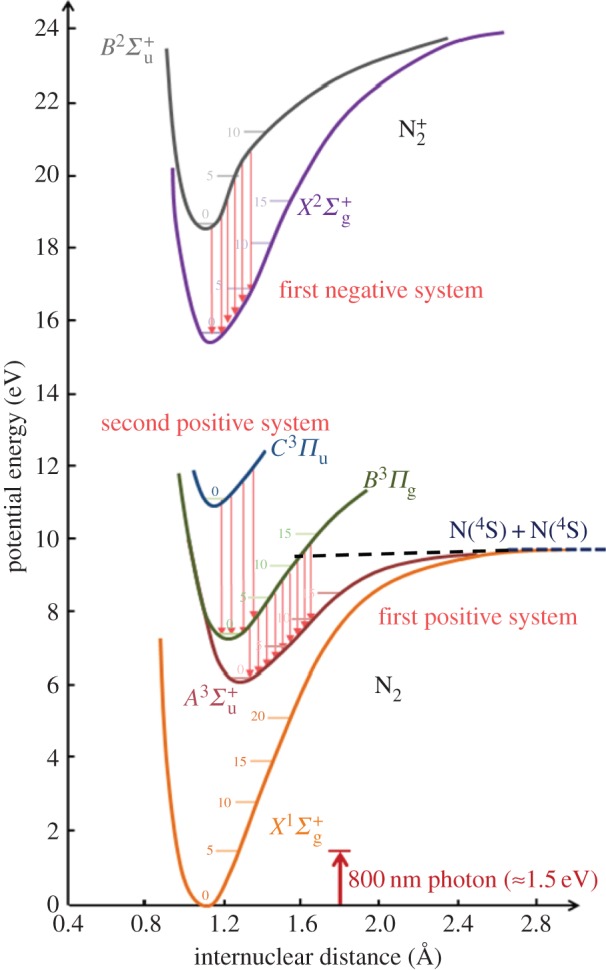
Nitrogen energy-level diagram showing emission manifolds, recombination energy trajectory and the relative energy of the femtosecond laser photons. (Online version in colour.)
The prompt emission is primarily in the ultraviolet and provides a method for the measurement of the temperature along the path through the region of the laser focus. This is achieved by fitting the second positive and first negative emission spectra to models. Figure 30 shows the modelled and experimental emission spectra of the first negative and second positive emission, indicating the associated change in vibrational quantum number. At atmospheric pressure, the collision time for equilibration of the rotational states is sub-nanosecond, so, as the first negative and second positive emission lasts for many nanoseconds, the rotational modes have equilibrated with the surrounding gas and reflect the local temperature. Thus by fitting the rotational tails of the spectrum, the temperature profile along the laser beam path can be extracted.
Figure 30.
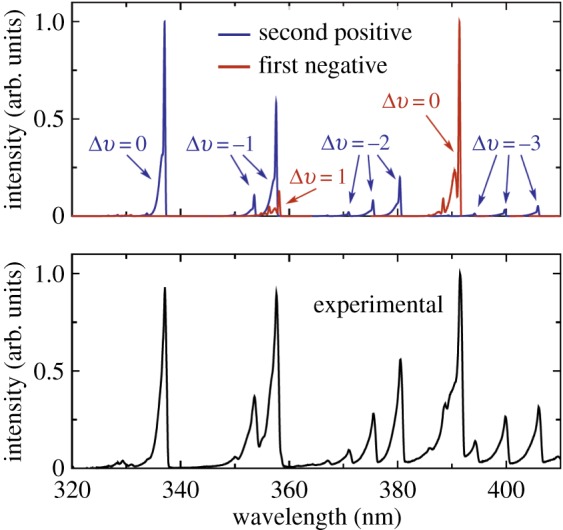
Prompt ultraviolet emission spectra associated with the first negative and second positive emission of nitrogen [25]. (Online version in colour.)
Figure 31 provides a closer look at the 352–358 nm region, indicating the sensitivity of the rotational tails to the local temperature. A least-squares fit yields a temperature of 485 K, which is approximately 185 K higher than the room temperature at which the experiment was conducted [24]. This increase in temperature is associated with the energy deposited by the laser. It varies with temperature and can be removed by calibration. Figure 32 shows the calibration curve taken using a hot air jet and comparing the measured FLEET temperature with that of a thermocouple. Once this calibration is established, the measurement of temperature can be achieved. The spectrum from each point along a line can be measured by imaging the prompt fluorescence along the line onto the slit of a spectrometer. Figure 33 shows that configuration and the hyperspectral image of the spectrum along the laser line. As the emission occurs within a few tens of nanoseconds, this approach can be used even with flows moving at high speed. Note that the region of the spectrum captured in the hyperspectral image in figure 33 includes the first negative emission band from N at 391 nm, and that emission changes relative to the centre of the laser focus, indicating an increased level of excitation near the laser focal region.
Figure 31.
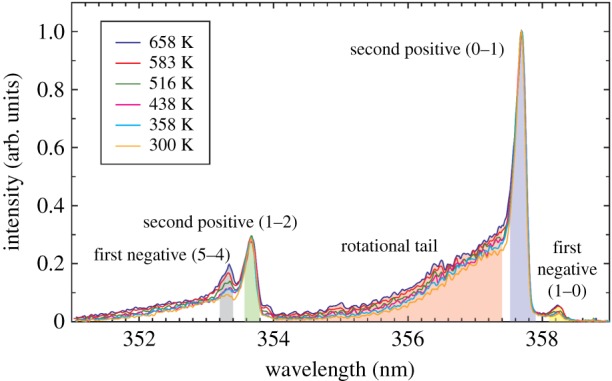
Prompt emission from nitrogen arising from the second positive and first negative manifolds as a function of rotational temperature [26]. (Online version in colour.)
Figure 32.
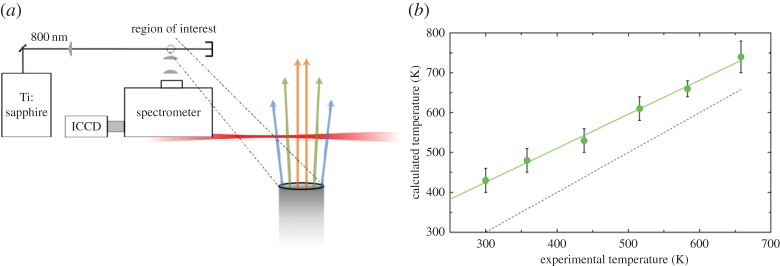
Calibration of the temperature offset from the rotational fitting of the FLEET prompt emission relative to thermocouple measurements across a hot air jet (left) [26]. (Online version in colour.)
Figure 33.

Hyperspectral measurement of the FLEET prompt emission spectrum along the probe laser line showing increased formation of N in the high-intensity region nearest to the focal zone [26]. (Online version in colour.)
The delayed emission from the FLEET line can be used to capture the motion of the flow. In cold air, this emission lasts for tens of microseconds and it can be used for instantaneous imaging of displacement and thus velocity using a time-gated camera. An example of this is the measurement of the exit velocity of gases from a pulse detonation experiment at the Air Force Research Laboratory, Ohio, USA [27]. Figure 34 shows the set-up, the displaced line image and the measured velocity profiles from that experiment. The average exit velocity profiles show a relatively uniform supersonic flow at approximately 1200 m s−1.
Figure 34.
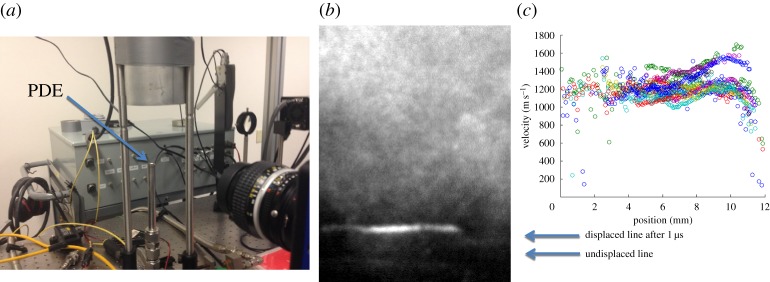
FLEET application to the measurement of the exit velocity from a pulse detonation engine experiment at the Air Force Research Laboratory. (a) Experimental set-up with vertical pulse detonation tube; (b) displaced FLEET line after a delay of 1 μs; and (c) the measured exit velocity profiles for several runs [27]. (Online version in colour.)
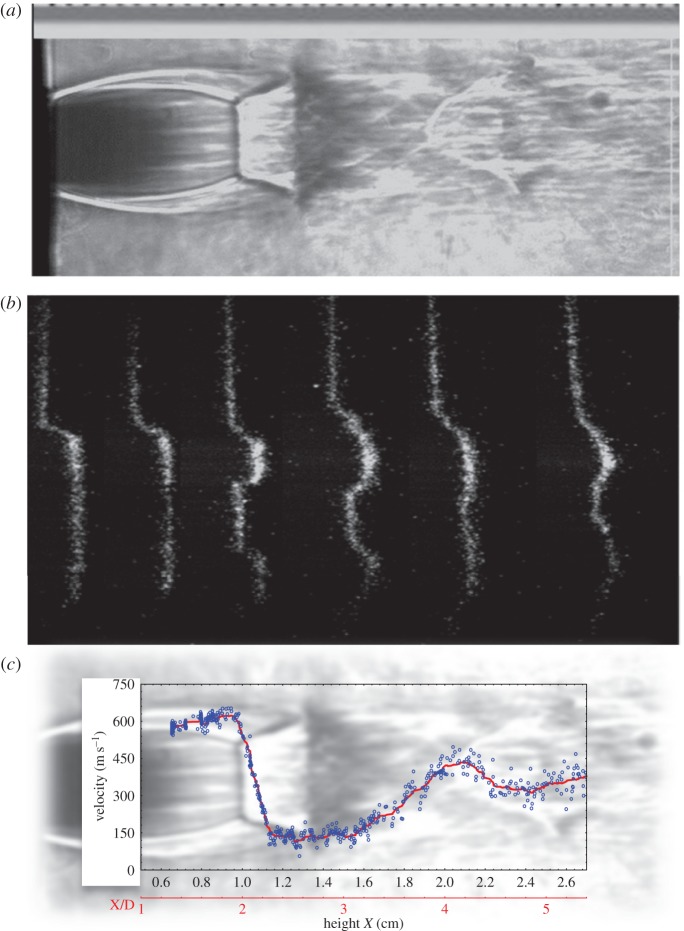
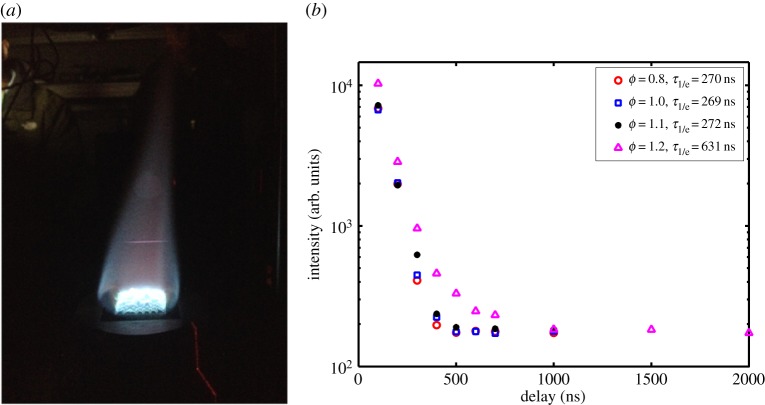
Experiments in an underexpanded supersonic free air jet show the displacement somewhat more clearly (figure 35). FLEET also is capable of tagging lines in a combusting environment because the combustion temperatures are far below the temperatures leading to nitrogen dissociation. The limitation is that the delay times that can be achieved are significantly shorter, perhaps due to the recombination of atomic nitrogen with other radical species such as atomic oxygen. Figure 36 shows an image of the FLEET fluorescence in the region downstream of a methane/air Hencken burner flame and the lifetime of the fluorescence as a function of the methane/air equivalence ratio. Gating times of more than 1 μs can be achieved with reasonable signal levels. For high-speed combustion this delay is sufficient to allow significant displacement and good measurements of velocity profiles, as seen in the pulse detonation engine example. Stronger signals may be achievable by taking advantage of fluorescence from other species such as methane or NO that are present in the flow.
Figure 35.
FLEET of an underexpanded supersonic air jet. (a) Schlieren image of the jet showing the Mach disc and other relevant structure; (b) FLEET lines tagged across the free jet; and (c) measurement of the free jet velocity from the FLEET displacement. (Online version in colour.)
Figure 36.
Image of a FLEET emission line over the flame in a Hencken burner (a) and measurement of the lifetime of the FLEET line downstream of a methane/air flame at various equivalence ratios (b). Inset gives the e−1 times for those measurements [27]. (Online version in colour.)
5. Conclusion
The interaction of plasmas with combusting and pre-combusting environments is a promising new area of research with potential applications to advanced control methodologies, greater reliability, improved efficiency and reduced pollution production. New methods have been presented here to assist with the understanding of these processes. These new approaches to light scattering from molecules, atoms and electrons provide nanosecond- and picosecond-resolved planar and profile imaging opportunities for temperature imaging, for the separation of atomic from molecular Rayleigh scattering, for the separation of Rayleigh from Thomson scattering and for the simultaneous measurement of velocity, temperature and density profiles. The combination of microwave scattering with highly selective resonant-enhanced multi-photon ionization provides for high-sensitivity detection for trace molecules in air and is a method for stand-off measurement of atomic and molecular species in flames and in weakly ionized plasma environments. New femtosecond laser methods provide expanded opportunities for the measurement of velocity and temperature profiles. These methods, coupled with other approaches such as TALIF, coherent anti-Stokes Raman scattering (CARS) and LIF provide a wide array of minimally invasive stand-off approaches for spatially resolved, time accurate measurements of plasma-related combustion phenomena.
Authors’ contributions
R.B.M. oversaw the research, participated in the data analysis and led the manuscript writing effort; J.B.M. conducted the experiments on the microwave energy addition to flames and Rayleigh diagnostics for the measurement of temperature; C.M.L. conducted research on the development of Rayleigh and Thomson scattering diagnostic methods for the study of laser energy deposition; S.D.M. conducted experiments on radar REMPI for the study of molecular gases; T.L.C. conducted research on radar REMPI for the study of atomic gases; M.R.E. developed the FLEET method and applied it in air and nitrogen; N.J.D. extended the FLEET method to the study of high pulse energies and pulse detonation environments; M.N.S. developed physical models and numerical methods to understand laser interactions with air and laser Rayleigh scattering; and A.D. oversaw all picosecond and femtosecond laser-related experiments including the development and application of FLEET. All authors gave final approval for publication.
Competing interests
The authors declare that they have no competing interests
Funding
Much of the work reported here was supported by AFOSR under the MURI program led by Prof Walter Lempert at Ohio State University and overseen by Dr Julian Tishkoff and Dr Chiping Li. Additional support for the development of diagnostics came from AFOSR under Dr John Schmisseur, from Dr Paul Danehy at NASA and from Dr James Gord at the Air Force Research Laboratory. Support for students was also provided by NDSEG, NSF and Princeton Plasma Science and Technology fellowships.
References
- 1.Calcote HF, Pease RN. 1952. Electrical properties of flames. Burner flames in longitudinal electric fields. Ind. Eng. Chem. 43, 2726–2731. ( 10.1021/ie50504a032) [DOI] [Google Scholar]
- 2.Stockman ES, Zaidi SH, Miles RB, Carter CD, Ryan MD. 2009. Measurements of combustion properties in a microwave enhanced flame. Combust. Flame 156, 1453–1461. ( 10.1016/j.combustflame.2009.02.006) [DOI] [Google Scholar]
- 3.Stockman E, Zaidi SH, Miles RB. 2007. Hydrocarbon flame speed enhancement with high power pulsed microwaves. In Proc. 38th Plasma Dynamics and Lasers Conf., Miami, FL, 25–28 June 2007. Reston, VA: American Institute of Aeronautics and Astronautics [Google Scholar]
- 4.Michael JB, Chng TL, Miles RB. 2013. Sustained propagation of ultra-lean methane/air flames with pulsed microwave energy deposition. Combust. Flame 160, 796–807. ( 10.1016/j.combustflame.2012.12.006) [DOI] [Google Scholar]
- 5.Miles RB, Yalin A, Tang Z, Zaidi SH, Forkey J. 2001. Flow field imaging through sharp-edged atomic and molecular notch filters. J. Meas. Sci. Technol. 12, 442–451. ( 10.1088/0957-0233/12/4/308) [DOI] [Google Scholar]
- 6.Miles RB, Lempert WR, Forkey JN. 2001. Laser Rayleigh scattering. Meas. Sci. Technol. 12, 33 ( 10.1088/0957-0233/12/5/201) [DOI] [Google Scholar]
- 7.Tenti G, Boley CD, Desai RC. 1974. Kinetic-model description of Rayleigh-Brillouin scattering from molecular gases can. J. Phys. 52, 285 [Google Scholar]
- 8.Pan X, Shneider MN, Miles RB. 2004. Coherent Rayleigh–Brillouin scattering in molecular gases. Phys. Rev. A 69, 033814. [DOI] [PubMed] [Google Scholar]
- 9.Limbach C, Miles RB. 2015. Characterization of dissociation and gas heating in femtosecond laser plasma with planar Rayleigh scattering and Rayleigh scattering polarimetry In Proc. 53rd AIAA Aerospace Sciences Meeting, Kissimmee, FL, 5–8 January 2015. Reston, VA: American Institute of Aeronautics and Astronautics [Google Scholar]
- 10.Long DA. 1977. Raman spectroscopy, ch. 3 New York, NY: McGraw Hill. [Google Scholar]
- 11.Fielding J, Frank JH, Kaiser SA, Smooke MD, Long MB. 2002. Polarized/depolarized Rayleigh scattering for determining fuel concentrations in flames. Proc. Combust. Inst. 29, 2703–2709. ( 10.1016/S1540-7489(02)80329-7) [DOI] [Google Scholar]
- 12.Limbach C, Miles RB. 2014. Rayleigh and Thomson scattering diagnostics of laser air sparks: a testbed for tailoring laser plasmas. In Proc. 45th AIAA Plasmadynamics and Lasers Conference, Atlanta, GA, 16–19 June 2014. Reston, VA: American Institute of Aeronautics and Astronautics [Google Scholar]
- 13.Froula DH, Glenzer SH, Luhmann NC, Jr, Sheffield J. 2011. Plasma scattering of electromagnetic radiation: theory and measurement. Amsterdam, The Netherlands: Elsevier. [Google Scholar]
- 14.Limbach C, Miles RB. 2014. Simultaneous temperature, density and velocity measurements in laser-generated plasmas by Rayleigh and filtered Rayleigh scattering. In Proc. 52nd AIAA Aerospace Sciences Meeting, National Harbor, MD, 13–16 January 2014. Reston, VA: American Institute of Aeronautics and Astronautics [Google Scholar]
- 15.Tamura M, Berg PA, Harrington JE, Luque J, Jeffries JB, Smith GP, Crosley DR. 1998. Collisional quenching of CH(A), OH(A), and NO(A) in low pressure hydrocarbon flames. Combust. Flame 114, 502–514. ( 10.1016/S0010-2180(97)00324-6) [DOI] [Google Scholar]
- 16.Miles RB, Zhang Z, Zaidi SH, Shneider MN. 2007. Microwave scattering from laser ionized molecules: a new approach to nonintrusive diagnostics. AIAA J. 54, 513–515. ( 10.2514/1.28964) [DOI] [Google Scholar]
- 17.Dogariu A, Shneider MN, Miles RB. 2013. Versatile radar measurement of the electron loss rate in air. Appl. Phys. Lett. 103, 224102 ( 10.1063/1.4828817) [DOI] [Google Scholar]
- 18.Chng TL, Miles RB. 2014. Absolute concentration measurements of atomic oxygen in a flame using radar REMPI. In Proc. 52nd AIAA Aerospace Sciences Meeting, National Harbor, MD, 13–16 January 2014. Reston, VA: American Institute of Aeronautics and Astronautics [Google Scholar]
- 19.Dogariu A, Michael J, Stockman E, Miles RB. 2009. Atomic oxygen detection using radar REMPI. In Proc. Conf. on Lasers and Electro-Optics/Int. Quantum Electronics Conf., Baltimore,MD, 2–4 June 2009. Washington, DC: Optical Society of America. [Google Scholar]
- 20.McGuire S, Miles RB. 2014. Radar REMPI measurements of N2 rotational temperature. In Proc. 45th AIAA Plasmadynamics and Lasers Conference, Atlanta, GA, 16–19 June 2014. Reston, VA: American Institute of Aeronautics and Astronautics [Google Scholar]
- 21.McGuire S, Miles RB. 2014. Collision induced ultraviolet structure in nitrogen radar REMPI spectra. J. Chem. Phys. 141, 244301 ( 10.1063/1.4904261) [DOI] [PubMed] [Google Scholar]
- 22.Dogariu A, Miles RB. 2011. Detecting localized trace species using radar REMPI. Appl. Opt 50, 68 ( 10.1364/AO.50.000A68) [DOI] [PubMed] [Google Scholar]
- 23.Shneider MN, Miles RB. 2012. Laser induced avalanche ionization in gases or gas mixtures with resonantly enhanced multiphoton ionization or femtosecond laser pulse pre-ionization. Phys. Plasmas 19, 083508 [Google Scholar]
- 24.Michael JB, Edwards MR, Dogariu A, Miles RB. 2011. Femtosecond laser electronic excitation tagging for quantitative velocity imaging in air. Appl. Opt. 50, 5158–5162. ( 10.1364/AO.50.005158) [DOI] [PubMed] [Google Scholar]
- 25.Edwards MR. 2012. Femtosecond laser electronic excitation tagging. Thesis, Princeton University, Princeton, NJ, USA.
- 26.Edwards M, Dogariu A, Miles R. 2015. Simultaneous temperature and velocity measurement in unseeded air flows with FLEET. AIAA J. 51, 053685 [Google Scholar]
- 27.DeLuca NJ, Miles RB, Kulatilaka WD, Jiang N, Gord JR. FLEET at 100 kHz for velocimetry and in high temperature and reacting flows. Submitted [Google Scholar]


