Abstract
The contrast sensitivity function (CSF), a measure of visual sensitivity to a wide range of spatial frequencies, has been widely used as the gain profile of the front-end filter of the visual system to predict how we perceive spatial patterns. However, the CSF itself is determined by the gain profile and other processing inefficiencies of the visual system; it may be problematic to use the CSF as the gain profile in observer models. Here, we applied the external noise paradigm and the perceptual template model (PTM) to characterize several major properties of the visual system. With the external noise normalized gain profile, nonlinearity, and internal additive and multiplicative noises, the PTM accounted for 92.8% of the variance in the experiment data measured in a wide range of conditions and revealed the major processing components that determine the CSF. Unlike the CSF, the external noise normalized gain profile of the visual system is relatively flat across a wide range of spatial frequencies. The results may have major implications for understanding normal and abnormal spatial vision.
Keywords: contrast sensitivity function, gain, spatial vision, spatial frequency, channel, noise, perceptual template model
Introduction
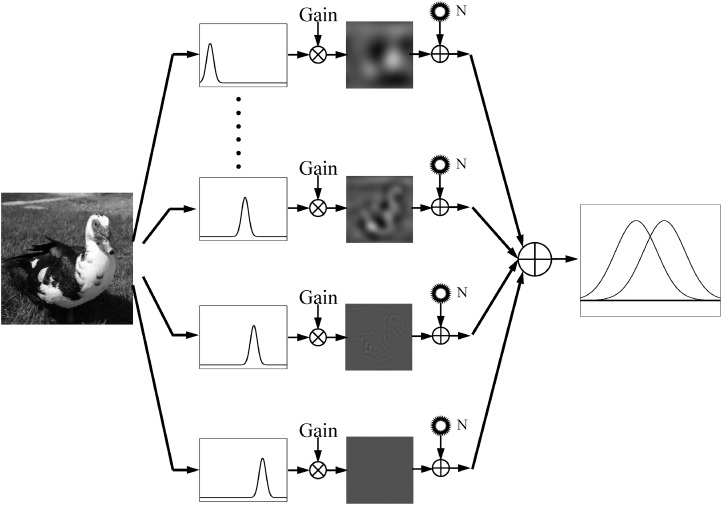
Ever since the discovery that the visual system consists of channels tuned to stimulus properties such as orientation and spatial frequency, multichannel models have been developed to predict human performance in visual perception (De Valois & De Valois, 1990; Graham, 2001), including pattern detection (Watson, 1983, 2000; Watson & Ahumada, 2005), pattern identification (Petrov, Dosher, & Lu, 2005), pattern masking (Legge & Foley, 1980; Watson & Solomon, 1997), letter identification (Chung, Legge, & Tjan, 2002; Chung & Tjan, 2009; Watson & Ahumada, 2008), and face recognition (Kwon & Legge, 2011). In most of these multichannel linear amplifier models (Pelli, 1981), input images are first processed by a bank of spatial frequency channels with the gain of each channel equal to the observer's contrast sensitivity at the channel's center spatial frequency. Then additive internal noise with equal variance is added to the output of each channel before task-relevant decision (Figure 1).
Figure 1.
A multichannel linear amplifier model for spatial vision. The input image is analyzed by a bank of spatial frequency channels with their gains equal to the contrast sensitivities of the observer. A constant internal additive noise is added to the output of each channel before task-relevant decision.
Although these multichannel linear amplifier models (LAM) have provided good accounts of human performance in many tasks, there are three potential issues. First, equating the gain profile of the channels to the CSF of the observer may be problematic. The CSF measures the reciprocal of contrast threshold as a function of the spatial frequency of narrow-band stimuli. It is determined by the gain, nonlinearity, and internal noises in each of the spatial frequency channels (Lu & Dosher, 1998, 2008, 2014; Pelli & Farell, 1999) and may not be equal to the overall gain profile of the visual system if there is nonlinearity in the system and/or the magnitude of internal noise varies with spatial frequency. Indeed, it has been shown that, in high contrast conditions, the perceived contrast of gratings with equal physical contrast does not depend on their spatial frequencies, suggesting that the gain of the visual system is more or less the same across spatial frequencies (Banks, Geisler, & Bennett, 1987; Georgeson & Sullivan, 1975). Many studies have found that the shape of the CSF strongly depends on the magnitude of the external noise superimposed on the grating stimuli, indicating that the CSF may not be a simple function of the gain of the visual system (McAnany & Alexander, 2010; Oruc & Landy, 2009; Rovamo, Franssila, & Nasanen, 1992; Tjan, Chung, & Legge, 2002; Xu, Lu, Qiu, & Zhou, 2006). Second, the properties of the additive internal noise have not been fully tested and specified in the multichannel LAM. In some models, the additive noise is assumed to have the same amplitude across all spatial frequency channels (Chung et al., 2002; Rovamo, Luntinen, & Nasanen, 1993; Watson & Ahumada, 2008). However, many studies have found that the level of additive noise varied across spatial frequencies (Chen et al., 2014; Xu et al., 2006). Both Ahumada and Watson (1985) and Kwon and Legge (2011) showed that the multichannel LAM is mathematically equivalent to another model that has a flat gain profile but spatial-frequency dependent additive internal noise. Finally, there are also many known nonlinearities in the visual system, including nonlinear transducer function and/or multiplicative noise (Burgess & Colborne, 1988; Eckstein, Ahumada, & Watson, 1997; Lu & Dosher, 1998, 2008, 2014; Pelli, 1985), that have not been incorporated into the multichannel LAM. Without fully specifying the gain, nonlinearity, and internal noises, the multichannel model may account for human behavior at one performance level but not in more extended conditions that include a wide range of stimulus contrasts, external noises, and performance levels (Lu & Dosher, 2008, 2014; Watson & Ahumada, 2005).
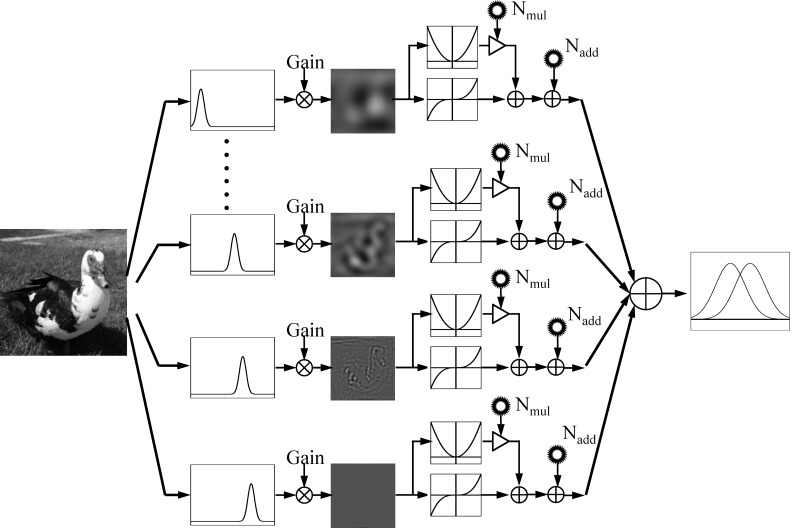
In the current study, we applied the external noise method and the perceptual template model (PTM) (Lu & Dosher, 1998, 2008, 2014) to fully constrain the external noise normalized gain, nonlinearity, and internal additive and multiplicative noises of each channel in a multichannel observer model for spatial vision. As shown in Figure 2, in this model, the input images are processed by a bank of spatial frequency channels, each of which consists of a perceptual template, a nonlinear transducer, and additive and multiplicative noises, and the outputs of all the channels are combined in task relevant decision. Instead of using the CSF as the gain profile of visual system, the PTM specifies the gain of the visual system as the external noise normalized gain, defined as the output of the perceptual template to the signal stimulus relative to its output to external noise. Full contrast psychometric functions were measured with a 10-letter identification task in four or five spatial frequency and two external noise conditions (zero and high). We then applied the PTM to extract the external noise normalized gain, nonlinear transducer function, and internal additive and multiplicative noises in all spatial frequency conditions. The result is a multichannel PTM of spatial vision that can account for human behavior in a wide range of stimulus conditions and performance levels.
Figure 2.
The multichannel PTM. The input images are analyzed by a bank of spatial frequency channels. The output of each channel is modulated by its external noise normalized gain and goes through a nonlinear transducer. Multiplicative noise and additive noises are added before task-relevant decision.
Method
Observers
The first author (S1) and four other observers (S2–S5), aged 23 to 37 years, participated in the study. All had normal or corrected-to-normal vision. All observers except S1 were naïve to the purpose of the study. The study was approved by the institutional review board of human subjects research of the Ohio State University. Written informed consent was obtained before the experiment.
Apparatus
All programs used in this study were written in Matlab (The Mathworks Corp., Natick, MA) with Psychtoolbox 3 (Kleiner, Brainard, & Pelli, 2007) and run on a PC computer. Stimuli were displayed on a gamma-corrected Apple Studio Display 17-in. CRT monitor with a mean luminance of 30 cd/m2, 1024 × 768 pixel resolution, and a vertical refresh rate of 85 Hz. The native bit depth of the CRT is 8 bit per RGB channel. A special circuit was used to combine the R and B channels of the computer graphics card to achieve 14-bit grayscale resolution (Li & Lu, 2012; Li, Lu, Xu, Jin, & Zhou, 2003). Observers viewed the stimuli binocularly at a distance of 1.7 m, at which each pixel on the display subtended 0.0104° × 0.0104°. The CRT monitor was the only lighting source in the room. The background luminance was presented on the monitor throughout the experiment.
Stimuli
The 10 Sloan letters, C, D, H, K, N, O, R, S, V, and Z (Pelli, Robson, & Wilkins, 1988), were used as stimuli. Filtered letters were generated by centering each 256 × 256 pixel white (RGB value 255) letter in a 512 × 512 pixel black (RGB value 0) background and filtering the image with a raised cosine filter (Chung et al., 2002):
 |
where f denotes radial spatial frequency, f0 = 3 cycles per object is the center frequency of the filter, and fcut-off was chosen such that the full bandwidth at half height was 1 octave. The pixel intensity of each filtered image was normalized by the maximum absolute intensity of the image such that, after normalization, the maximum absolute Michelson contrast of the image is 1.0. Stimuli with different contrasts were obtained by scaling the intensities of the normalized images and then adding the background luminance. To create letter stimuli with different spatial frequencies, the filtered image were then resized to 6°, 3°, 1.5°, 0.75°, and 0.375° to obtain letters at 1, 2, 4, 8 and 16 cycles/° (c/°), respectively.
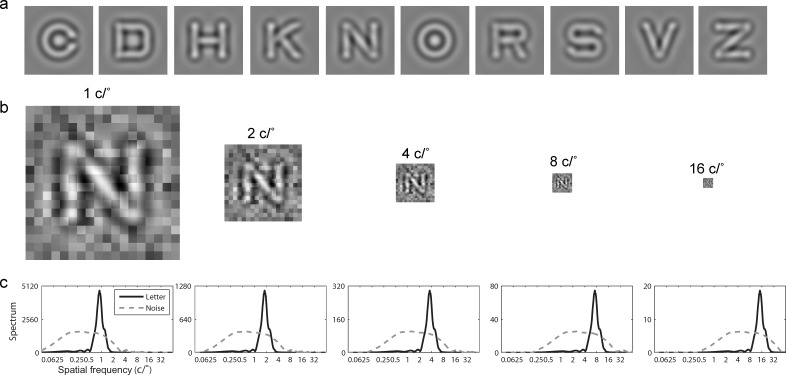
The size of the external noise images was identical to that of the letter image. The size of the noise elements was scaled with the letter size to maintain 18 × 18 noise elements per image so that the spectra of the letters and the external noise maintained a constant relationship across different spatial frequency conditions (Figure 3). The Michelson contrast of each noise element of every external noise image was independently sampled from a Gaussian distribution with mean zero and a standard deviation of zero and 0.2 in the zero and high external noise conditions, respectively. Background luminance was added to all external noise images.
Figure 3.
(a) Ten filtered letters. (b) Illustration of noise masked letter N in different spatial frequency conditions. (c) The average magnitude spectra of letters and external noise in different spatial frequency conditions.
The stimuli in each trial consisted of one letter frame and four external noise frames. These five image frames were presented in a temporal order: noise, noise, letter, noise, noise. Each of these frames lasted for three CRT refreshes (at a rate of 85 Hz) or 35.3 ms.
Design and procedure
Observers were tested in a letter identification task in four (S3–S5) or five (S1 and S2) spatial frequency and two external noise conditions using the method of constant stimuli. The psychometric function in each condition was sampled at seven signal contrast levels predetermined for each observer based on pilot tests. Each daily session consisted of 1,400 trials and measured psychometric functions in one spatial frequency and two external noise conditions. Within a session, trials in different letter contrast and external noise conditions were mixed randomly. S1 and S2 ran five sessions (1, 2, 4, 8, and 16 c/°). S3, S4, and S5 ran four sessions (1, 2, 4, and 8 c/°). The order of test was randomized across observers.
Each trial began with the presentation of a 259-ms crosshairs, followed by a 129-ms blank screen, and 177-ms stimulus presentation. A response screen with all 10 letters was shown 500 ms after stimulus presentation.1 The letters presented on the response screen matched the average RMS contrast of the test letters. Observers were instructed to use the keyboard to type or mouse to select the letter they saw. No feedback was provided. A new trial started 500 ms after the response.
Model
A stochastic perceptual template model (Dosher & Lu, 2000) was developed to account for human performance in the experimental task. The model can take the actual images used in the experiment as its input and generates behavioral responses.
The letter stimuli and external noise images used in our experiment are described by cLLi,k(x, y) and cNNm,k(x, y), where x and y are the spatial coordinates in the display, cL and cN represent the contrasts of the letter and external noise images, Li,k(x, y) represents the ith (i = 1, 2, …10) letter at 100% contrast in the kth (k = 1, 2, 3, 4, 5 for S1 and S2, and k = 1, 2, 3, 4 for S3–S5) spatial frequency condition, and Nm,k(x, y) represents the external noise sample generated from the standard normal distribution (with standard deviation = 1.0) in the mth (m = 1, 2, 3, and 4) frame.
In constructing the stochastic PTM, we assume that the imperfect human template can be modeled as a perfect template with a lower efficiency, that is, the template Ti,k(x, y) for letter i in the kth spatial frequency condition has a similar shape as the letter stimulus but with lower efficiency αk, i.e., Ti,k(x, y) = αkLi,k(x, y). The assumption is necessary for us to model the overlap between different letter templates and the correlations between the outputs of the templates.
In each trial, four external noise images, cNNm,k(x, y) (m = 1, 2, 3, and 4), are processed by the 10 letter templates. The output of the jth template to the external noise images can be expressed as:
 |
We first normalize the template gains to the external noise images so that after template matching, the expected average total energy (over 10 templates) of four frames of external noise images (with contrast = 1.0) is 1.0:
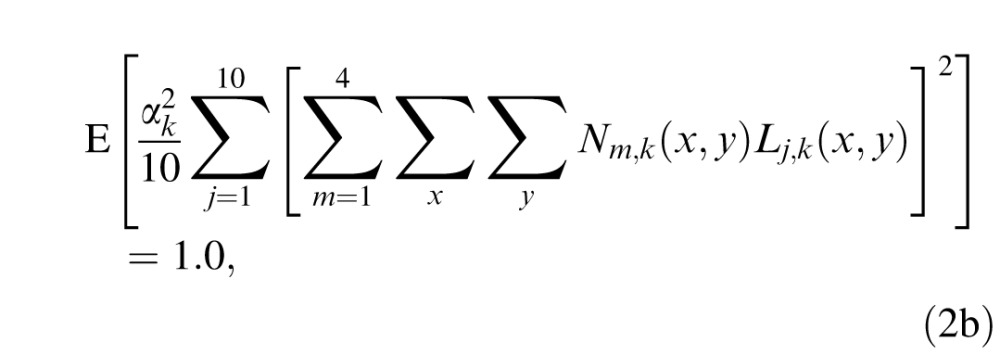 |
where E() is the expected value operator. This allows us to compare the impact of external noise in different spatial frequency conditions and obtain:
 |
Because human performance is determined by the relative efficiency of the templates in processing letters and external noise images (Lu & Dosher, 1998, 2008), without losing generality, we define the external noise normalized gain βk of the perceptual templates to the letters as the coefficient relative to their gain to external noise. So the letter stimulus cLLi,k(x, y) in the kth spatial frequency condition is processed by 10 letter templates with an external noise normalized gain of βk. The output of the jth template Tj,k(x, y) can be expressed as:
 |
Summing its outputs to both the letter and external noise stimuli, the output of the jth template is therefore:
 |
The output of each template goes through a nonlinear transducer function, which raises its input to γk power while keeping the sign of the input,
 |
Next, internal multiplicative noise, with its standard deviation proportional to the amplitude of Uij,k, and internal additive noise, are added to the output of the transducer:
 |
where Nmul,k is the proportional constant for multiplicative noise, Nadd,k is the standard deviation of the additive noise in the kth spatial frequency condition, and G(0,1) is a Gaussian random variable with mean of zero and standard deviation of one.
Finally, the outputs of all 10 templates are submitted to a decision process. The model responds with the letter associated with the template that has the maximum response:
 |
The response is correct if Ri,k = i.
In each spatial frequency condition, the stochastic PTM has four parameters, βk, γk, Nmul,k, and Nadd,k . If we set Nmul,k to zero and γk to one, the PTM reduces to the LAM (Legge, Kersten, & Burgess, 1987; Pelli & Farell, 1999).
Model fit and comparison
The stochastic PTM was implemented in MATLAB. Its performance was simulated with the exact letter images used in the experiment for each observer and external noise images generated with the same procedure used in our experiment.2 For each set of PTM parameters, we generated model predictions of all the experimental conditions (70 for S1 and S2; 56 for S3, S4, and S5) based on 10,000 simulated trials in each condition.
A maximum likelihood procedure (Watson, 1979) was used to search for the best fitting parameters, with the likelihood defined as:
 |
where i indexes experiment conditions, Ni and Ki are the numbers of total and correct trials, respectively, and Pi is percent correct predicted by the model.
A χ2 test was used to compare nested models (Watson, 1979):
 |
where df = kfull − kreduced, and the ks are the numbers of parameters in the full and reduced models.
Results
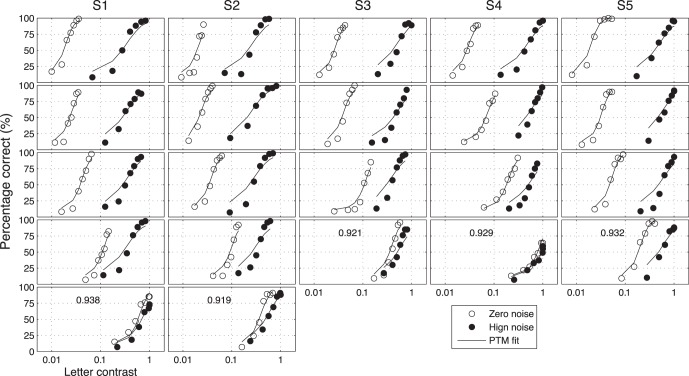
A total of 10 (5 Spatial Frequencies × 2 External Noises) psychometric functions were obtained for each of S1 and S2, and eight were obtained for each of S3, S4, and S5 (Figure 4). We modeled the psychometric functions with the stochastic PTM. For each observer, PTM parameters, including internal additive noise Nadd,k, internal multiplicative noise Nmul,k, external noise normalized gain βk, and nonlinearity γk, were estimated from the best fitting model for the data in each spatial frequency condition.
Figure 4.
Psychometric functions for the five observers (columns) in different spatial frequency conditions (rows: low to high). Open and filled circles represent data in the zero and high external noise conditions. Solid curves are the predictions of the best fitting PTM. r2 of the best fitting PTM are noted for each observer.
Two versions of the PTM models were used to fit all psychometric functions obtained for each observer. The full PTM has independent sets of Nadd,k, Nmul,k, βk, and γk in different spatial frequency conditions, and therefore 20 parameters for S1 and S2, and 16 parameters for S3, S4, and S5. Many studies in the literatures suggest that the nonlinearities of the visual system, Nmul,k and γk, may be invariant across spatial frequencies (Chen et al., 2014; Hou et al., 2010; Lu & Dosher, 1998, 2008, 2014). So we constructed a reduced PTM, in which both Nmul,k and γk are the same across all the spatial frequency conditions. This model has 12 parameters for S1 and S2, and 10 parameters for S3, S4, and S5.
Both the full and reduced PTM provided excellent fits to the psychometric functions. The average r2 of the full and reduced PTM was 0.929 ± 0.009 (mean ± SD) and 0.928 ± 0.009, respectively. A χ2 test showed no significant difference between the full and reduced models (p > 0.05 for all observers). Results of individual observers are listed in Table 1.
Table 1.
Goodness of fit of the full PTM, reduced PTM, and LAM
| Observer |
S1 |
S2 |
S3 |
S4 |
S5 |
|
| r2 | full PTM | 0.942 | 0.918 | 0.922 | 0.931 | 0.933 |
| reduced PTM | 0.938 | 0.919 | 0.921 | 0.929 | 0.932 | |
| LAM | 0.814 | 0.781 | 0.755 | 0.843 | 0.790 | |
| −log(likelihood) | full PTM | 271 | 335 | 252 | 210 | 235 |
| reduced PTM | 278 | 336 | 253 | 211 | 236 | |
| LAM | 488 | 604 | 492 | 302 | 468 | |
| χ2 test | reduced vs. full PTM | χ2 (8) = 14.1 | χ2 (8) = 1.55 | χ2 (6) = 0.294 | χ2 (6) = 2.20 | χ2 (6) = 3.00 |
| p = 0.077 | p = 0.992 | p > 0.999 | p = 0.900 | p = 0.809 | ||
| LAM vs. reduced PTM | χ2 (2) = 419 | χ2 (2) = 535 | χ2 (2) = 479 | χ2 (2) = 182 | χ2 (2) = 464 | |
| p < 0.001 | p < 0.001 | p < 0.001 | p < 0.001 | p < 0.001 | ||
We also fit the LAM to the data. The average r2 was 0.797 ± 0.033. Because the LAM is a reduced version of the PTM with Nmul,k = 0 and γk = 1, a χ2 test was used to compare the fits of the LAM and the reduced PTM. The results showed that the reduced PTM was superior to the LAM in accounting for the variance of our data (p < 0.001 for all observers; Table 1).
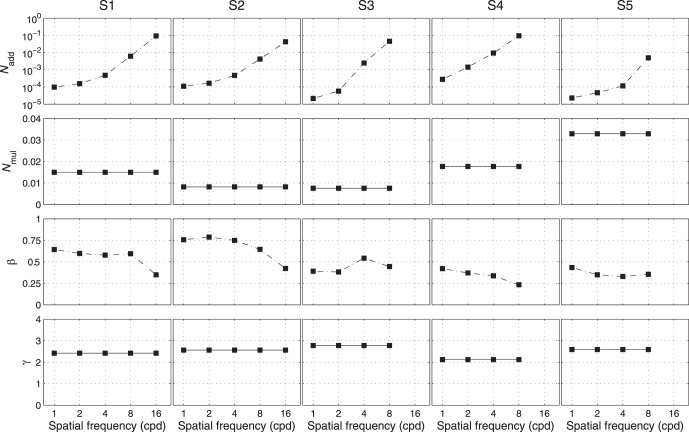
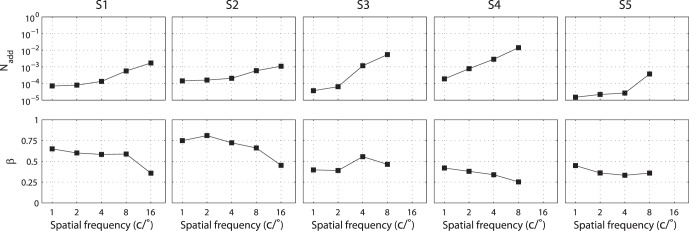
The parameters of the best fitting PTM are plotted as functions of spatial frequency in Figure 5.3 Averaged across observers, Nadd,k increased dramatically, from 1.06 × 10⁻⁴ at 1 c/° to 3.10 × 10⁻² at 8 c/°, whereas βk decreased only by about 14.2% (from 0.529 at 1 c/° to 0.454 at 8 c/°). Averaged across observers, Nmul,k and γk were 0.016 ± 0.010 and 2.49 ± 0.24, respectively. The estimated γk is within the 2.11 to 3.04 range found in pattern masking (Legge & Foley, 1980) and comparable to the 2.05 to 2.45 range found in external noise experiments (Lu & Dosher, 2008).
Figure 5.
Parameters of the best fitting reduced PTM of the five observers, plotted as functions of spatial frequency.
Contrast thresholds at 55% percent correct were extracted from the best fitting PTM and plotted in Figure 6. The CSF in the zero external noise condition showed a typical low-pass profile. A dramatic loss of sensitivity was induced by adding external noise. The CSFs in the high external noise condition are quite flat. The result is consistent with previous findings that CSF in high external noise doesn't vary with spatial frequency (McAnany & Alexander, 2010; Oruc & Landy, 2009; Rovamo et al., 1992; Tjan et al., 2002; Xu et al., 2006).
Figure 6.

CSFs at 55% percent correct. Empty and solid circles denote data from zero and high external noise conditions, respectively.
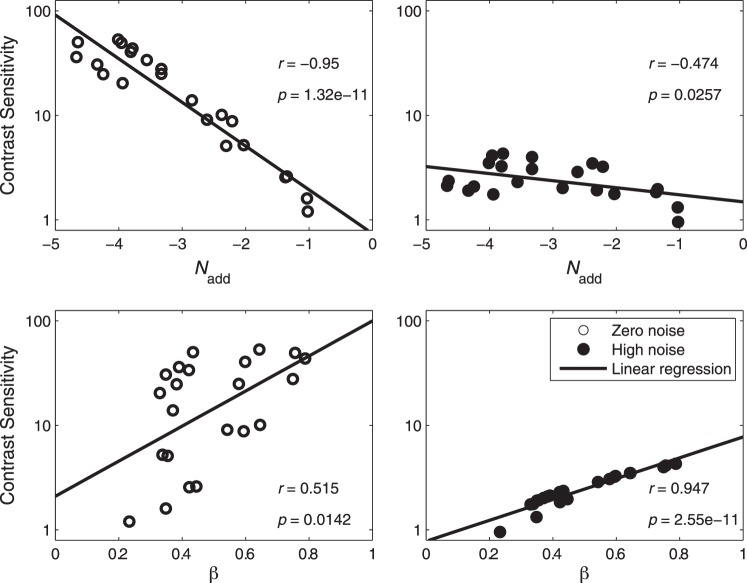
It is worth noting that, the shape of the CSF in the zero external noise condition is very similar to the inverted Nadd,k curve and the shape of the CSF in the high external noise condition is similar to the gain profile of visual channels (βk). We calculated the correlations between the CSFs and PTM parameters, and plotted them in Figure 7. Internal additive noise Nadd,k correlated negatively with CSFs in both the zero (r = −0.950, p < 0.001) and high (r = −0.474, p = 0.026) external noise conditions, with better correlation in the zero than high external noise condition (Steiger's Z-test, Meng, Rosenthal, & Rubin, 1992, p < 0.001). There were significant positive correlations between the external noise normalized gain βk and CSFs in both the zero (r = 0.515, p = 0.014) and high external noise conditions (r = 0.947, p < 0.001), with better correlation in the high than zero external noise condition (Steiger's Z-test, p < 0.001). The result suggested that the CSF in the zero noise condition was mainly determined by Nadd,k while the CSF in the high external noise condition was mainly determined by βk.
Figure 7.
Correlations between the CSFs and PTM parameters. Data from all observers were pooled together.
Discussion
Using a letter identification task, we measured full contrast psychometric functions in zero and high external noise conditions over a wide range of spatial frequency conditions. The comprehensive dataset in combination with the stochastic PTM allowed us to fully characterize the properties of each spatial frequency channel: external noise normalized gain, nonlinear transducer, additive and multiplicative noises (Lu & Dosher, 1998, 2008, 2014). The result is a fully specified multichannel PTM for spatial vision (Figure 2).4
We did not investigate channel interactions because our stimuli were designed to target individual spatial frequency channels. However, interactions between spatial frequency channels have been reported in many studies (Albrecht & De Valois, 1981; Bauman & Bonds, 1991; De Valois & Tootell, 1983; Georgeson, 1980; Greenlee & Magnussen, 1988; Klein, Stromeyer, & Ganz, 1974; Movshon, Thompson, & Tolhurst, 1978; Tolhurst, 1972; Tolhurst & Barfield, 1978). Future studies with more complex stimuli are necessary to specify channel interactions.
Because the nonlinear transducer and multiplicative noise did not vary with spatial frequency, the shapes of the CSF in the zero and high external noise conditions were mostly determined by the profile of internal additive noise and external noise normalized gain, respectively. However, as shown by the model comparison results between the PTM and LAM, the nonlinear transducer and multiplicative noise played essential roles in accounting for the experiment data. In fact, they determine the slope of the psychometric functions, and are important in modeling CSFs at multiple performance levels (Chen et al., 2014; Lu & Dosher, 1998, 2008, 2014). Without specifications of the nonlinearities and internal noises of the visual system, previous spatial vision models can only account for human performance in a limited range of performance levels (Chung et al., 2002; Rovamo et al., 1993; Watson & Ahumada, 2008). In contrast, the multichannel PTM can be used to account for human behavior over a wide range of stimulus conditions and performance levels.
Using filtered letters with a fixed object frequency bandwidth, we found that the external noise normalized gain is relatively flat over a range of spatial frequencies with a slight drop at the highest spatial frequency. Our finding is consistent with the finding by Parish and Sperling that the signal to noise ratio for band-limited letters is independent of viewing distance (Parish & Sperling, 1991). Majaj, Pelli, Kurshan, and Palomares (2002) found that for band-limited (filtered) letters with different sizes, the frequency of the channel used for identification scales proportionally with the letter's center frequency. They also found that, for letters with sharp edges, channel frequency scales less proportionally with the letter's stroke frequency. The results provide a potential explanation of Pelli, Burns, Farell, and Moore-Page (2006)'s finding that the efficiency for (sharp-edged) letter identification is highest for small letters and gradually decreases as letter size increases. We attribute the difference between Pelli et al. (2006)'s finding and ours to the differences of stimulus properties. It would be interesting to apply the PTM analysis to measure external noise normalized gain profile for broadband letters in the future.
In the PTM, the external noise normalized gain of each spatial frequency channel is specified relative to its gain to external noise (Lu & Dosher, 1998, 2008, 2014). The advantage of this definition is that all the variables in the model are referenced to external noise, which can be specified physically, and the model can be used to predict human performance based on specification of the input stimuli in physical units, as implemented in the stochastic PTM. However, it must be noted that the external noise normalized gain profile derived in this paper is different from other direct measures of the gain of the visual system, i.e., optical or neural modulation transfer function. The optical modulation transfer function (MTF) of the eye describes the quality of retinal images (Artal, 1990; Artal & Navarro, 1994; Campbell & Green, 1965; Campbell & Gubisch, 1966; Thibos, Hong, Bradley, & Cheng, 2002; Watson, 2013; Williams, Brainard, McMahon, & Navarro, 1994). The resolution of the visual system is much lower than the limit set by the optics of the eye (Applegate, 2000; Schwiegerling, 2000). Rovamo et al. (1993) proposed a neural MTF whose gain profile is proportional to spatial frequency to account for the additional loss in perception. Watson and Ahumada (2008) derived the neural MTF by dividing the CSF by the optical MTF. However, there has been no direct measure of the neural MTF. In fact, even if the optical and neural MTF are specified, we still can't directly use them to predict human performance without additional specifications of the nonlinearities and internal noises of the visual system (Chung et al., 2002; Lu & Dosher, 2014; Rovamo et al., 1993; Watson & Ahumada, 2008).
In the current study, we did not measure the optical MTF of our observers. In order to explore how much the optical MTF could affect our results, we considered a typical optical MTF for fovea detection (Navarro, Williams, & Artal, 1993):
 |
where f is the radial spatial frequency in c/°, A = 0.172, B = 0.037, and C = 0.22.
To incorporate the optical MTF into the stochastic PTM, we first filtered the letter and external noise images with the MTF:
 |
 |
where
 and
and
 represent Fourier and inverse Fourier transformations, and * indicates the results of applying the optical MTF. We then replaced Li,j(x,y) and Nm,k(x,y) in Equation 2 with these filtered stimuli
 (x,y) and
 (x,y) and refitted the reduced stochastic PTM to the data.
The reduced PTM provided excellent fits to the empirical psychometric functions. The average r2 of the reduced PTM was 0.927 ± 0.010.
 and
and
 of the best fitting reduced stochastic PTM are shown in Figure 8. The MTF changed the profile of internal additive noise. There was still a significant negative correlation between
 and the CSF in the zero external noise condition (r = −0.862, p < 0.001), but only a marginal correlation between
 and the CSF in the high external noise condition (r = −0.400, p = 0.065).
Figure 8.
 and
and
 of the best fitting reduced PTM.
Importantly, the MTF had only a very small effect on external noise normalized gain.
 and βk are essentially the same (r = 0.997, p < 0.001, the slope of the linear regression between
 and βk was 0.975). This is because the optical MTF attenuated the letters and external noise images with essentially the same factors: It attenuated the outputs of the templates to the letters by a factor of 0.877, 0.772, 0.605, 0.388, and 0.191 in the 1, 2, 4, 8, and 16 c/° spatial frequency conditions, and their outputs to the external noise stimuli by 0.880, 0.774, 0.608, 0.393, and 0.197, respectively. There were significant positive correlations between template gain
 and CSF in both the zero (r = 0.499, p = 0.018) and high external noise (r = 0.940, p < 0.001) conditions, with better correlation in the high than zero external noise condition (Steiger's Z-test, p < 0.001). So with consideration of the optical MTF, the conclusion still holds that the CSF in zero and high noise conditions is mostly determined by internal additive noise and the external noise normalized gain, respectively.
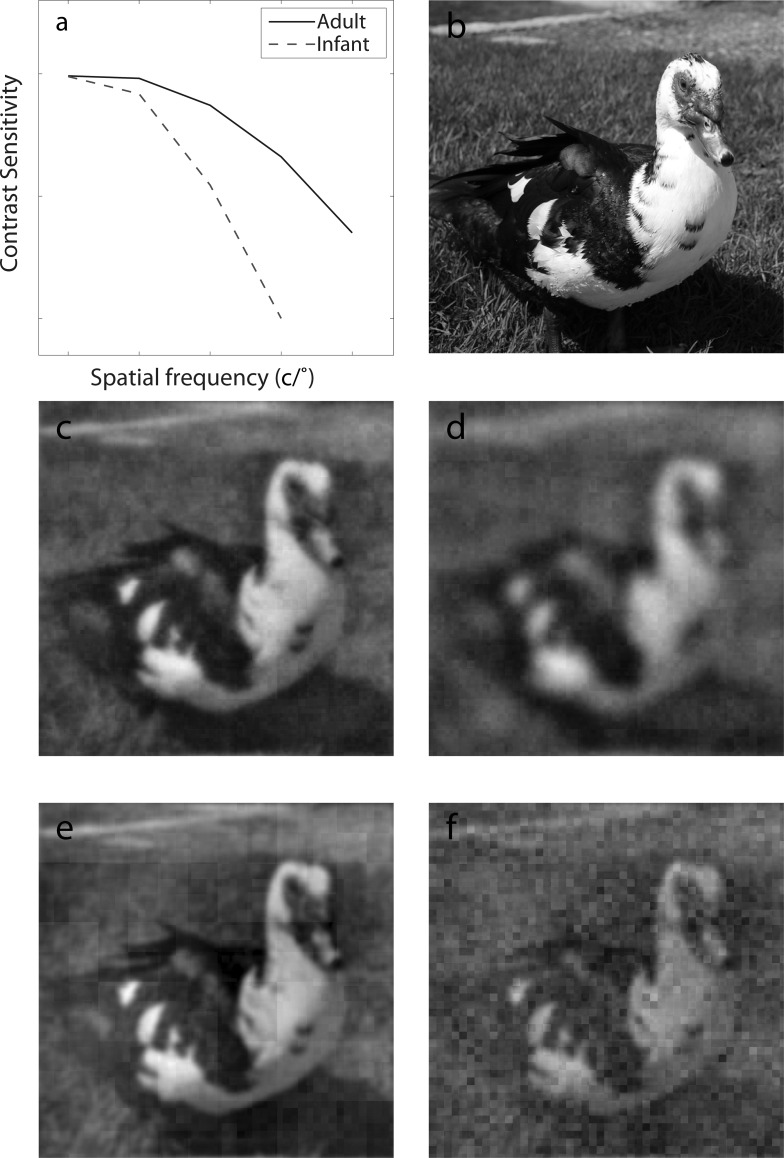
The multichannel LAM has been used to generate predictions of what people perceive in spatial vision. A typical example is illustrated in Figure 9, in which the CSFs of a normal adult and an infant (Figure 9a) are used as the gain profiles to generate predictions of their perception of a duck—the infant is postulated to perceive a blurrier image (Figure 9d) because of the stronger reduction of contrast sensitivity in high spatial frequencies compared to a normal adult (Figure 9c). The multichannel PTM postulates that, spatial vision is not limited only by attenuation of high spatial frequency information, but also by both increased additive internal noise and decreased gain at high spatial frequencies (Figure 9e). What can an infant with a poor CSF see compared to an adult? She may not necessarily perceive a blurry image. If her gain profile was relatively flat as we showed in adults, the infant would perceive a noisier image (Figure 9f). Adopting the approach developed in this paper to infant vision would allow us to test this prediction.
Figure 9.
Demos of the multichannel LAM and PTM in spatial vision. In the multichannel LAM, an input image (b) is filtered by the CSFs (a) of a normal adult (solid curve) and an infant (dashed curve) to obtain predictions of what is seen by a normal adult (c) and an infant (d). In the multichannel PTM, an input image (b) is analyzed by a bank of spatial frequency channels; the output of each channel is modulated by its external noise normalized gain and goes through a nonlinear transducer with exponential γ; multiplicative noise and additive noises are added. What would be seen by a normal adult and an infant are shown in (e) and (f).
The CSF, which measures how visual sensitivity varies as a function of stimulus spatial frequency, provides a comprehensive evaluation of many spatial vision deficits (Ginsburg, 1981, 2003; Hess, 1981). For example, patients might have poor vision despite normal or near to normal visual acuity (Wilensky & Hawkins, 2001), whereas amblyopes who are deemed “treated” based on the criterion of remediated visual acuity still showed lowered contrast sensitivity at high spatial frequencies (Huang, Tao, Zhou, & Lu, 2007). The method developed in this paper would allow us to decompose the CSF into different components and therefore reveal underlying mechanisms of various visual deficits.
Acknowledgments
We thank Dr. Bosco Tjan, the editor and two anonymous reviewers for their insightful and constructive comments. We also thank Dr. Luis Lesmes for his help in constructing letter images, and Dr. Woojae Kim for his help with the fitting procedure of the stochastic PTM. This work was supported by the US National Eye Institute (grant EY021553 to ZL), the National Natural Science Foundation of China (NSFC31230032 to CBH), the Knowledge Innovation Program of the Chinese Academy of Sciences (Y3CX102003 to CBH), and Institute of Psychology, Chinese Academy of Sciences (Y1CX201006 to CBH).
Commercial relationships: none.
Corresponding author: Zhong-Lin Lu.
E-mail: lu.535@osu.edu.
Address: Department of Psychology, The Ohio State University, Columbus, OH.
Footnotes
The 500-ms interval was long enough to eliminate potential backward masking effect of the response screen (Breitmeyer, 1984; Lu, Jeon, & Dosher, 2004).
We fit the model in two different ways. We first used the actual letter and external noise images in the experiment, with 400 external noise images (100 Trials × 4 Images per Trial) per condition. The stochastic PTM gave a good fit (average r2 = 0.921 ± 0.015). Because 100 samples of external images is too few to represent the overall statistical property of the external noise, we then used 40,000 (10,000 Trials × 4 Images per Trial) regenerated external noise image samples per condition to obtain more stable performance of the model. The procedure gave us more generalizable estimates of the model parameters.
Per one reviewer's request, we investigated potential trade-offs between Nmul and γ in the curve-fitting procedure. We found that the cost function, −log(likelihood), varies with Nmul and γ almost independently, with very little trade-offs between them.
Contributor Information
Fang Hou, Email: hou.130@osu.edu.
Zhong-Lin Lu, Email: lu.535@osu.edu.
Chang-Bing Huang, Email: huangcb@psych.ac.cn.
References
- Ahumada A. J. Jr., Watson A. B. (1985). Equivalent-noise model for contrast detection and discrimination. Journal of the Optical Society of America A , 2 (7), 1133–1139. [DOI] [PubMed] [Google Scholar]
- Albrecht D. G., De Valois R. L. (1981). Striate cortex responses to periodic patterns with and without the fundamental harmonics. The Journal of Physiology , 319, 497–514. [DOI] [PMC free article] [PubMed] [Google Scholar]
- Applegate R. A. (2000). Limits to vision: Can we do better than nature? Journal of Refractive Surgery , 16 (5), S547–S551. [DOI] [PubMed] [Google Scholar]
- Artal P. (1990). Calculations of two-dimensional foveal retinal images in real eyes. Journal of the Optical Society of America A , 7 (8), 1374–1381. [DOI] [PubMed] [Google Scholar]
- Artal P., Navarro R. (1994). Monochromatic modulation transfer function of the human eye for different pupil diameters: An analytical expression. Journal of the Optical Society of America A , 11 (1), 246–249. [DOI] [PubMed] [Google Scholar]
- Banks M. S., Geisler W. S., Bennett P. J. (1987). The physical limits of grating visibility. Vision Research , 27 (11), 1915–1924. [DOI] [PubMed] [Google Scholar]
- Bauman L. A., Bonds A. B. (1991). Inhibitory refinement of spatial frequency selectivity in single cells of the cat striate cortex. Vision Research , 31 (6), 933–944. [DOI] [PubMed] [Google Scholar]
- Breitmeyer B. G. (1984). Visual masking: An integrative approach. New York: Oxford University Press. [Google Scholar]
- Burgess A. E., Colborne B. (1988). Visual signal detection. IV. Observer inconsistency. Journal of the Optical Society of America A , 5 (4), 617–627. [DOI] [PubMed] [Google Scholar]
- Campbell F. W., Green D. G. (1965). Optical and retinal factors affecting visual resolution. The Journal of Physiology , 181 (3), 576–593. [DOI] [PMC free article] [PubMed] [Google Scholar]
- Campbell F. W., Gubisch R. W. (1966). Optical quality of the human eye. The Journal of Physiology , 186 (3), 558–578. [DOI] [PMC free article] [PubMed] [Google Scholar]
- Chen G., Hou F., Yan F. F., Zhang P., Xi J., Zhou Y., Huang C. B. (2014). Noise provides new insights on contrast sensitivity function. PLoS One , 9 (3), e90579. [DOI] [PMC free article] [PubMed] [Google Scholar]
- Chung S. T., Legge G. E., Tjan B. S. (2002). Spatial-frequency characteristics of letter identification in central and peripheral vision. Vision Research , 42 (18), 2137–2152. [DOI] [PubMed] [Google Scholar]
- Chung S. T. L., Tjan B. S. (2009). Spatial-frequency and contrast properties of reading in central and peripheral vision. Journal of Vision , 9 (9): 9 1–19, http://www.journalofvision.org/content/9/9/16, doi:10.1167/9.9.16. [PubMed] [Article] [DOI] [PMC free article] [PubMed] [Google Scholar]
- Dao D. Y., Lu Z. L., Dosher B. A. (2006). Adaptation to sine-wave gratings selectively reduces the contrast gain of the adapted stimuli. Journal of Vision , 6 (7): 9 739–759, http://www.journalofvision.org/content/6/7/6, doi:10.1167/6.7.6. [PubMed] [Article] [DOI] [PubMed] [Google Scholar]
- De Valois K. K., Tootell R. B. (1983). Spatial-frequency-specific inhibition in cat striate cortex cells. The Journal of Physiology , 336, 359–376. [DOI] [PMC free article] [PubMed] [Google Scholar]
- De Valois R. L., De Valois K. K. (1990). Spatial vision. New York: Oxford University Press. [Google Scholar]
- Dosher B. A., Lu Z. L. (2000). Mechanisms of perceptual attention in precuing of location. Vision Research , 40 (10-12), 1269–1292. [DOI] [PubMed] [Google Scholar]
- Eckstein M. P., Ahumada A. J. Jr., Watson A. B. (1997). Visual signal detection in structured backgrounds. II. Effects of contrast gain control, background variations, and white noise. Journal of the Optical Society of America A , 14 (9), 2406–2419. [DOI] [PubMed] [Google Scholar]
- Georgeson M. A. (1980). The perceived spatial frequency, contrast, and orientation of illusory gratings. Perception , 9 (6), 695–712. [DOI] [PubMed] [Google Scholar]
- Georgeson M. A., Sullivan G. D. (1975). Contrast constancy: Deblurring in human vision by spatial frequency channels. The Journal of Physiology , 252 (3), 627–656. [DOI] [PMC free article] [PubMed] [Google Scholar]
- Ginsburg A. P. (1981). Spatial filtering and vision: Implications for normal and abnormal vision. In Proenz L., Enoch J., Jampolsky A. (Eds.), Clinical applications of visual psychophysics (pp 70–106). Cambridge, UK: Cambridge University Press. [Google Scholar]
- Ginsburg A. P. (2003). Contrast sensitivity and functional vision. International Ophthalmology Clinics , 43 (2), 5–15. [DOI] [PubMed] [Google Scholar]
- Graham N. (2001). Visual pattern analyzers. Oxford, UK: Oxford University Press. [Google Scholar]
- Greenlee M. W., Magnussen S. (1988). Interactions among spatial frequency and orientation channels adapted concurrently. Vision Research , 28 (12), 1303–1310. [DOI] [PubMed] [Google Scholar]
- Hess R. F. (1981). Application of contrast-sensitivity techniques to the study of functional amblyopia. In Proenz L., Enoch J., Jampolsky A. (Eds.), Clinical applications of visual psychophysics (pp 11–41). Cambridge, UK: Cambridge University Press. [Google Scholar]
- Hou F., Huang C. B., Lesmes L., Feng L. X., Tao L., Zhou Y. F., Lu Z. L. (2010). qCSF in clinical application: Efficient characterization and classification of contrast sensitivity functions in amblyopia. Investigative Ophthalmology & Visual Science , 51 (10), 5365–5377, http://www.iovs.org/content/51/10/5365. [PubMed] [Article] [DOI] [PMC free article] [PubMed] [Google Scholar]
- Huang C., Tao L., Zhou Y., Lu Z. L. (2007). Treated amblyopes remain deficient in spatial vision: a contrast sensitivity and external noise study. Vision Research , 47 (1), 22–34. [DOI] [PubMed] [Google Scholar]
- Klein S., Stromeyer C. F. 3rd, Ganz L. (1974). The simultaneous spatial frequency shift: A dissociation between the detection and perception of gratings. Vision Research , 14 (12), 1421–1432. [DOI] [PubMed] [Google Scholar]
- Kleiner M., Brainard D., Pelli D. (2007). What's new in Psychtoolbox-3? Perception , 36, 14–14. [Google Scholar]
- Kwon M., Legge G. E. (2011). Spatial-frequency cutoff requirements for pattern recognition in central and peripheral vision. Vision Research , 51 (18), 1995–2007. [DOI] [PMC free article] [PubMed] [Google Scholar]
- Legge G. E., Foley J. M. (1980). Contrast masking in human vision. Journal of the Optical Society of America , 70 (12), 1458–1471. [DOI] [PubMed] [Google Scholar]
- Legge G. E., Kersten D., Burgess A. E. (1987). Contrast discrimination in noise. Journal of the Optical Society of America A , 4 (2), 391–404. [DOI] [PubMed] [Google Scholar]
- Li X., Lu Z. L. (2012). Enabling high grayscale resolution displays and accurate response time measurements on conventional computers. Journal of Visualized Experiments , 60. [DOI] [PMC free article] [PubMed] [Google Scholar]
- Li X., Lu Z. L., Xu P., Jin J., Zhou Y. (2003). Generating high gray-level resolution monochrome displays with conventional computer graphics cards and color monitors. Journal of Neuroscience Methods , 130 (1), 9–18. [DOI] [PubMed] [Google Scholar]
- Lu Z. L., Dosher B. A. (1998). External noise distinguishes attention mechanisms. Vision Research , 38 (9), 1183–1198. [DOI] [PubMed] [Google Scholar]
- Lu Z. L., Dosher B. A. (2008). Characterizing observers using external noise and observer models: Assessing internal representations with external noise. Psychological Review , 115 (1), 44–82. [DOI] [PubMed] [Google Scholar]
- Lu Z. L., Dosher B. A. (2014). Visual psychophysics: From laboratory to theory. Cambridge, MA: The MIT Press. [Google Scholar]
- Lu Z. L., Jeon S. T., Dosher B. A. (2004). Temporal tuning characteristics of the perceptual template and endogenous cuing of spatial attention. Vision Research , 44 (12), 1333–1350. [DOI] [PubMed] [Google Scholar]
- Majaj N. J., Pelli D. G., Kurshan P., Palomares M. (2002). The role of spatial frequency channels in letter identification. Vision Research , 42 (9), 1165–1184. [DOI] [PubMed] [Google Scholar]
- McAnany J. J., Alexander K. R. (2010). Spatial contrast sensitivity in dynamic and static additive luminance noise. Vision Research , 50 (19), 1957–1965. [DOI] [PMC free article] [PubMed] [Google Scholar]
- Meng X. L., Rosenthal R., Rubin D. B. (1992). Comparing correlated correlation-coefficients. Psychological Bulletin , 111 (1), 172–175. [Google Scholar]
- Movshon J. A., Thompson I. D., Tolhurst D. J. (1978). Spatial and temporal contrast sensitivity of neurones in areas 17 and 18 of the cat's visual cortex. The Journal of Physiology , 283, 101–120. [DOI] [PMC free article] [PubMed] [Google Scholar]
- Oruc I., Landy M. S. (2009). Scale dependence and channel switching in letter identification. Journal of Vision , 9 (9): 9 1–19, http://www.journalofvision.org/content/9/9/4, doi:10.1167/9.9.4. [PubMed] [Article] [DOI] [PMC free article] [PubMed] [Google Scholar]
- Parish D. H., Sperling G. (1991). Object spatial frequencies, retinal spatial frequencies, noise, and the efficiency of letter discrimination. Vision Research , 31 (7-8), 1399–1415. [DOI] [PubMed] [Google Scholar]
- Pelli D. G. (1981). Effects of visual noise. Cambridge, UK: Univeristy of Cambridge. [Google Scholar]
- Pelli D. G. (1985). Uncertainty explains many aspects of visual contrast detection and discrimination. Journal of the Optical Society of America A , 2 (9), 1508–1532. [DOI] [PubMed] [Google Scholar]
- Pelli D. G., Burns C. W., Farell B., Moore-Page D. C. (2006). Feature detection and letter identification. Vision Research , 46 (28), 4646–4674. [DOI] [PubMed] [Google Scholar]
- Pelli D. G., Farell B. (1999). Why use noise? Journal of the Optical Society of America A , 16 (3), 647–653. [DOI] [PubMed] [Google Scholar]
- Pelli D. G., Robson J. G., Wilkins A. J. (1988). The design of a new letter chart for measuring contrast sensitivity. Clinical Vision Sciences , 2 (3), 187–199. [Google Scholar]
- Petrov A. A., Dosher B. A., Lu Z. L. (2005). The dynamics of perceptual learning: An incremental reweighting model. Psychological Review , 112 (4), 715–743. [DOI] [PubMed] [Google Scholar]
- Rovamo J., Franssila R., Nasanen R. (1992). Contrast sensitivity as a function of spatial frequency, viewing distance and eccentricity with and without spatial noise. Vision Research , 32 (4), 631–637. [DOI] [PubMed] [Google Scholar]
- Rovamo J., Luntinen O., Nasanen R. (1993). Modelling the dependence of contrast sensitivity on grating area and spatial frequency. Vision Research , 33 (18), 2773–2788. [DOI] [PubMed] [Google Scholar]
- Schwiegerling J. (2000). Theoretical limits to visual performance. Survey of Ophthalmology , 45 (2), 139–146. [DOI] [PubMed] [Google Scholar]
- Thibos L. N., Hong X., Bradley A., Cheng X. (2002). Statistical variation of aberration structure and image quality in a normal population of healthy eyes. Journal of the Optical Society of America A , 19 (12), 2329–2348. [DOI] [PubMed] [Google Scholar]
- Tjan B. S., Chung S. T. L., Legge G. E. (2002). O letter channels, where art thou? Journal of Vision , 2 (7): 31, http://www.journalofvision.org/content/2/7/31, doi:10.1167/2.7.31. [Abstract] [Google Scholar]
- Tolhurst D. J. (1972). Adaptation to square-wave gratings: Inhibition between spatial frequency channels in the human visual system. The Journal of Physiology , 226 (1), 231–248. [DOI] [PMC free article] [PubMed] [Google Scholar]
- Tolhurst D. J., Barfield L. P. (1978). Interactions between spatial frequency channels. Vision Research , 18 (8), 951–958. [DOI] [PubMed] [Google Scholar]
- Watson A. B. (1979). Probability summation over time. Vision Research , 19 (5), 515–522. [DOI] [PubMed] [Google Scholar]
- Watson A. B. (1983). Detection and recognition of simple spatial forms. In Braddick O. J., Slade A. C. (Eds.), Physical and biological processing of images (pp 100–114). Berlin: Springer-Verlag. [Google Scholar]
- Watson A. B. (2000). Visual detection of spatial contrast patterns: Evaluation of five simple models. Optics Express , 6 (1), 12–33. [DOI] [PubMed] [Google Scholar]
- Watson A. B. (2013). A formula for the mean human optical modulation transfer function as a function of pupil size. Journal of Vision , 13 (6): 9 1–11, http://www.journalofvision.org/content/13/6/18, doi:10.1167/13.6.18. [PubMed] [Article] [DOI] [PubMed] [Google Scholar]
- Watson A. B., Ahumada A. J. (2008). Predicting visual acuity from wavefront aberrations. Journal of Vision , 8 (4): 9 1–19, http://www.journalofvision.org/content/8/4/17, doi:10.1167/8.4.17. [PubMed] [Article] [DOI] [PubMed] [Google Scholar]
- Watson A. B., Ahumada A. J. Jr. (2005). A standard model for foveal detection of spatial contrast. Journal of Vision , 5 (9): 9 717–740, http://www.journalofvision.org/content/5/9/6, doi:10.1167/5.9.6. [PubMed] [Article] [DOI] [PubMed] [Google Scholar]
- Watson A. B., Solomon J. A. (1997). Model of visual contrast gain control and pattern masking. Journal of the Optical Society of America A , 14 (9), 2379–2391. [DOI] [PubMed] [Google Scholar]
- Wilensky J. T., Hawkins A. (2001). Comparison of contrast sensitivity, visual acuity, and Humphrey visual field testing in patients with glaucoma. Transactions of the American Ophthalmology Society , 99, 213–218. [PMC free article] [PubMed] [Google Scholar]
- Williams D. R., Brainard D. H., McMahon M. J., Navarro R. (1994). Double-pass and interferometric measures of the optical quality of the eye. Journal of the Optical Society of America A , 11 (12), 3123–3135. [DOI] [PubMed] [Google Scholar]
- Xu P., Lu Z. L., Qiu Z., Zhou Y. (2006). Identify mechanisms of amblyopia in Gabor orientation identification with external noise. Vision Research , 46 (21), 3748–3760. [DOI] [PubMed] [Google Scholar]


