Abstract
Background
Lumbar spinal stenosis is a painful and debilitating condition resulting in healthcare costs totaling tens of billions of dollars annually. Initial treatment consists of conservative care modalities such as physical therapy, NSAIDs, opioids, and steroid injections. Patients refractory to these therapies can undergo decompressive surgery, which has good long-term efficacy but is more traumatic and can be associated with high post-operative adverse event (AE) rates. Interspinous spacers have been developed to offer a less-invasive alternative. The objective of this study was to compare the costs and quality adjusted life years (QALYs) gained of conservative care (CC) and decompressive surgery (DS) to a new minimally-invasive interspinous spacer.
Methods
A Markov model was developed evaluating 3 strategies of care for lumbar spinal stenosis. If initial therapies failed, the model moved patients to more invasive therapies. Data from the Superion FDA clinical trial, a prospective spinal registry, and the literature were used to populate the model. Direct medical care costs were modeled from 2014 Medicare reimbursements for healthcare services. QALYs came from the SF-12 PCS and MCS components. The analysis used a 2-year time horizon with a 3% discount rate.
Results
CC had the lowest cost at $10,540, while Spacers and DS were nearly identical at about $13,950. CC also had the lowest QALY increase (0.06), while Spacers and DS were again nearly identical (.28). The incremental cost-effectiveness ratios (ICER) for Spacers compared to CC was $16,300 and for DS was $15,200.
Conclusions
Both the Spacer and DS strategies are far below the commonly cited $50,000/QALY threshold and produced several times the QALY increase versus CC, suggesting that surgical care provides superior value (cost / effectiveness) versus sustained conservative care in the treatment of lumbar spinal stenosis.
Keywords: cost effectiveness, QALY, interspinous spacer, intermittent neurogenic claudication, Laminectomy, Lumbar spinal stenosis, decompressive surgery, Superion
Introduction
Lumbar spinal stenosis (LSS) is a condition in which the spinal canal becomes increasingly narrowed from degenerative changes such as facet arthropathy, disc degeneration, spondylolisthesis, and thickening/buckling of the ligamentum flavum; all of which result in compression of the thecal sac and contained nerve roots.1 LSS is the most common indication for lumbar spine surgery and has an estimated annual incidence of 5 cases per 100,000 individuals.2 Furthermore, LSS continues to increase in prevalence and is one of the most common reasons for surgery in elderly patients (>65 years old).3–6 The cost to society in the United States resulting from this disease process has been estimated in the tens of billions of dollars annually.7, 8
The initial treatment of LSS consists of various nonoperative approaches including physical therapy, pain medications (NSAIDs, mild opioids), and epidural steroid injections, referred to as conservative care (CC) in this study. There is no standardized paradigm for non-operative treatments in patients with LSS; and as such, approaches to management are often guided by clinical judgment of the treating physician. Patients with symptoms refractory to sustained (longer than 6 to 12 weeks) medical management warrant surgical consideration. Open lumbar laminectomy remains the gold standard for surgical decompression in patients with medically refractory LSS and has been shown to have good long-term efficacy. 5, 9–13 However, open lumbar laminectomy has been shown to be associated with post-operative complication rates ranging from 12 to 29%, depending on comorbidity status, which is particularly important since LSS is predominantly a disease of the elderly, a demographic inherently associated with higher rates of comorbidities.14–18
As a result, less invasive surgical treatment strategies have been explored to manage patients with LSS refractory to conservative care. One such alternative is an interspinous device, which can be implanted between the spinous processes in the lumbar spine. These devices are designed to mechanically limit segmental lumbar extension and thereby maintain the diameter of the spinal canal and neuroforamen at the level of insertion.19 The clinical effectiveness of an interspinous device compared to conservative care for the treatment of LSS has been previously demonstrated in a prospective, randomized clinical trial.8 This study evaluates the cost-effectiveness of a next generation interspinous spacer (Superion®, VertiFlex, Inc.) that is significantly less invasive than previous spacers.
Markov models are frequently used for cost-effectiveness analysis.20, 21 The models assume that a patient is always in one of a finite number of discrete health states, called Markov states. Transitions from one state to another are used to represent patient events. Health care costs and utilities can be assigned at each state, and accumulated over the duration of the model. Because the Markov model can represent repetitive events and the time dependence of both probabilities and utilities, it can more accurately represent clinical settings than simpler models. In the current study, we developed a Markov microsimulation model to compare the clinical effectiveness and cost-utility of comprehensive conservative care (CC), decompressive surgery by laminectomy without fusion (DS), and placement of the Superion interspinous device (Spacer) for the treatment of LSS.
Methods
A Markov model was developed to simulate costs, health outcomes, and incremental cost-effectiveness comparing three strategies for treatment of LSS. Each strategy included initial and follow-up treatments. Within a strategy, if the initial treatment failed, patients received a follow-up treatment. The initial treatments were conservative care (CC), decompressive surgery (DS) or interspinous spacer (Spacer). The index DS did not include fusion. DS with fusion was modeled only as a follow-up treatment after DS or Spacer failure, and only by a portion of patients with failure. The target population was assumed to have moderate symptoms of neurogenic claudication secondary to a confirmed diagnosis of LSS at one or two contiguous levels from L1 to L5, with or without Grade 1 spondylolisthesis, and have completed at least six months of conservative treatment. Data sources used to populate the model came from three sources. DS estimates were from a prospective spinal registry, from which patients that met the target population criteria and received DS without fusion were analyzed. CC estimates were from a previously published paper.22 The spacer treatment data came from the pivotal FDA IDE trial of the Superion Interspinous Spacer System sponsored by VertiFlex, Inc.23 The primary outcome measure analyzed was qualityadjusted life years (QALYs) gained. A payer perspective was taken. The payer reimburses the facility and physicians for procedures, but does not make separate reimbursement for implants. The model aggregates the cost of patient care, which includes the index procedure and any follow-up care or repeat procedures. Therefore, the model provides a more complete payer cost estimate than the cost of index procedures alone. All costs were in 2014 US dollars.
Model structure
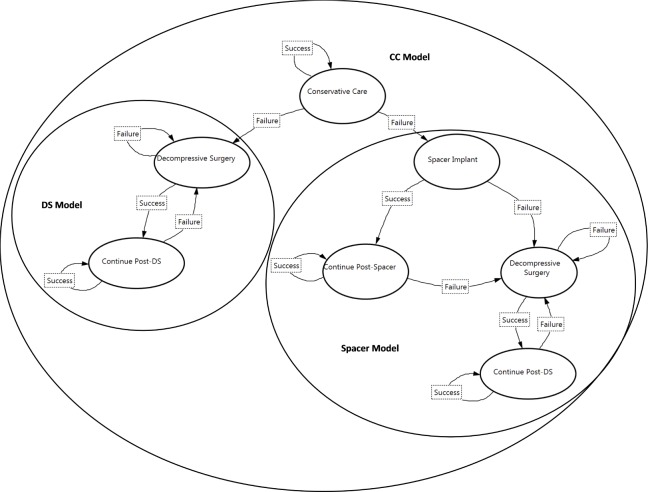
Each strategy had a similar Markov process. The Markov process for the CC strategy had seven states (Figure 1). Patients began the simulation in the Conservative Care state. Patients returned to that state in following cycles, although they had a probabilistic chance of treatment failure, which was followed by either DS or Spacer treatment. For patients receiving DS, if DS was successful, the patient moved to the Continue Post-DS state in the next cycle. If DS was unsuccessful, the patient returned to the DS state in the next cycle. Patients remained in the Continue Post-DS state, unless there was a DS failure, when they would return to DS. Similar transitions were followed for patients with Spacer treatment. However, the transition after failed Spacer treatment was to DS. Ninety percent of CC failures transitioned to DS in the base case analysis.
Fig. 1.
Markov Models for Conservative Care (CC) Strategy, Spacer Strategy, and Decompressive Surgery (DS) Strategy.
The Markov process for the Spacer strategy had four states (Figure 1, Spacer Model). Patients underwent Spacer Implant in the first cycle. If the implant was successful, the patient moved to the Continue Post-Spacer state in the next cycle. If the implant was unsuccessful, the patient moved to the DS state in the next cycle. Patients in the Continue Post-Spacer state returned to that state in following cycles, although they had a probabilistic chance of moving to DS due to implant failure. After DS, patients moved to the Continue Post-DS state or returned to DS.
Similarly, the Markov process for DS had two states (Figure 1, DS Model). Patients underwent DS in the first cycle. If the treatment was successful, the patient moved to the Continue Post-DS state in the next cycle. If the treatment was unsuccessful, the patient returned to the DS state in the next cycle. Patients in the Continue Post-DS state returned to that state in following cycles, although they had a probabilistic chance of moving to DS due to treatment failure.
Model Inputs
Estimates of treatment failure rates, adverse event rates, follow-up care utilization, and outcomes were from Parker et al, analysis of institutional registry data, and analysis of the Superion FDA trial data.22, 23 The registry included patient demographics, disease characteristics, and treatment variables assessed prospectively for each case. Baseline, three-month, one-year, and two-year Oswestry Disability Index (ODI), SF-12 quality of life, and follow-up utilization were assessed in phone interviews.22 Similarly, the trial data included two-year follow-up after implant with the interspinous spacer. The details of this trial have been described in a previous publication.23
Costs
Costs included cost of procedures, complications, and follow-up utilization of healthcare resources (physical therapy, chiropractic therapy, epidural steroid injections, diagnostics, and medications). Procedure costs included reimbursements to the physician, anesthesiologist, and facility. CC and DS patient-reported resource utilization data over a twoyear period were collected prospectively by telephone interviews. Self-reported instances of medical resource use were multiplied by unit costs for each cost component. Unit costs for office visits, hospitalizations, diagnostic tests, and DS procedures were based on 2012 Medicare national allowable payment amounts and inflated to 2014 using the medical consumer price index (CPI). Medication prices were based on 2012 average wholesale price and inflated to 2014.22 Follow-up physical therapy utilization for Spacer patients was from the FDA trial data. Followup utilization for other services was assumed to be the same as DS patients. The unit costs applied for CC and DS follow-up utilization were applied for Spacer follow-up utilization.
Costs of Spacer and DS fusion procedures were based on the appropriate DRG and CPT codes. The cost of DS fusion procedure was needed because a portion of patients who failed either their index DS or Spacer went on to have DS with fusion. All Spacer procedures were assumed to be performed in the hospital outpatient setting. Spacer CPT codes were 0171T and 0172T. Cost of DS with fusion was based on reimbursement for DRG 460 and CPT codes 22558, 22585, 22630, 22632, 22851, 22840, 22842. Anesthesiology costs for the Spacer procedure assumed 60 minutes and code 00670. Anesthesiology costs for DS without fusion assumed 180 minutes and code 00630, DS with fusion assumed 180 minutes and code 00670. All DS procedures were assumed to be performed as inpatient. Cost of inpatient rehabilitation was from the Medicare 2014 base rate adjusted for case-mix groups applicable to postspine surgery patients (0501, 0601, 0901, 2001).24 The cost was estimated as the average of the case-mix adjusted rates, assuming maximum function and minimum comorbidities.
Quality Adjusted Life Years (QALYs)
QALYs were measured using the SF-6D, estimated from the Mental Component Score (MCS) and Physical Component Scores (PCS) of the SF-12, age, and sex.25 Individual level SF-12 MCS and PCS were available for the Spacer and DS patients. Summary data were used for the CC patients. For the model, QALYs gained during each quarter post-treatment were estimated by linear interpolation.
Analysis
Data analyses were performed using SAS version 9.4 (SAS Institute, Inc., Cary, NC). To recognize baseline differences in the patient populations that could affect outcomes, QALYs gained and failure rates for each surgical treatment were modeled as a function of baseline ODI and follow-up period. A repeated measures model was used to analyze QALY gains. If a significant relationship between baseline ODI and QALYs gained or failure rates was observed, baseline ODI was retained in the model. Exponential failure rates were estimated for Spacer; a life table method was used for DS. Modeling analyses were performed using TreeAge Pro Suite 2013 (TreeAge Software, Williamstown, MA). The micro-simulation had a two year time horizon, in quarterly cycles, and 10,000 hypothetical patients. Each simulated patient accumulated costs and health outcomes, which were discounted at 3% per year. Results were presented as mean costs, QALYs, and incremental cost-effectiveness ratios comparing surgical strategies to CC strategy. The primary endpoint for the cost-effectiveness analysis was the incremental cost-effectiveness ratio (ICER). To estimate the ICER, average total costs and average QALYs from baseline to 2-years were estimated for conservative care vs. surgical treatment groups. The ICER was defined as the difference in mean total costs between cohorts, divided by the difference in mean QALYs as follows: ICER = (COST Strategy A - COST Strategy B)/(QALY Strategy A - QALY Strategy B). Sensitivity analysis was conducted on single variables in the standard way, using the 95% confidence interval for the high and low values. Additionally, probabilistic sensitivity analysis, a standard method of integrating uncertainty about many variables simultaneously, was performed. 26
Results
Patient Comparison
Baseline patient characteristics are shown in Table 1. CC patients had a higher level of disability as measured by ODI (57) compared to the DS cohort (47) and the Spacer cohort (39), p < 0.05. Differences in ODI were found to be significant predictors of QALYs gained for the Spacer and DS patients, but had no effect on failure rates. QALYs gained for DS and Spacer treatments were estimated after adjusting for baseline ODI. For use in the model, a baseline ODI of 52 was assumed, the average ODI of the CC and DS patients. Age and gender of Spacer (66±9 years, 58% male) and DS (64±11 years, 59% male) patients were similar and assumed to have no significant relationship to QALYs gained or failure rates; therefore no covariate adjustment was performed. CC patients were slightly younger (58±12 years, p < 0.05) and less likely to be male (40%, p < 0.05) compared to the DS patients. The SF-12 PCS differed significantly among the groups. The differences were assumed to be highly correlated with the ODI score and therefore the ODI covariate adjustment sufficed to control for these differences. The SF-12 MCS scores were similar across patient groups. Approximately half of surgeries were one level and there was no difference in number of levels between Spacer and DS cohorts.
Table 1.
Baseline Characteristics
| Characteristic | CC * | Spacer† | DS‡ | Comparison p-value§ | ||
|---|---|---|---|---|---|---|
| CC v Spacer | CC v DS | Spacer v DS | ||||
| Number of patients | 100 | 189 | 129 | NA | NA | NA |
| Age, mean (SD) | 58 (12) | 66 (9) | 64 (11) | <0.05 | <0.05 | NS |
| Male, % | 40 | 58 | 59 | <0.05 | <0.05 | NS |
| ODI, mean (SD) | 57 (19) | 39 (13) | 47 (14) | <0.05 | <0.05 | <0.05 |
| SF-12 PCS, mean (SD) | 31.4 (8.1) | 29.2 (8.4) | 26.7 (9.4) | <0.05 | <0.05 | <0.05 |
| SF-12 MCS, mean (SD) | 49.2 (12.1) | 49.9 (13.1) | 48.2 (11.2) | NS | NS | NS |
| 1 Level treated, % | NA | 52 | 45 | NS | NS | NS |
| 2 Levels treated, % | NA | 48 | 55 | |||
SD: Standard deviation.
CC: Conservative Care, from Parker et al. 2014. Results from spondylolisthesis and stenosis patients were combined.
Spacer: from ISISS trial, Superion patients.
DS: Decompressive Surgery without fusion, from institutional registry.
For continuous variables, a two sample Z-test was used for the pairwise comparisons. For categorical variables, Fisher's exact test was used. A p-value of 0.05 was considered statistically significant. No corrections for multiplicity were applied.
Base case values
Base case values of model estimates are shown in Table 2. Quarterly failure rate was highest among CC patients, 4.3% per quarter, and lowest among DS patients, 1.2% per quarter. Spacer patients had a 2.7% failure rate. No adverse events after Spacer implant generated reimbursement outside of the global 90-day payment. Five percent of DS patients experienced an adverse event leading to hospital readmission and nearly four percent were discharged to an inpatient rehabilitation facility after the initial procedure. For the patients requiring secondary decompressive surgery after DS or Spacer failure, the fusion rate was assumed to be 31%, based on the data from the FDA trial.
Table 2.
Base Case Values.
| Treatments | |||
|---|---|---|---|
| CC | Spacer | DS | |
| Variable | Base Case | Base Case | Base Case |
| Failure rate, quarterly | 4.3% | 2.7% | 1.2% |
| 1 Level | NA | 50.0% | 50.0% |
| 2 Levels | NA | 50.0% | 50.0% |
| Adverse event* | NA | 0.0% | 5.4% |
| Inpatient rehabilitation | NA | 0.0% | 3.9% |
| Fusion, secondary treatmentx | 31% | ||
| Probability of utilization - Qtr of Procedure | |||
| Healthcare | NA | 45.2% | 76.2% |
| Medications | NA | 94.4% | 94.4% |
| Diagnostics | NA | 22.2% | 22.2% |
| Probability of utilization - FU Quarters | |||
| Healthcare | 94.0% | 13.1% | 12.9% |
| Medications | 100.0% | 64.3% | 64.3% |
| Diagnostics | 86.0% | 8.8% | 8.8% |
| Costs | |||
| Procedure | |||
| 1 Level | $7,367 | $7,883 | |
| 2 Levels | $7,683 | $8,155 | |
| 1 Level, fusionx | NA | $26,118 | |
| 2 Levels, fusionx | NA | $27,662 | |
| Anesthesiology | NA | $386 | $454/$567# |
| Inpatient rehabilitation | NA | NA | $9,100 |
| Qtr of Procedure | |||
| Healthcare | $662 | $774 | |
| Medications | $334 | $334 | |
| Diagnostics | $333 | $333 | |
| FU Quarters | |||
| Healthcare | $289 | $665 | $1,060 |
| Medications | $498 | $337 | $337 |
| Diagnostics | $162 | $870 | $870 |
| Adverse Event | NA | $6,770 | |
| QALY gained‡ | |||
| Baseline to 3 mo | 0.008 | 0.111 | 0.091 |
| 3 mo - 6 mo | 0.016 | 0.144 | 0.173 |
| 6 mo - 9 mo | 0.016 | 0.144 | 0.162 |
| 9 mo - 12 mo | 0.016 | 0.144 | 0.155 |
| After 12 mo | 0.016 | 0.144 | 0.151 |
Adverse Events (AE) that generate additional reimbursement outside of the global payment. Healthcare includes non-surgeon physician visits, physical therapy, chiropractic care, acupuncture. Medications include narcotics, muscle relaxants, NSAIDs, and oral steroids. Diagnostics include MRI scans, CT scans, x-rays, spine injections, and EMGs. Superion patients assumed to have the same level of utilization for non-surgeon physician visits, medications, and diagnostics as decompressive surgery patients.
DS with fusion was received by a portion of patients after DS or Spacer failure.
Anesthesiology rate for DS without fusion / Anesthesiology rate for DS with fusion.
QALY gained is an annual amount; one-fourth of the value is accumulated each quarter.
Probability of any healthcare, medication, or diagnostic utilization for CC patients approached 100% each quarter. In the quarter of the procedure, use of healthcare was lower for Spacer patients compared to DS patients, 45.2% vs. 76.2%, because fewer Spacer patients had outpatient physical therapy. In the quarter of the procedure, 94.4% of DS patients used medications and approximately one-fifth of DS patients had diagnostic testing. Use of medications during follow-up continued for nearly two-thirds of DS patients, but use of healthcare and diagnostic services decreased to 12.9% to 8.8% of patients.
Utilities
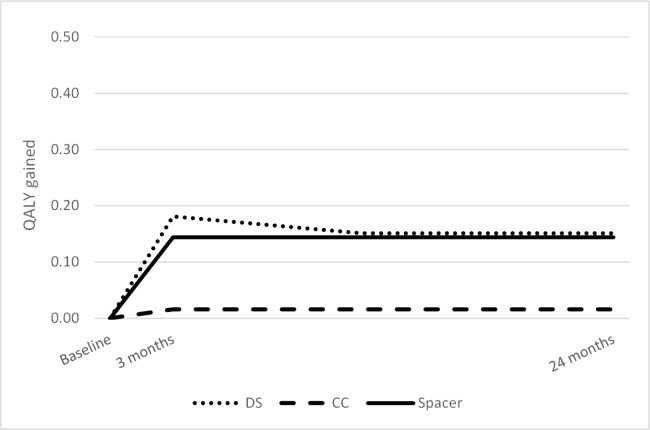
After adjustment for baseline ODI, QALYs gained after 24 months were 0.016, 0.144, and 0.151 for CC, Spacer, and DS, respectively (Figure 2). The QALYs gained during each quarter after treatment applied in the model are shown in Table 2.
Fig. 2.
QALYs gained at three months and 24 months.
Base-Case Analysis
Average cost per patient was lowest for the CC Strategy ($10,540) and nearly identical for the Spacer and DS strategies ($13,947, $13,958) (Table 3). The CC strategy had the lowest QALY increase (0.06), while the QALY increase from the surgical strategies was 0.27 for the spacer cohort and 0.29 for the DS cohort. Consequently, the incremental cost effective ratios (ICERs) for the surgical strategies compared to CC were similar, $16,302 for the Spacer cohort and $15,231 for the DS cohort.
Table 3.
Base case results.
| Cost | Incremental Cost* | QALYs Gained | Incremental QALYs* | ICER* | |
|---|---|---|---|---|---|
| CC Strategy | $10,540 | NA | 0.06 | NA | NA |
| Spacer Strategy | $13,947 | $3,408 | 0.27 | 0.21 | $16,302 |
| DS Strategy | $13,958 | $3,418 | 0.29 | 0.22 | $15,231 |
CC: Conservative Care; DS: Decompressive Surgery; Spacer: Interspinous spacer.
Compared to CC Strategy
Sensitivity Analysis
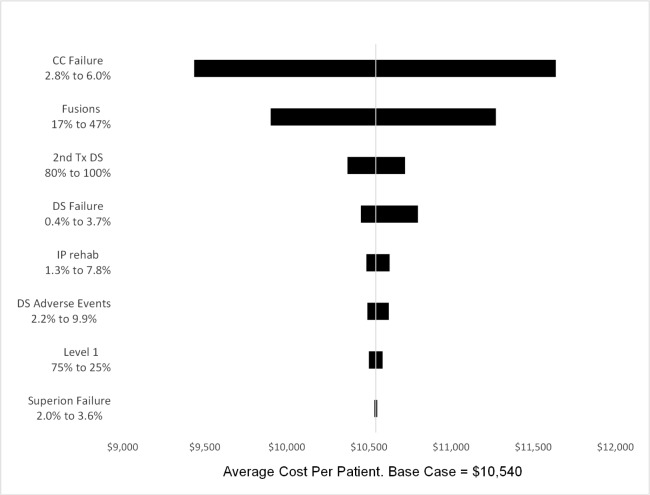
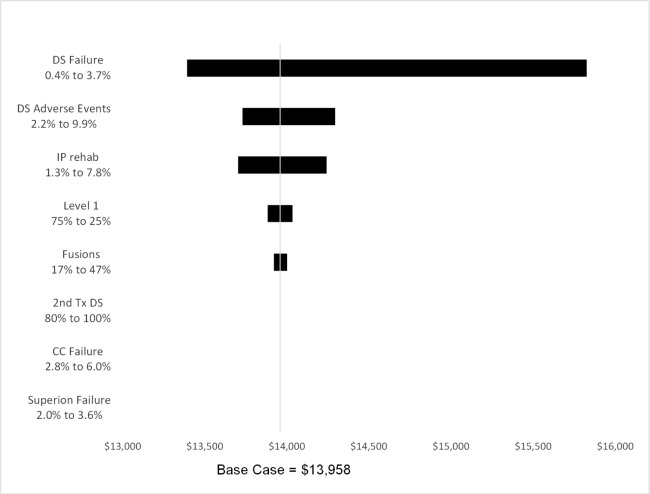
One-variable sensitivity analyses (SA) value ranges and probabilistic sensitivity analysis (PSA) distributions are shown in Table 4. Results from one-variable SA showed that failure rates had the greatest influence on strategy costs. The average cost per patient in the CC strategy was $1100 above or below the base case at the upper and lower failure rates (Figure 3). The percentage of patients with fusion changed the average cost per patient by approximately $700 in either direction. None of the other variables changed the average cost by more than $300. Utility gained was affected by values of the CC and Spacer failure rates and CC and DS utility gain. Over all scenarios, CC strategy utility gain ranged from 0.04 to 0.08.
Table 4.
One-variable and probabilistic sensitivity analyses, Ranges and Distributions.
| One-Variable Sensitivity Analysis | Probabilistic Sensitivity Analysis | |||
|---|---|---|---|---|
| Variable | Lower | Base case | Upper | Distribution (Parameters) |
| Failure | ||||
| CC | 0.028 | 0.043 | 0.060 | Beta (mean=.043, SE=.008) |
| Spacer | 0.020 | 0.027 | 0.036 | Beta (mean=.027,SE=.004) |
| DS | 0.004 | 0.012 | 0.037 | Beta (mean=.012,SE=.008) |
| DS AE rate | 0.022 | 0.054 | 0.099 | Beta (α = 7, β = 122) |
| IRF discharge rate | 0.013 | 0.039 | 0.078 | Beta (α = 5, β = 124) |
| Proportion 1 Level | 0.25 | 0.50 | 0.75 | Triangular (0.25,0.50,0.75) |
| Fusion rate | 0.17 | 0.31 | 0.47 | Beta (α = 11, β = 24) |
| DS after CC failure | 0.80 | 0.90 | 1.00 | Triangular (0.80,0.90,1.00) |
| Utility Increase | ||||
| CC | 0.000 | 0.016 | 0.030 | Fixed |
| Spacer | 0.120 | 0.144 | 0.168 | Normal (0.144, 0.013) |
| DS, 3 mo | 0.154 | 0.181 | 0.207 | Normal (0.181, 0.014) |
| DS, 12 mo | 0.124 | 0.151 | 0.179 | Normal (0.151, 0.014) |
Fig. 3.
Conservative Care Strategy one-variable sensitivity analysis.
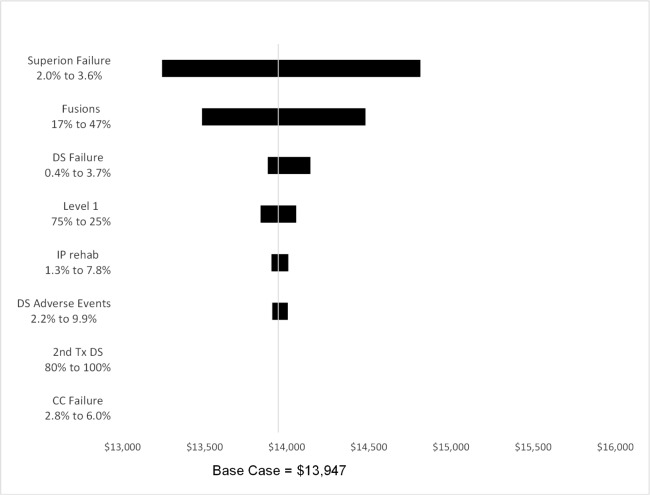
The average cost per patient in the Spacer strategy was $700 below or $900 above the base case at the upper and lower failure rates (Figure 4). The percentage of patients with fusion changed the average cost per patient by approximately $500 in either direction. None of the other variables changed the average cost by more than $200. Utility gained was affected only by values of the Spacer utility gain, when Spacer strategy utility gain ranged from 0.23 to 0.31. The average cost per patient in the DS strategy was $600 below or $1900 above the base case at the upper and lower failure rates (Figure 5). Adverse event and the inpatient rehabilitation rates changed the average cost per patient by approximately $300 in either direction. Utility gained was affected only by values of the DS treatment utility gain, when DS strategy utility gain ranged from 0.23 to 0.34.
Fig. 4.
Spacer Strategy one-variable sensitivity analysis.
Fig. 5.
Decompressive Surgery Strategy one-variable sensitivity analysis.
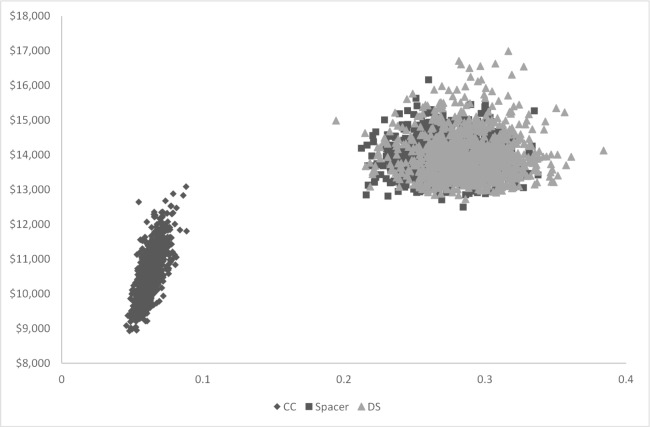
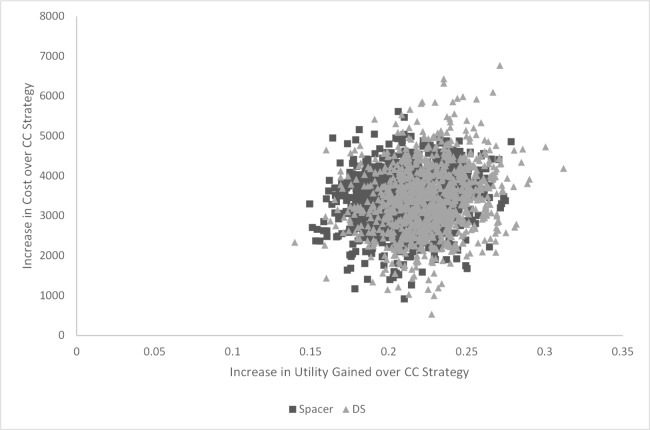
Results of the PSA showed the average cost per patient for the CC strategy ranged from $9000 to $13000, while utility gained ranged from 0.05 to 0.09 (Figure 6). The average cost per patient ranged from $12500 to $16200 for the Spacer strategy and $12700 to $17000 for the DS strategy. Utility gained ranged from 0.21 to 0.34 for the Spacer strategy and 0.19 to 0.38 for the DS strategy. The cost-effectiveness plane plots the increase in cost versus the increase in utility gained of the surgery strategies compared to the CC strategy. The surgery strategies showed considerable overlap (Figure 7). On average, the surgeries cost $3400 more per patient than the CC Strategy, with greater QALYs gained of 0.21 to 0.22.
Fig. 6.
Decompressive Surgery Strategy one-variable sensitivity analysis.
Fig. 7.
Cost-effectiveness plane: Increase in cost versus increase in utility gained, Spacer and Decompressive Surgery (DS) Strategies compared to the Conservative Care (CC) Strategy.
Discussion
In the current study, we developed a Markov microsimulation model to compare the clinical effectiveness and cost-utility of conservative care (CC), decompressive surgery (DS), and placement of a new minimally-invasive interspinous spacer (Spacer) in the treatment of lumbar spinal stenosis (LSS). We observed a significant and virtually identical improvement in quality of life for patients treated with either DS (0.151) or an interspinous spacer (0.144). On the other hand, patients undergoing CC did not experience a significant improvement (0.016).
Furthermore, the cost per QALY gained in the DS and Spacer treatments were much lower than CC: $48,131/QALY gained with DS and $51,656/QALY gained with Spacer. Conversely, sustained CC had a very large cost/QALY gained value of $175,667. When directly compared to the CC cohort, both types of surgical management were found to be cost-effective strategies with an incremental cost-effective ratio (ICER) of $15,231 per QALY gained for DS and $16,302 per QALY gained for placement of an interspinous spacer. Compared to the often accepted cost-effective ICER threshold of $50,000/QALY, both of these surgical treatments represent very attractive strategies.
The findings of the current study are consistent with previous evidence reported in the literature pertaining to the cost effectiveness of surgical vs. conservative care treatment for LSS. Burnett et al. constructed a cost-effectiveness model based on a literature review of conservative treatment, decompressive surgery, and use of an interspinous spacer for the treatment of LSS.27 The authors found both surgical treatments (laminectomy and interspinous spacers) to be more cost-effective than continued conservative care. Similarly, Skidmore et al. calculated the relative cost-effectiveness of the same three treatment strategies for LSS using clinical, quality of life, and economic data from various sources.18 The authors demonstrated that in LSS patients with moderately impaired physical functioning, treatment with an interspinous spacer was cost-effective compared to conservative care (ICER = $17,894/QALY) and dominant to decompressive lumbar laminectomy (provided better improvement in quality of life and was less expensive).
In a prospective, randomized controlled trial (SPORT), Tosteson et al. demonstrated that laminectomy for stenosis was cost-effective when compared to medical management with an ICER of $77,600/QALY.28 This study remains the sole Level 1 evidence for the cost utility of surgical vs. medical management of LSS; however, it should be noted that the high degree of treatment cross-over after randomization likely introduced significant bias into the cost-utility analysis, artificially elevating the mean reported QALY gained in the medical cohort and falsely decreasing the incremental QALY gain and cost-effectiveness of lumbar laminectomy.29–31 Both of these factors would have the effect of decreasing the observed cost-utility of surgical vs. medical management in this patient population.
Decompressive lumbar laminectomy remains the gold standard surgical intervention for patients with medically refractory LSS; however, it is an open and invasive surgical procedure and has been shown to be associated with post-operative complication rates ranging from 12-29%.18 As such, there has been substantial interest in developing less invasive treatment options. In a select subset of patients with LSS, placement of an interspinous spacer at the level of stenosis has been shown to be superior to sustained conservative care.8
The patient population in which an interspinous spacer may be most effective is those with medically refractory neurogenic claudication from LSS, whose symptoms are significantly relieved during flexion. Furthermore, it is most suitable for patients with moderate symptoms of neurogenic claudication who can still walk at least 50 feet. Patients with a fixed motor deficit, severe disability symptoms, bowel/bladder symptoms, greater than Grade I spondylolisthesis, or previous lumbar surgery at the affected level are not suitable candidates for consideration of an interspinous spacer. Therefore, in the continuum of treatment options for patients with LSS, placement of an interspinous spacer can be an effective alternative to both sustained conservative care and decompressive surgery in patients with the above characteristics.
The limitations inherent in our study have significant implications for its interpretation. As in many studies using economic models, the treatments were not all randomized against one another. If outcomes are related to patient characteristics, this can cause bias in the comparisons. To address differences in patients at baseline, we modeled failure rates and QALYs gained as a function of baseline ODI, and adjusted when indicated. While small sample sizes, such as those used in our model, do not in themselves cause bias, they do lead to more variable estimates of each treatment's effectiveness, and therefore more uncertainty in the comparisons. This may be especially true during the second year after the procedure, when the original sample size was somewhat reduced. However, our base case failure rates were within the range of other studies. For DS, our failure rate was 9.2% over two years, somewhat higher than 6.8% from Burnett, but similar to 8.9% (35/394) reported from the SPORT study.27, 28 In addition, results from our PSA were similar to the base case analysis, showing higher cost and greater QALYs gained for the surgical strategies compared to the CC strategy (Figure 6 & Figure 7).
Utility was estimated as a function of age, sex, SF-12 MCS and PCS scores. We did not recognize a utility decrement when a patient suffered an AE or incurred an IRF stay; but because these were short term events, they would have had minor impact on 2-year utility. Our QALYS gained by 2 years were also similar to previous studies. For Spacer, our QALY gained was 0.144 which compares to 0.14 from Skidmore and 0.15 from Burnett.18, 27 Similarly, our DS QALY gained was 0.15, which compares to 0.08 from Skidmore and 0.16 from Burnett and 0.17 from Tosteson. 18, 27, 28
Finally, our analysis was limited to a two-year time horizon due to the available data. LSS is a lifetime condition, so longer time horizons may be of interest even in the commercial insurance market. It will be important to extend the time horizon of this and other studies as longer-term data become available on interspinous spacers.
Conclusions
The current study adds to the evidence supporting decompressive surgery (DS) as a cost-effective strategy relative to sustained conservative care (CC) in treatment of lumbar spinal stenosis. In addition, we provide evidence to support a new Spacer treatment as cost-effective compared to CC and similar to DS in cost and QALYs gained. With ICERs of well under the generally accepted $50,000/QALY, these results suggest that surgical treatments provide superior value (cost / effectiveness) versus sustained conservative care in the treatment of patients with lumbar spinal stenosis.
Disclosures
This study was funded in part by Vertiflex, Inc., San Clemente CA USA. Scott Parker is a paid consultant for Vertiflex, Inc. Anderson and Nelson were paid by Vertiflex, Inc. as consultants on this project. Patel has received research funding from Vertiflex as part of an FDA trial.
References
- 1.Katz JN, Harris MB. Clinical practice. Lumbar spinal stenosis. N. Engl. J. Med. 2008;358(8):818–825. doi: 10.1056/NEJMcp0708097. [DOI] [PubMed] [Google Scholar]
- 2.Johnsson KE. Lumbar spinal stenosis. A retrospective study of 163 cases in southern Sweden. Acta Orthop. Scand. 1995;66(5):403–405. doi: 10.3109/17453679508995574. [DOI] [PubMed] [Google Scholar]
- 3.Iguchi T, Kurihara A, Nakayama J, Sato K, Kurosaka M, Yamasaki K. Minimum 10-year outcome of decompressive laminectomy for degenerative lumbar spinal stenosis. Spine. 2000;25(14):1754–1759. doi: 10.1097/00007632-200007150-00003. [DOI] [PubMed] [Google Scholar]
- 4.Asgarzadie F, Khoo LT. Minimally invasive operative management for lumbar spinal stenosis: overview of early and long-term outcomes. Orthop. Clin. North Am. 2007;38(3):387–399. doi: 10.1016/j.ocl.2007.02.006. abstract vi-vii. [DOI] [PubMed] [Google Scholar]
- 5.Javid MJ, Hadar EJ. Long-term follow-up review of patients who underwent laminectomy for lumbar stenosis: a prospective study. J. Neurosurg. 1998;89(1):1–7. doi: 10.3171/jns.1998.89.1.0001. [DOI] [PubMed] [Google Scholar]
- 6.Kleeman TJ, Hiscoe AC, Berg EE. Patient outcomes after minimally destabilizing lumbar stenosis decompression: the “Port-Hole” technique. Spine. 2000;25(7):865–870. doi: 10.1097/00007632-200004010-00016. [DOI] [PubMed] [Google Scholar]
- 7.Deyo RA. Promises and limitations of the Patient Outcome Research Teams: the low-back pain example. Proc. Assoc. Am. Physicians. 1995;107(3):324–328. [PubMed] [Google Scholar]
- 8.Zucherman JF, Hsu KY, Hartjen CA, et al. A multicenter, prospective, randomized trial evaluating the X STOP interspinous process decompression system for the treatment of neurogenic intermittent claudication: two-year follow-up results. Spine. 2005;30(12):1351–1358. doi: 10.1097/01.brs.0000166618.42749.d1. [DOI] [PubMed] [Google Scholar]
- 9.Amundsen T, Weber H, Nordal HJ, Magnaes B, Abdelnoor M, Lilleâs F. Lumbar spinal stenosis: conservative or surgical management?: A prospective 10-year study. Spine. 2000;25(11):1424–1435. doi: 10.1097/00007632-200006010-00016. discussion 1435-1436. [DOI] [PubMed] [Google Scholar]
- 10.Cavuşoğlu H, Kaya RA, Türkmenoglu ON, Tuncer C, Colak I, Aydin Y. Midterm outcome after unilateral approach for bilateral decompression of lumbar spinal stenosis: 5-year prospective study. Eur. Spine J. Off. Publ. Eur. Spine Soc. Eur. Spinal Deform. Soc. Eur. Sect. Cerv. Spine Res. Soc. 2007;16(12):2133–2142. doi: 10.1007/s00586-007-0471-2. [DOI] [PMC free article] [PubMed] [Google Scholar]
- 11.Fu Y-S, Zeng B-F, Xu J-G. Long-term outcomes of two different decompressive techniques for lumbar spinal stenosis. Spine. 2008;33(5):514–518. doi: 10.1097/BRS.0b013e3181657dde. [DOI] [PubMed] [Google Scholar]
- 12.Arts MP, Brand R, van den Akker ME, et al. Tubular diskectomy vs conventional microdiskectomy for sciatica: a randomized controlled trial. JAMA. 2009;302(2):149–158. doi: 10.1001/jama.2009.972. [DOI] [PubMed] [Google Scholar]
- 13.Righesso O, Falavigna A, Avanzi O. Comparison of open discectomy with microendoscopic discectomy in lumbar disc herniations: results of a randomized controlled trial. Neurosurgery. 2007;61(3):545–549. doi: 10.1227/01.NEU.0000290901.00320.F5. discussion 549. [DOI] [PubMed] [Google Scholar]
- 14.Benz RJ, Ibrahim ZG, Afshar P, Garfin SR. Predicting complications in elderly patients undergoing lumbar decompression. Clin. Orthop. 2001;(384):116–121. doi: 10.1097/00003086-200103000-00014. [DOI] [PubMed] [Google Scholar]
- 15.Reindl R, Steffen T, Cohen L, Aebi M. Elective lumbar spinal decompression in the elderly: is it a high-risk operation? Can. J. Surg. J. Can. Chir. 2003;46(1):43–46. [PMC free article] [PubMed] [Google Scholar]
- 16.Thomé C, Zevgaridis D, Leheta O, et al. Outcome after less-invasive decompression of lumbar spinal stenosis: a randomized comparison of unilateral laminotomy, bilateral laminotomy, and laminectomy. J. Neurosurg. Spine. 2005;3(2):129–141. doi: 10.3171/spi.2005.3.2.0129. [DOI] [PubMed] [Google Scholar]
- 17.Ciol MA, Deyo RA, Howell E, Kreif S. An assessment of surgery for spinal stenosis: time trends, geographic variations, complications, and reoperations. J. Am. Geriatr. Soc. 1996;44(3):285–290. doi: 10.1111/j.1532-5415.1996.tb00915.x. [DOI] [PubMed] [Google Scholar]
- 18.Skidmore G, Ackerman SJ, Bergin C, et al. Cost-effectiveness of the X-STOP® interspinous spacer for lumbar spinal stenosis. Spine. 2011;36(5):E345–356. doi: 10.1097/BRS.0b013e3181f2ed2f. [DOI] [PubMed] [Google Scholar]
- 19.Lindsey DP, Swanson KE, Fuchs P, Hsu KY, Zucherman JF, Yerby SA. The effects of an interspinous implant on the kinematics of the instrumented and adjacent levels in the lumbar spine. Spine. 2003;28(19):2192–2197. doi: 10.1097/01.BRS.0000084877.88192.8E. [DOI] [PubMed] [Google Scholar]
- 20.Sonnenberg FA, Beck JR. Markov Models in Medical Decision Making A Practical Guide. Med. Decis. Making. 1993;13(4):322–338. doi: 10.1177/0272989X9301300409. [DOI] [PubMed] [Google Scholar]
- 21.Briggs A, Sculpher M. An introduction to Markov modelling for economic evaluation. PharmacoEconomics. 1998;13(4):397–409. doi: 10.2165/00019053-199813040-00003. [DOI] [PubMed] [Google Scholar]
- 22.Parker SL, Godil SS, Mendenhall SK, Zuckerman SL, Shau DN, McGirt MJ. Two-year comprehensive medical management of degenerative lumbar spine disease (lumbar spondylolisthesis, stenosis, or disc herniation): a value analysis of cost, pain, disability, and quality of life. J. Neurosurg. Spine. 2014 doi: 10.3171/2014.3.SPINE1320. [DOI] [PubMed] [Google Scholar]
- 23.Patel Vikas V, Whang Peter G, Haley Thomas R, et al. Two-year clinical outcomes of a multicenter randomized controlled trial comparing two interspinous spacers for treatment of moderate lumbar spinal stenosis. Rev. doi: 10.1186/1471-2474-15-221. [DOI] [PMC free article] [PubMed] [Google Scholar]
- 24.Medicare Payment Advisory Committee (Med-PAC) Inpatient Rehabilitation Facilities Payment System; 2013. Available at: http://www.medpac.gov/documents/payment-basics/inpatient-rehabilitation-facilities-payment-system.pdf?sfvrsn=0 Accessed June 30, 2014. [Google Scholar]
- 25.Hanmer J. Predicting an SF-6D preferencebased score using MCS and PCS scores from the SF-12 or SF-36. Value Health J. Int. Soc. Pharmacoeconomics Outcomes Res. 2009;12(6):958–966. doi: 10.1111/j.1524-4733.2009.00535.x. [DOI] [PMC free article] [PubMed] [Google Scholar]
- 26.Beynon R, Hawkins J, Laing R, et al. The diagnostic utility and cost-effectiveness of selective nerve root blocks in patients considered for lumbar decompression surgery: a systematic review and economic model. Health Technol. Assess. Winch. Engl. 2013;17(19):1–88. doi: 10.3310/hta17190. v-vi. [DOI] [PMC free article] [PubMed] [Google Scholar]
- 27.Burnett MG, Stein SC, Bartels RHMA. Cost-effectiveness of current treatment strategies for lumbar spinal stenosis: nonsurgical care, laminectomy, and X-STOP. J. Neurosurg. Spine. 2010;13(1):39–46. doi: 10.3171/2010.3.SPINE09552. [DOI] [PubMed] [Google Scholar]
- 28.Tosteson ANA, Lurie JD, Tosteson TD, et al. Surgical treatment of spinal stenosis with and without degenerative spondylolisthesis: cost-effectiveness after 2 years. Ann. Intern. Med. 2008;149(12):845–853. doi: 10.7326/0003-4819-149-12-200812160-00003. [DOI] [PMC free article] [PubMed] [Google Scholar]
- 29.Angevine PD, McCormick PC. SPORT: what neurosurgeons need to know. Clin. Neurosurg. 2008;55:72–75. [PubMed] [Google Scholar]
- 30.Angevine PD, McCormick PC. Inference and validity in the SPORT herniated lumbar disc randomized clinical trial. Spine J. Off. J. North Am. Spine Soc. 2007;7(4):387–391. doi: 10.1016/j.spinee.2007.04.010. [DOI] [PubMed] [Google Scholar]
- 31.Parker SL, Fulchiero EC, Davis BJ, et al. Cost-effectiveness of multilevel hemilaminectomy for lumbar stenosis-associated radiculopathy. Spine J. Off. J. North Am. Spine Soc. 2011;11(8):705–711. doi: 10.1016/j.spinee.2011.04.024. [DOI] [PubMed] [Google Scholar]


