Abstract
Histotripsy has been investigated as a non-invasive, drug-free, image-guided thrombolysis method that fractionates blood clots using acoustic cavitation alone. In previous histotripsy-mediated thrombolysis studies, cavitation clouds were generated using multi-cycle pulses and tended to form on vessel wall. To avoid potential cavitational damage to vessel wall, a new histotripsy approach, termed Microtripsy, has been recently discovered where cavitation is generated via an intrinsic-threshold mechanism using single-cycle pulses. We hypothesize that microtripsy can generate and confine cavitation in vessel lumen without contacting vessel wall, which results in recanalization within clot and potentially eliminating vessel damage. To test our hypothesis, microtripsy was investigated for clot recanalization in an in vitro flow model. Clots were formed inside a vessel phantom (6.5 mm inner diameter) in line with a flow system. Microtripsy was applied by a 1-MHz transducer at a pulse repetition frequency of 50 Hz with a peak negative pressure (P-) of 30 MPa or 36 MPa. To create a flow channel through a clot, the cavitation focus was scanned through the clot at an interval of 0.3 or 0.7 mm. The treated clots were 3D-scanned by a 20-MHz ultrasound probe to quantify the channels. Restored flow rates were measured and clot debris particles generated from the treatments were analyzed. In all treatments, cavitation cloud was consistently generated in the center of the vessel lumen without contacting the vessel wall. After each treatment, a flow channel was successfully generated through and completely confined inside the clot. The channels had a diameter up to 60 % of the vessel diameter with restored flow up to 500 mL/min. The debris particles were small with over 99.9% < 10 μm and the largest at 153 um. Each clot (2 cm long) was recanalized within 7 min. The size of the flow channels increased by using higher P- and was significantly larger by using the 0.3 mm scan interval than those using 0.7 mm. The results in this study show the potential of this new microtripsy thrombolysis method for fast, precise, and effective clot recanalization, minimizing risks of vessel damage and embolism.
Introduction
Thrombosis is the formation of a blood clot inside an artery or vein. Arterial obstruction via thrombosis in the cerebral vasculature leads to stroke, which is the fifth leading cause of death in the United States [1]. Deep vein thrombosis, or DVT, affects 300,000 people a year in the United States. Occurring mostly in the legs, it is the most common form of venous thrombosis. The current gold standard of thrombolytic treatment involves the infusion of thrombolytic drugs such as tissue plasminogen activator (tPA) [2, 3]. However administration of thrombolytic drugs systemically has limited effectiveness requiring long treatment time (several hours to days) and is associated with increased risks of major bleeding [4]. Other treatment options are catheter-based endovascular procedures that are site-specific but more invasive and associated with bleeding, vascular damage, and infections [5–8].
Ultrasound has been a promising technique for promoting clot breakdown for several decades. Significant efforts have been focused on enhancing the efficacy of thrombolytic drugs with low intensity ultrasound [9–12]. Several clinical trials have been conducted and the results are promising [13–15]. Ultrasound combined with microbubbles has also been demonstrated to successfully break down clot in the presence or absence of thrombolytic drugs [16–18]. Another approach using high-intensity focused ultrasound (HIFU) alone for thrombolysis has been investigated in vitro and in vivo [19–21].
Histotripsy fractionates soft tissue by well-controlled acoustic cavitation using microsecond-long, high-intensity and focused ultrasound pulses [22–24]. The feasibility of using histotripsy as a noninvasive, drug-free, and image-guided thrombolysis technique has been demonstrated previously. In vitro studies show that histotripsy can completely break down large clots (140–300 mg) within 5 min with no particles larger than 100 μm [25] and in vivo studies in a porcine deep vein thrombosis model, showed histotripsy therapy can re-establish blood flow and decrease thrombus burden. However, vascular damage was still observed in some treatments, as cavitation is not entirely confined in the vessel lumen and sometimes occurs in contact with vessel wall [26].
In our previous histotripsy thrombolysis studies [25, 26], a shock scattering mechanism was used to generate the cavitation bubble cloud, which employs multi-cycle pulses, often with the peak negative pressure below 20 MPa and the peak positive pressure above 50 MPa [27]. Individual sparse microbubbles are first formed and expanded in the initial 1–2 cycles. The high amplitude positive shock is scattered from these individual bubbles, and the inverted shockwave interferes with negative cycles in the incident wave, resulting in very high negative pressures and producing a layer of dense bubbles. Using the shock-scattering mechanism for thrombolysis, the initial bubbles are preferentially generated on the vessel walls where the weak nuclei tend to preside, potentially subjecting the vessel wall to high stress. In our in vivo study [26], no vessel penetration was observed, however, denudation of endothelium was found in isolated locations of the vein wall. Endothelial injury occurs with all interventional devices and is generally considered reversible, but damage to the vein valve may result in irreversible functional damage, leading to chronic venous insufficiency associated with severe morbidity [28].
To avoid cavitation damage to the vessel wall, we have recently discovered a new mechanism to initiate a cavitation cloud via a single pulse of <2 cycles with only one high negative pressure phase. When the peak negative pressure directly exceeds a distinctive “intrinsic threshold” for the medium (27 MPa for blood clots) [29, 30], a cavitation cloud is formed matching the volume exceeding the threshold. Using this intrinsic threshold mechanism and a very short acoustic pulse (< 2 cycles) to prevent shock-scattering, the volume of the histotripsy-induced cavitation cloud and lesion corresponded well to the volume of the focal regions above the intrinsic cavitation threshold. Because the supra-threshold portion of the negative half cycle can be precisely controlled, lesions considerably smaller than a wavelength are easily produced, hence the term Microtripsy [30].
We hypothesize that microtripsy can accurately generate and confine cavitation in the vessel lumen, without contacting the vessel wall, which results in accurate recanalization within the clot and potentially eliminating vessel damage. In this study, microtripsy thrombolysis experiments were conducted in an in vitro flow model of DVT. Microtripsy was used to generate the cavitation cloud within the clot formed inside a vessel-mimicking phantom. The cavitation cloud was scanned through the clot to create a flow channel to restore blood flow. Two different scan intervals (SI) and two different peak negative pressures (P-) of applied microtripsy pulses were used to create different flow channels. The goal of this study is to show the potential of using this new microtripsy thrombolysis method to avoid the contact of cavitation with the vessel wall and thus realize accurate and effective clot recanalization, meanwhile eliminating the risk of vessel damage.
Material and Methods
Flow Model
An in vitro flow model, similar to that described by Spengos et al [31], was developed to mimic the condition of occlusive deep vein thrombosis where no flow is present but pressure is still applied on the clot. As shown in Figure 1, the flow model consisted of a reservoir, a pressure sensor, a vessel phantom, a filter set, and a fluid collector. All the components were connected with silicone tubing (Masterflex L/S 17; Cole-Parmer, Vernon Hills, IL, USA). The reservoir stored saline for perfusion and was placed above the vessel phantom to apply a constant pressure of 3.7 mm Hg, which was measured by the pressure sensor (MG-9V; SSI Technologies, Janesville, WI, USA). The 3.7 mm Hg was chosen according to reported femoral vein pressure [32, 33]. The vessel phantom was placed horizontally and its inlet and outlet are at the same height. The upstream pressure measured by the sensor at the inlet side equaled the pressure drop across the clot in this model. When a channel was created through the clot by the microtripsy treatment, the flow was restored through the clot inside the vessel phantom due to the pressure applied. The restored flow of saline and clot debris particles from the treatment was then passed through a filter set, and the filtered saline was collected for further particle analysis of the remaining debris particles.
Figure 1.
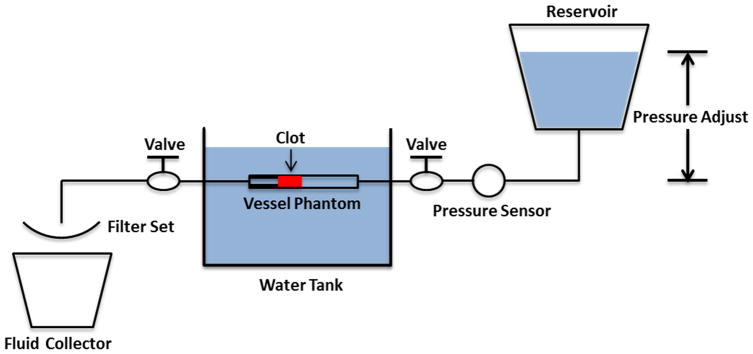
Schematic diagram of the flow model.
Vessel Phantom
The vessel phantom was developed to mimic a femoral vein in the leg (Figure 2). It was made from urethane polymer (Urethane RTV Mold-Making System; Tap Plastics Inc., San Leandro, CA, USA), which has a similar acoustic property to human tissue [34]. Urethane (liquid) was first degased to get rid of bubbles and then poured carefully into a mold similar to that described by Park et al [35]. After solidification of the urethane, it was removed from the mold. The final vessel phantom had a 6.5 mm inner diameter and an 8 mm outer diameter. The 6.5 mm inner diameter was chosen according to the reported DVT vein diameters (5 ~ 21.7 mm) [36]. On one side of the vessel phantom, the inner lumen was narrowed to 4.2 mm (35% stenosis) so that clot can be formed and stabilized by the stenosis to avoid slipping under pressure. The vessel phantom was held by a plastic frame with tube fittings at the two ends to connect the vessel lumen in-line with the rest of the flow model [35].
Figure 2.
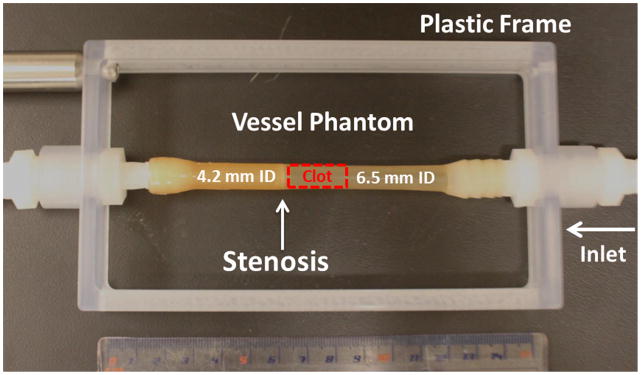
The vessel phantom is held by a plastic frame and connected in line with the flow model using tubing fittings. A 35% stenosis is located at the outlet side of the vessel phantom to fix the clot formed aside so that it does not slip under pressure. A clot is formed on the side of the stenosis as shown in the figure. (ID = Inner Diameter)
Clot Formation
Fresh bovine blood was collected from a local abattoir. Blood from 8 animals was used in this study. Before use, bovine blood was degassed to avoid formation of large stable gas bubble in the clot. A citrate-phosphate-dextrose (CPD) solution (#C7165; Sigma-Aldrich Co., St. Louis, MO, USA) was immediately mixed with bovine blood as an anti-coagulant at a ratio of 1 mL CPD per 9 mL blood. The blood sample was stored at 4°C and used within 72 hours. To stimulate the clotting cascade, calcium chloride (#21107; Sigma-Aldrich Co., St. Louis, MO, USA) was mixed with bovine blood to a final concentration of 20mM/L. To form clot inside the vessel phantom, the stimulated blood was poured into the vertically-placed vessel phantom with the stenosis sealed by a balloon catheter. After staying in 37 °C water bath for 2 hours, a clot with a length of 2 cm was matured and cross-linked with the vessel interior and stenosis. The balloon catheter was then removed and the vessel phantom was connected back into the flow model with the stenosis end of the clot distal to the pressure reservoir.
Microtripsy Thrombolysis System
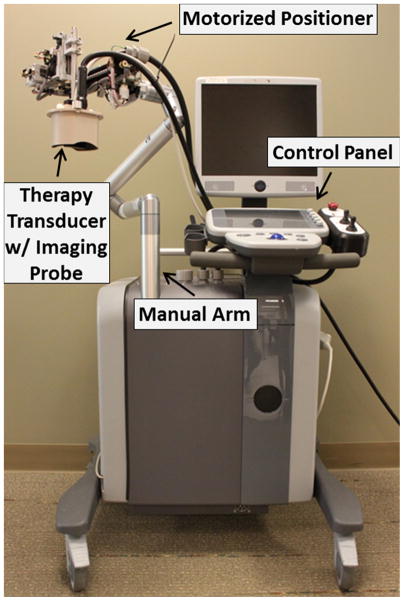
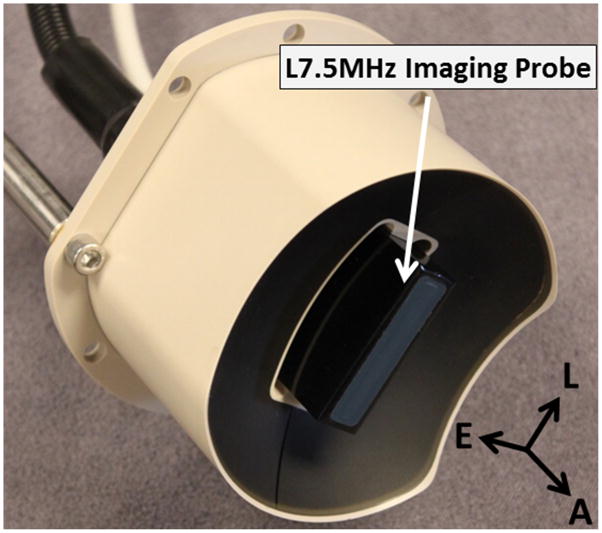
Thrombolysis treatment was conducted by an integrated image-guided microtripsy thrombolysis system (Figure 3) developed in our laboratory. The system integrated three sub-systems: therapy system, ultrasound imaging system and positioning system. A 1 MHz 18-element microtripsy thrombolysis transducer was designed in our laboratory based on the anatomy of DVT patients and manufactured by Imasonic (S.A., Besancon, France) (Figure 4). The transducer has an effective 9.8 cm (lateral) × 8 cm (elevational) aperture and a 7 cm focal distance. The focal beam volume (−6 dB) of the transducer was measured to be 6.5 mm (axial) × 1.3 mm (lateral) × 1.5 mm (elevational) at a peak negative pressure of 15 MPa using a fiber-optic probe hydrophone (FOPH) [37]. An ultrasound imaging probe with rectangular custom housing (L7.5MHz; Vermon, France) was inserted into the rectangular central hole of the transducer to guide and monitor microtripsy thrombolysis therapy. Ultrasound imaging was engined by SonixTouch® system (Analogic Ultrasound, Vancouver, Canada). The therapy transducer was mounted on a motorized 3-dimension micro-positioner, which had a range of 10 cm × 5 cm × 4 cm. A manual arm to which the micro-positioner was attached gave a range radius of about 1 meter for pre-treatment positioning. Control software was developed to manage and coordinate the therapy, imaging, and positioning systems.
Figure 3.
Integrated microtripsy thrombolysis system. It consists of an ultrasound imaging system, a microtripsy therapy system and a motorized positioning system.
Figure 4.
1 MHz 18-element microtripsy transducer with an ultrasound imaging probe at the center. With the imaging probe fixed in both lateral and elevational directions, the imaging plane is automatically aligned with the treatment focus of the therapy transducer. (A = Axial, L = Lateral, E = Elevational).
Treatments
Before treatment, the vessel phantom connected to the flow model was occluded by a clot formed inside. The vessel phantom with the clot was placed in a water tank filled with degassed water. The therapy transducer was placed above the vessel phantom facing down. The treatment focus was first calibrated by marking the hyperechoic cavitation region on the real-time ultrasound images. With the treatment focus aligned at the center of the vessel lumen, a treatment path from one end to the other end of the clot was determined by registering key position coordinates along the clot using the real-time ultrasound images and micro-positioner.
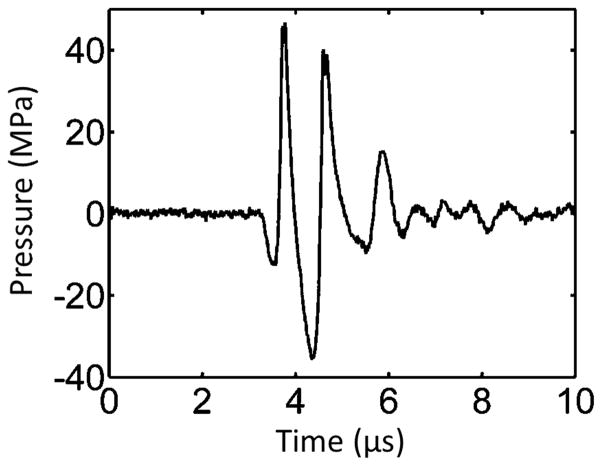
During treatment, the microtripsy thrombolysis system applied a fixed number of pulses at each location along the treatment path with a pulse repetition frequency (PRF) of 50 Hz. An example of microtripsy waveform is shown in Figure 5. The therapy transducer was moved with a pre-set interval to scan the treatment focus to next location along the path (Figure 6). Four groups of treatments were conducted using two scan intervals and two peak negative pressures (Table 1). Peak negative pressure larger than 20 MPa can’t be directly measured and therefore was estimated by linear summation (P(−)LS) of P- outputs from 6 separate groups of transducer elements (3 elements per group). According to the predication of treatment focal region using the area where the applied negative pressure exceeds the intrinsic threshold in the clot (27 MPa) [29, 30], peak negative pressures of 30 MPa and 36 MPa were chosen to give reasonable axial lengths of focal region to fit within the 6.5-mm vessel lumen. Scan intervals of 0.7 mm and 0.3 mm were chosen as the half and quarter of the mean elevational width of the predicted focal regions, respectively. To ensure complete clot homogenization for sufficient treatment, 1000 histotripsy pulses were applied per scan location for the treatment groups with 0.7 mm scan interval (SI0.7mm) and 300 pulses for the groups with 0.3 mm scan interval (SI0.3mm). Ultrasound video was taken throughout each treatment. The total treatment time to scan through a 2-cm clot was 10 min for SI of 0.7 mm and 7 min for SI of 0.3 mm.
Figure 5.
Pressure waveform of a microtripsy pulse. Since peak negative pressure larger than 20 MPa cannot be directly measured, this estimated waveform was linearly summed from the directly-measured waveforms of 6 separate element groups.
Figure 6.
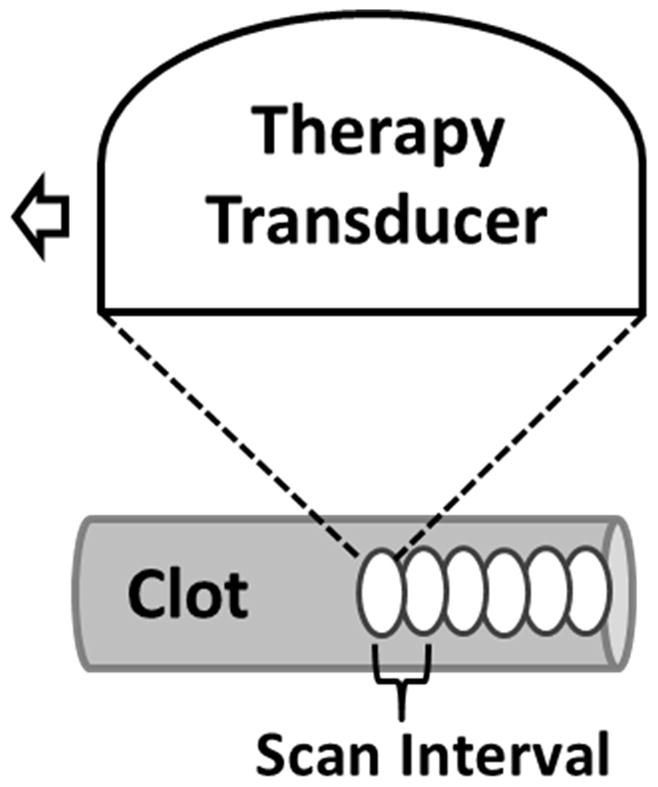
Schematic illustration of the treatment strategy. After a fixed number of microtripsy pulses are applied at one location along the treatment path, the therapy transducer is moved with a pre-set scan interval to the next location and repeats.
Table 1.
Treatment Plan
| Scan Interval | P(−)LS | Dose Per Location | Number of Treated Clots | |||
|---|---|---|---|---|---|---|
| Debris Analysis Method 1 | Debris Analysis Method 2 | Total | ||||
| Group A | 0.7 mm | 30 MPa | 1000 pulses | 6 | / | 6 |
| Group B | 0.7 mm | 36 MPa | 1000 pulses | 6 | / | 6 |
| Group C | 0.3 mm | 30 MPa | 300 pulses | 6 | 6 | 12 |
| Group D | 0.3 mm | 36 MPa | 300 pulses | 6 | 6 | 12 |
Cavitation
Cavitation generated by microtripsy was monitored with B-mode ultrasound imaging during the treatment. Since cavitation bubble could appears as a dynamic hyperechoic region on the ultrasound images, the intensity variance between the ultrasound images within the vessel lumen was used to quantify the cavitation region. Cavitation cloud size was quantified using the ultrasound video taken during the treatments with 0.3 mm SI. For each treatment, 1000 pairs of ultrasound images were randomly extracted from the video and an average cavitation region was generated. An ellipse was fitted into the cavitation region using a function provided by Matlab (MathWorks, Natick, MA, USA) to calculate its major and minor diameters.
Flow Channel Quantification
To quantitatively evaluate the flow channel generated through the clot by the microtripsy thrombolysis treatment, each treated clot was scanned using a 20MHz linear ultrasound image probe (Analogic Ultrasound, Vancouver, Canada). Mounted on the micro-positioner, the imaging probe was placed right above the vessel phantom and its imaging plane was aligned perpendicular to the central axis of the vessel phantom. High quality B-mode images of cross sections of each treated clot were captured every 0.3 mm along the vessel. Since the fractionated clot region was hypoechoic when the flow was restored, we applied a contrast threshold compared to surrounding intact clot to detect the cross section of the flow channel on ultrasound image. The cross area (Across) of the flow channel was calculated and an ellipse was fitted into the flow channel region using the same method as that for quantifying cavitation region to obtain its major and minor diameters (Dmajor and Dminor). The mean Across, Dmajor and Dminor over all valid scan images of each treated clot were used to characterize the generated channel. Diameter of circle (Dcircle) with equivalent area of Across and opening percentage (Popen = Dcircle/Dvessel) were also derived to assess potential clinical effectiveness.
Restored Flow Measurement
Restored flow rate is one critical index for clinical effectiveness of current thrombolysis treatments. In our in vitro treatments, restored flow rate was measured to evaluate microtripsy thrombolysis effectiveness. The flow channel creation was determined when fluid came out from the vessel phantom to the reservoir. After the first 150 mL of restored fluid was collected for debris analysis, the flow was turned off using a valve in line with the flow system. The system pressure was adjusted back to 3.7 mm Hg and a measuring beaker was placed under the downstream outlet. The flow was turned on again, and the saline through the treated clot was collected by the beaker for a period of 30 seconds. The restored volume flow rate was then calculated as the volume of the saline collected divided by the time. Owing to the brevity of the time period and the small change in reservoir volume, pressure was assumed to be constant over this time period. A control measurement with no blockage in the circulation system was also conducted to compare with restored flow rate.
Debris Particle Measurements
There is a concern that clot debris particles generated by microtripsy thrombolysis may embolise and occlude downstream vessels. To address this issue, two different methods were utilized to measure and analyze the debris particles. First, a filter weight and Coulter Counter combination method was adopted in 24 clot treatments (six per treatment group for all parameters). The restored flow of saline with suspended debris particles was serially filtered through three filters with pore sizes of 1000, 500 and 100 μm. The dry weight of each filter was measured prior to each treatment. After treatment, the filters were dried in room temperature over 48 hours and reweighed. Because of potential weight increase introduced by sodium chloride crystals formation on the filters, a control group (N = 10) was measured in the same way with only saline filtered through. The filtered, collected fluid with debris particles smaller than 100 μm were suspended in the fluid was analyzed using a Coulter Counter (Multisizer 3; Beckman Coulter, Brea, CA, USA). The measurable size range was 2–60 μm by using a 100-μm aperture tube [38]. Second, a microscopic inspection and Coulter Counter combination method was adopted in another 12 clot treatments (6 per treatment group with 0.3mm SI). Clot debris suspended in the restored flow was filtered by only one filter with a pore size of 300 μm. Macroscopic inspection was conducted to check if there was any debris particle trapped on the 300 μm filter. High-resolution optical images were taken of the filter paper before and after each treatment and the number of distinguishable particles was counted and recorded. The filtered, collected fluid debris particles through the 300 μm filter suspended in the fluid was analyzed using the Coulter Counter. The measurable size range was 2–300 μm by using two aperture tubes (100 μm and 560 μm).
Statistics
All statistical comparisons in this study were performed using a student’s t-test. P-values <0.01 were considered significant. Numerical data are expressed as mean ± standard deviation. Error bars on graphs represent standard deviation.
Results
Cavitation
For all experiments, cavitation was monitored by ultrasound imaging during the microtripsy thrombolysis treatment. The cavitation bubble cloud was clearly distinguished as a dynamic hyperechoic region on the B-mode images and presented an elliptical shape with its major axis along the ultrasound propagation direction. Using this 6.5-mm diameter vessel phantom, no cavitation was observed on either external or internal sides of the vessel walls during treatment. In the treatment groups with the low P(−)LS, the bubble cloud was well-confined and consistently maintained in the center of the vessel lumen without contact with the internal vessel wall (Figure 7a). In the treatment groups with the high P(−)LS, the bubble cloud was still well-confined but enlarged due to the increased P- (Figure 7b). Among all the treatments with the 30 MPa P(−)LS and 0.3 mm SI, the major and minor diameters of the cavitation region were estimated as 3.41 ± 0.54 mm and 1.95 ± 0.37 mm, respectively. And with the 36 MPa P(−)LS and 0.3 mm SI, the major and minor diameters of the cavitation region were estimated as 4.53 ± 0.65 mm and 2.12 ± 0.35 mm, respectively.
Figure 7.
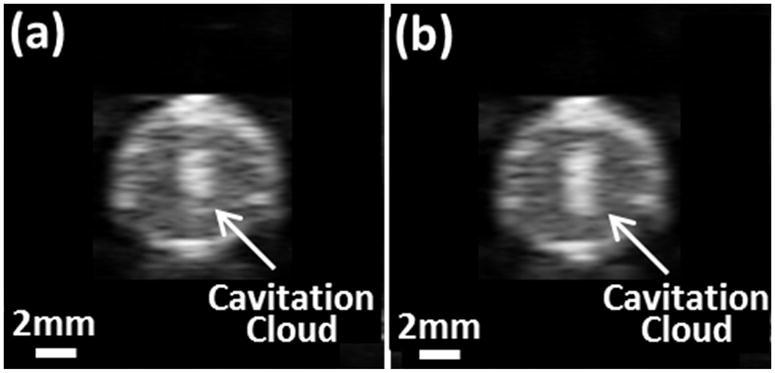
Cavitation bubble clouds during treatments. (a) Using 30 MPa P(−)LS. (b) Using 36 MPa P(−)LS. Ultrasound was propagated from the top to the bottom of the images.
Flow Channel
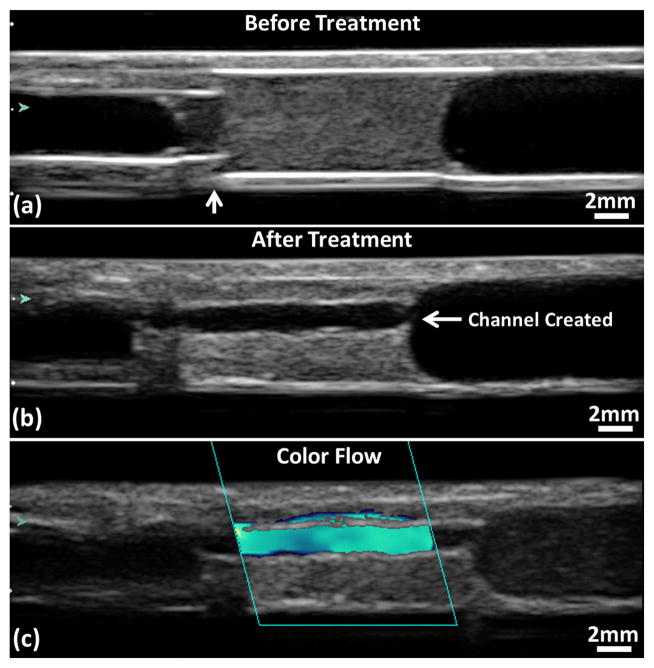
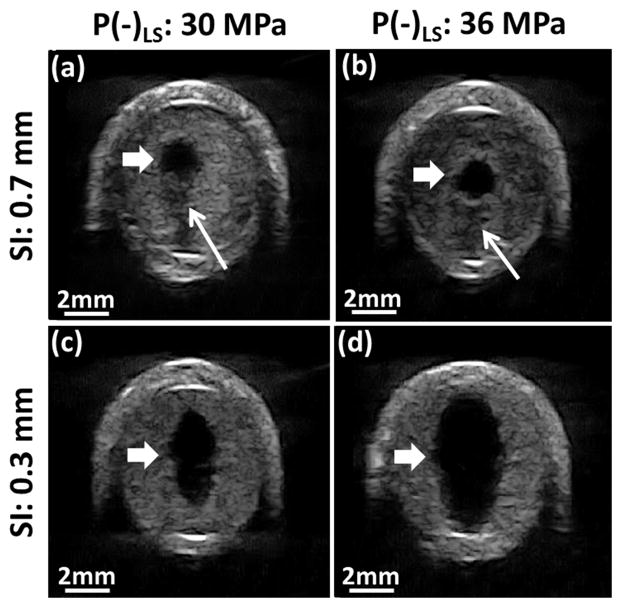
A flow channel was successfully generated through the clot after all microtripsy thrombolysis treatments (Figure 8). The channels were measured using the ultrasound images. Within each treatment, the flow channel was well confined inside the clots without contact with internal vessel wall. The cross sections of the generated flow channel at different scan positions across the clot were consistent. The boundaries of the channel from surrounding intact clots were sharp and clear. Representative cross-sectional images of flow channels generated were shown in Figure 9. For the treatment groups with the scan interval of 0.7 mm (SI0.7mm), the cross-sectional shape of the channels was closer to a circle, and there were small areas with reduced brightness (probably limited fractionation) on one side of the channel contour which corresponded to the tail of the bubble cloud. For the treatment groups with the scan interval of 0.3 mm (SI0.3mm), the cross-sectional shape of the channels was generally larger and more like an ellipse with its major axis along the ultrasound propagation direction (i.e. the axial direction of the therapy transducer). No area with reduced brightness near the channel contour was observed.
Figure 8.
Ultrasound images of a treated clot in the vessel phantom. (a) Before treatment. The vertical arrow shows where the stenosis is. (b) Flow channel presents after treatment. (c) Color flow presents after treatment. Glass beads (Part# 10089; TSI, Shoreview, MN, USA) were mixed in the perfusion saline after the treatment to obtain this color Doppler image. Flow is from the right to the left of the images.
Figure 9.
Representative ultrasound images of flow channel generated from the 4 treatment groups. The generated flow channels show as the hypoechoic zones inside clots (block arrow). Reduced echogenicity is found at one side of the flow channels with 0.7 mm SI (line arrow), where the tail of the cavitation cloud was. Ultrasound was propagated from the top to the bottom of the images.
Quantitative results characterizing the channel size in each treatment group are shown in Table 2. For easier comparison, cartoon illustrating the cross section of the generated channel inside of the vessel lumen in proportion to the actual sizes from Table 2 is also shown in Figure 10. Using the same P(−)LS, the mean Across of the flow channel generated with SI0.3mm was over three times larger than that generated with SI0.7mm. One-sided t-tests were performed between Group A and C (30 MPa P(−)LS), and Group B and D (36 MPa P(−)LS). Both showed significant increases of Across by reducing SI from 0.7 mm to 0.3 mm (both P < 0.0001). The mean equivalent opening Popen in the SI0.3mm groups was above 48%, which was about twice of that in the SI0.7mm groups. The ratio of Dminor to Dmajor for the SI0.7mm groups was over 67% whereas that for the SI0.3mm groups was approximately 50%. Within the groups using the same scan interval, the mean Across of the flow channel generated with 36 MPa P(−)LS was larger than that generated with 30 MPa P-. By applying one-sided t-test on Group C and D (0.3 mm SI), it showed the increase of Across with increased P(−)LS was also statistically significant (P < 0.0001). The ratio of Dminor to Dmajor stayed almost the same between the low P(−)LS and high P(−)LS groups. The biggest Dmajor (5.52 mm) was found in the group with 0.3 mm scan interval and high P(−)LS, whereas the smallest Dmajor (1.22 mm) was seen in the group with 0.7mm scan interval and low P(−)LS.
Table 2.
Quantifications of the flow channels (Mean ± Standard Deviation)
| SI | 0.7 mm | 0.3 mm | ||
|---|---|---|---|---|
|
| ||||
| P(−)LS | 30MPa | 36MPa | 30MPa | 36MPa |
| Across (mm2) | 1.79 ± 0.60 | 2.46 ± 0.93 | 6.33 ± 1.65 | 11.15 ± 1.22 |
| Dmajor (mm) | 1.85 ± 0.41 | 2.15 ± 0.51 | 4.04 ± 0.49 | 5.46 ± 0.36 |
| Dminor (mm) | 1.25 ± 0.16 | 1.50 ± 0.24 | 2.03 ± 0.32 | 2.77 ± 0.18 |
| Dcircle (mm)* | 1.51 ± 0.23 | 1.77 ± 0.30 | 2.84 ± 0.35 | 3.77 ± 0.20 |
| Popen** | 23 ± 3% | 27 ± 4% | 44 ± 5% | 58% ± 3% |
Dcircle is the diameter of circle has the same area as the cross-sectional area (Across) of flow channel.
Popen = Dcircle/Dvessel is the opening percentage of flow channel regarding to the 6.5 mm vessel lumen.
Figure 10.
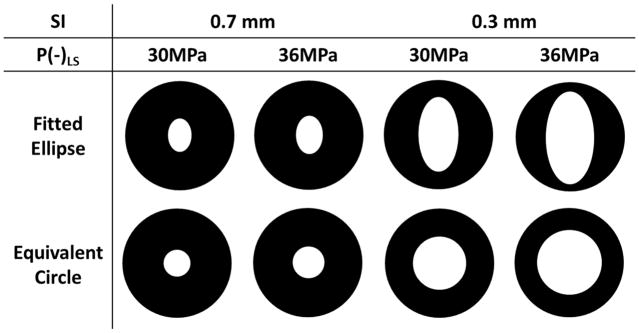
Cartoons illustrating the cross sections of the flow channels of the 4 treatment groups. Fitted ellipse is determined by Dmajor and Dminor from Table 2. Equivalent circle is determined by Dcircle from Table 2.
Restored Flow Rate
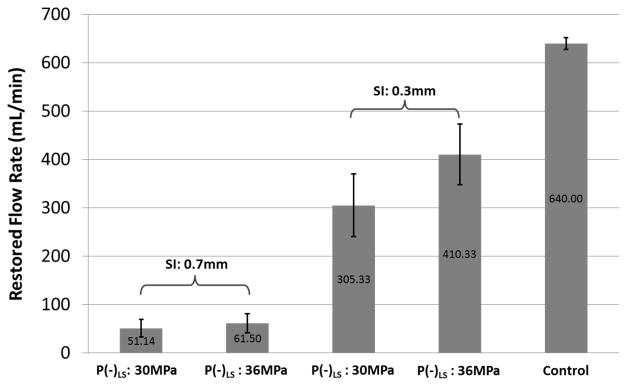
No flow was observed on Color Doppler and no fluid was collected by the fluid collector prior to any treatment. Flow was successfully restored after each microtripsy thrombolysis treatment. Representative color Doppler flow images are shown in Figure 8c. As expected, the path and the volume of the flow matched well with the generated channel. Flow rate was measured after each treatment (Figure 11). With a constant pressure, larger channel would be expected to permit higher flow rate, which is confirmed by these flow rate results. One-sided t-tests were performed to compare the restored flow rates between different treatment groups. For both P(−)LS used, significant flow rate increase (from about 50 mL/min to above 300 mL/min) was observed as the SI decreased (P < 0.0001). And with the SI of 0.3 mm, the flow increase from the low P(−)LS groups to the high P(−)LS groups was also statistically significant (P < 0.0001). The lowest flow rate was 30 mL/min in one of the treatments with 0.7 mm scan interval and low P(−)LS. The highest flow rate was 520 mL/min in one of the treatments with 0.3 mm scan interval and high P(−)LS. Within the SI0.3mm treatment groups, the lowest flow rate was 240mL/min. The flow model with no blockage had a maximal flow rate of 640 mL/min under the pressure of 3.7 mm Hg.
Figure 11.
Restored flow rates of the 4 treatment groups. Treatments associated with creation of larger cross-sectional area opening were associated with larger flow rates. The flow rates in the control group were measured under the same pressure as the treatment groups but without blockage in vessel phantom. For both P(−)LS used, statistical analysis (one-sided t-tests) showed significant flow rate increase as the SI decreased (P < 0.0001). And with the SI of 0.3 mm, the flow rate increase from the low P(−)LS groups to the high P(−)LS groups was also statistically significant (P < 0.0001).
Debris Particle Measurements
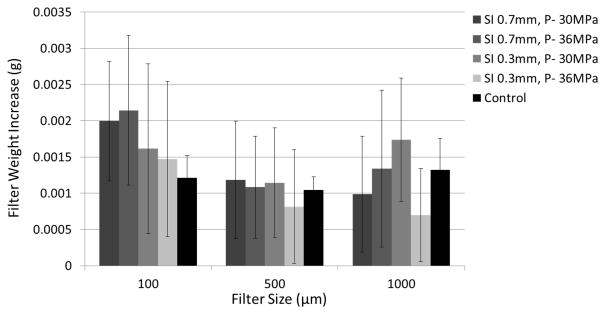
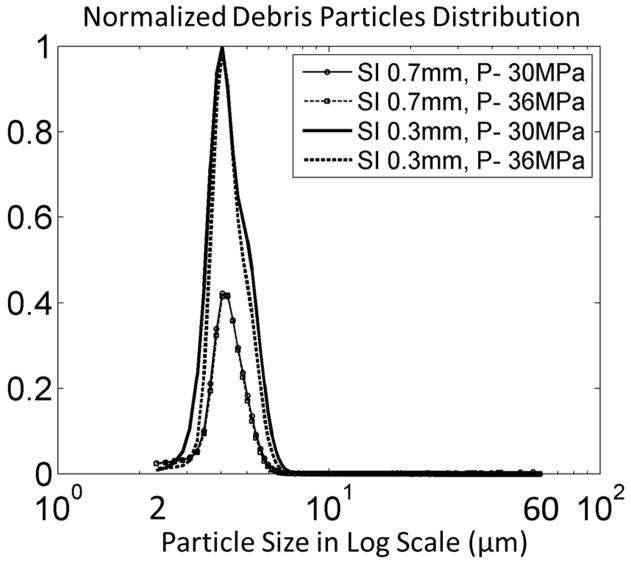
In the 24 treatments using the filter weight and Coulter Counter combination method, the mean weight change of each filter size in each treatment group was shown versus the control group in Figure 12. Over all the treatments and all the filter sizes, the filter’s dry weight increased by a mean of 1.4 mg with a standard deviation of 1.0 mg. For the control group, the filter’s dry weight changed by a mean of 1.1 mg with a standard deviation of 0.4 mg. T-test was performed between the control group and each treatment group for each filter size. No significant difference was found for any filter size between control and any of the treatment groups. Smaller debris particles (2 to 60 μm) suspended in the filtered fluid were analyzed using a Coulter Counter. Over all the treatments, over 99.9 % of the debris particles were smaller than 10 μm and centered around 4 μm. Normalized debris particle distribution ranging from 2 to 60 μm was plotted vs. debris particle size for each treatment group in Figure 13. The absolute number of debris particles increased over 2 times from the SI0.7mm group to SI0.3mm group but didn’t change much between the two P- groups.
Figure 12.
Filter weight increases after treatment.
Figure 13.
Debris particle distributions are normalized by the maximal value of the 4 treatment groups.
For the 12 treatments using the microscopic inspection and Coulter Counter combination method, no debris particle pieces ≥300 μm was observed by microscopic inspection on the filters of any treatment. Table 3 shows the number percentage of the debris particles ranging from 2 μm to 300 μm for each of the two treatment groups. Over 99.9 % of the debris particles were smaller than 10 μm, with the largest particle at 153 μm. The debris particles became orders of magnitude less as the size increased from 10 μm to 100 μm. The total number of debris particles ranging from 100 μm to 300 μm observed for each of the 12 treatments with the maximum debris size was listed in Table 4.
Table 3.
Number percentage of debris particles
| Debris Diameter(μm) | 2–10 | 10–30 | 30–60 | 60–100 | 100–300 | >300 |
|---|---|---|---|---|---|---|
| SI 0.3mm, P(−)LS 30MPa | 99.89% | 0.11% | <0.001% | <0.0001% | <0.0001% | None |
| SI 0.3mm, P(−)LS 36MPa | 99.96% | 0.04% | <0.001% | <0.0001% | <0.0001% | None |
Table 4.
Observed debris particles larger than 100 um
| Group | SI 0.3mm, P(−) LS 30MPa | SI 0.3mm, P(−)LS 36MPa | ||||||||||
|---|---|---|---|---|---|---|---|---|---|---|---|---|
|
| ||||||||||||
| Clot No. | 1 | 2 | 3 | 4 | 5 | 6 | 7 | 8 | 9 | 10 | 11 | 12 |
| No. of Particles | 1 | 0 | 0 | 0 | 0 | 2 | 0 | 6 | 3 | 0 | 2 | 0 |
| Max. Diameter (μm) | 114 | / | / | / | / | 132 | / | 139 | 153 | / | 116 | / |
Discussion
Cavitation
As expected, the cavitation bubble cloud was completely confined inside the targeted clot within the vessel lumen. No cavitation bubble cloud was in contact with the vessel wall on ultrasound imaging. Ultrasound images of cavitation bubble clouds in the vessel phantom, generated by shock scattering and intrinsic threshold mechanism respectively, are compared in Figure 14. By using microtripsy via a single-cycle length pulse, shocking scattering was limited to avoid bubble cloud elongation and unexpected cavitation on vessel wall surface. As cavitation by intrinsic threshold mechanism was less affected by surrounding interfaces, microtripsy may become a better option for thrombolysis application by avoiding any cavitation on surrounding vessel walls.
Figure 14.
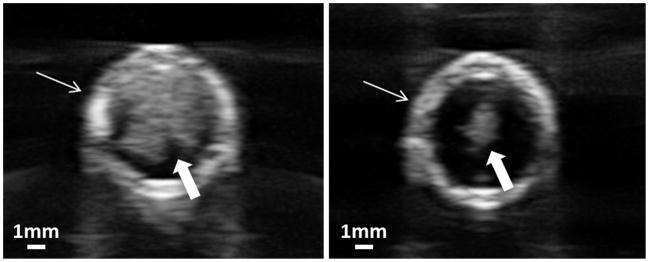
Cross-sectional ultrasound images of cavitation bubble clouds in the vessel phantom. The vessel phantom was filled with saline. Vessel wall is indicated by line arrow and bubble could is indicated by block arrow. Left: Using shock scattering mechanism (5-cycle pulses). Right: Using intrinsic threshold mechanism (microtripsy, 1-cycle pulse). The same peak negative pressure was applied in both cases.
Elimination of Vessel Damage
As shown previously [25], cavitation was strongly correlated with clot fractionation. So the well-confined cavitation within the vessel lumen resulted in accurate clot recanalization. On the high-resolution B-mode images, the generated channels were confined in the clots within the vessel lumen and showed clear boundaries from the surrounding intact clot. The intact clots attached to the vessel wall didn’t show any speckle reduction suggesting no clot fractionation, which confirmed that no cavitation occurred near vessel walls.
Accuracy of Cavitation Cloud Size Estimation
Caution must be paid before trusting the estimation of cavitation cloud size. First, the hyperechoic region visualized on the b-mode images may not be the original cavitation bubble cloud itself but the bubble nuclei after cavitation bubble collapse. It took more than 2ms to collect acoustic signals to form a b-mode image, whereas cavitation bubble collapses within several hundred microseconds. Second, since the bubble nuclei after collapse are dynamic, the size and shape of this hyperechoic region may change with the time delay and imaging parameters we used to look at it after each pulse. Third, with lesion developing during treatment, the change in both location and size of the hyperechoic region may also cause error in this averaging-based estimation.
Predictions of Flow Channel Sizes
Table 5 below lists the diameters of the flow channel, −6dB focal zone of the therapy transducer, supra-threshold estimations of focal region, and cavitation cloud diameters. The supra-threshold method estimates the treatment region by the area where the applied negative pressure exceeds the intrinsic threshold in the clot (27MPa) [29, 30]. Two-sided t-tests were performed to compare the diameters of flow channel with the other three categories. First, the flow channels generated by microtripsy were significantly smaller in the axial direction compared to the −6dB focal zone of the therapy transducer. Second, the supra-threshold estimations were statistically significantly different from the flow channel sizes. Compared to a better match between this supra-threshold estimation and the lesion size showed by Lin et al [30], the mismatch observed in this study was probably related to cavitation memory effect by using a much higher PRF (50 Hz) compared to 1 Hz used by Lin et al. As Wang et al [39] demonstrated that at the 50 Hz PRF, residual bubbles from previous pulses persisted and moved between pulses functioning as cavitation nuclei for subsequent pulses, which may effectively change the cavitation zone. Third, there is no significant difference between the major and minor diameters of cavitation cloud and those of flow channel in the 30 MPa P(−)LS case, suggesting that the cavitation zone visualized by B-mode ultrasound image could provide a good predication of the flow channel sizes. The B-mode visualization of the cavitation cloud in this study was not optimized. Further investigation will be conducted to optimize the imaging parameters and address the issues discussed in the last section so that this technique may be used to predict flow channel sizes accurately and reliably.
Table 5.
Comparisons among the diameters of the flow channel, −6dB focal zone of the therapy transducer, supra-threshold estimations of focal region, and cavitation cloud diameters.
| P(−)LS | Flow Channel Diameter | −6dB Focal Zone | Supra-threshold Estimation | Cavitation Cloud Diameter | |
|---|---|---|---|---|---|
| Major Diameter | 30 MPa | 4.04 ± 0.49 mm | 6.5 mm* | 3.70 mm* | 3.41 ± 0.54 mm° |
| 36 MPa | 5.46 ± 0.36 mm | 6.5 mm* | 5.30 mm* | 4.53 ± 0.65 mm* | |
|
| |||||
| Minor Diameter | 30 MPa | 2.03 ± 0.32 mm | 1.3 mm* | 1.10 mm* | 1.95 ± 0.37 mm° |
| 36 MPa | 2.77 ± 0.18 mm | 1.3 mm* | 1.45 mm* | 2.12 ± 0.35 mm* | |
Two-sided t-tests were performed to compare the diameters of flow channel with the other three. Superscript mark “ * “ indicates that this group is statistically significantly different from the flow channel diameter group. Superscript mark “ ° “ indicates there is no statistically significant difference between this group and the flow channel diameter group.
Channel Size Controls
It is clinically desirable to generate a sufficiently large channel to maximize the restored flow while minimizing the vessel damage. The capability of microtripsy to finely control the cavitation size by adjusting P- will potentially allow the formation of flow channel with different sizes for individual patients with different vein diameters, but still confined with the vessel lumen without damaging the vessel wall. In clinical situations the exact P- delivered at the target inside body can’t be directly measured. As the cavitation cloud can be directly seen on the real-time images using ultrasound imaging, the applied microtripsy P- can be adjusted to achieve a desired size of the cavitation cloud based on the imaging feedback while ensuring that the cavitation is well confined within the vessel lumen without contacting the vessel wall. This approach is supported by the match between the flow channel sizes and the cavitation cloud sizes measured by B-mode ultrasound image. As such the control of flow channel size may be realized via microtripsy in clinical situations.
Although increasing P- allows enlarging the diameters (Dmajor and Dminor) of channel, to avoid potential vessel damage the maximal Dmajor is limited by the inner diameter of vessel. As the single focal zone shape is elliptical with the short axis significantly smaller than diameter of the vessel lumen, the cross sectional area of the flow channel can also be increased by steering the focus along the short axis (laterally) to create multiple lesions within one cross sectional plane. Our transducer is capable of electrically steering the focus laterally within a few millimeters to further enlarge channel and improve effectiveness of recanalization. As microtripsy utilizes extremely short, single-cycle pulses with long waiting time, the focus can be electrically scanned to other locations between pulses, thus the lateral steering strategy to achieve a larger, more circular flow channel can be implemented without increasing treatment time.
Restored Flow Rate
With our current in vitro setting (6.5 mm diameter and 3.7 mm Hg pressure), the restored flow rate could reach up to 500 mL/min. Compared to the control flow rate (640 mL/min) where the same pressure was applied but no blockage presented in the flow system, our treatment restored up to 78 %. In clinical situations, the normal blood flow rate in femoral vein ranges from 268 mL/min to 721 mL/min [36, 40] assuming a mean velocity of 13.88 cm/s. Compared to these clinical data, our 500mL/min recanalization rate suggests the potential of microtripsy to significantly improve blood circulation after treatment of DVT.
Treatment Time Optimization
In this study the 2cm-long clots could be recanalized within 7 minutes. The treatment efficiency can be further improved with optimization of acoustic parameters. Three acoustic parameters can be optimized to improve the treatment efficiency, including peak negative pressure, dose of histotripsy pulses per location, and pulse repetition frequency. This study shows that the flow channel size and flow rate restored by microtripsy are higher with higher P-. The dose of 300 pulses per location used in this study was chosen empirically to ensure complete clot fractionation and is probably overdosed. As the clot properties can vary across patients and even an individual clot can be heterogeneous, we are investigating a new feedback method that can indicate the complete clot fractionation in real-time, which will allow us to adaptively apply the optimal dose at each treatment location during treatment [41, 42]. The treatment time can be further reduced by increasing the PRF, however higher PRF may increase the risk of heating the overlying tissue and lower treatment efficiency by introducing cavitation memory effect [39]. Further parameter study is warranted to identify the microtripsy parameter set that can rapidly and accurately create a desired flow channel through the clot without damaging the vessel wall or overheating the overlying tissue.
Comparison of Different Scan Intervals
The flow channel size also depends on the scan interval. There was noticeable difference of channel sizes and shapes between the treatment groups with the 0.7 mm and 0.3 mm scan intervals. The lesion volume at an individual focus generated by microtripsy is a raindrop shape with a main circular lesion and a smaller tail. The channels generated from the SI0.3mm group were larger and had elliptical shapes, which matched the volume and shape of the individual focal volume, while the channel generated in the SI0.7mm group was more circular with a smaller opening. This difference was because the 0.7 mm interval was larger than the size of the tail, resulting in incomplete fractionated clot at the tail-end between the lesions at adjacent locations and a smaller opening. When the scan interval was equal or smaller than the tail (i.e. the 0.3 mm interval), raindrop shaped channels with larger opening was generated. Although smaller scan interval will results in more treatment locations on the path, the dose per location can be accordingly reduced due to more overlapping volume. As shown in this study, the smaller scan interval (0.3 mm) with the reduced dose per location (300 pulses) produced a larger flow channel with a faster treatment time (7 min for SI0.3mm vs. 10 min for SI0.7mm).
Debris
Sonothrombolysis studies have not seen clot debris large enough to cause significant embolism. Although debris particles generated in previous histotripsy studies were no greater than 100 μm and also unlikely to cause hazardous emboli, we wanted to confirm the new microtripsy parameters would produce debris in line with that observed previously [25, 26]. We used two methods to measure the debris particle size distribution. Using the filter weight and Coulter Counter combination method, weight increases of the dried filters before and after recanalization treatments were observed, but no significant difference was found between these increases and those in the control group and no debris particles were directly visualized on any of the filters. The filter weight increase may be due to sodium chloride crystal dried from residual saline on the filter. Changes of environmental humidity and temperature may also play a role in increasing the filter weight. The macroscopic inspection and Coulter Counter method was also used to characterize debris particles, which was expected to be more sensitive and accurate than the filter weight method. Debris particles larger than 100 μm were uncommonly observed and the largest debris particle was only 153 μm. The results using this method are also supported by microscopic images of debris fluid smear [43](Figure 15). Most of the particles appear to be red blood cells (RBC) or RBC fragments and the larger particles were clusters of RBCs. Particles of this size range are unlikely to form hazardous emboli, as 100 μm mechanical filters have been successful at preventing embolization in catheter-based thrombolysis procedures [44].
Figure 15.
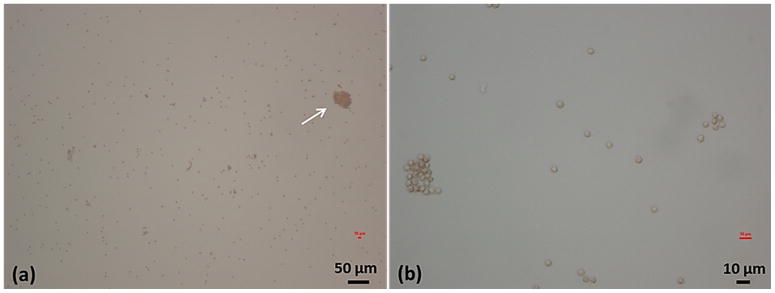
Example microscopic images of debris fluid smear from one treatment. (a) 10 times magnification. White arrow points to a large debris particle (~40 μm). (b) 40 times magnification. Most of individual particles are around 4 μm.
Conclusion
Histotripsy has been previously demonstrated to be a promising non-invasive and drug-free thrombolysis strategy with the advantages of fast treatment and real-time image guidance. However, histotripsy using conventional shock-scattering approach may generate cavitation on the vessel wall, leading to potential vessel damage. In this in vitro study, a new histotripsy approach, Microtripsy, was shown to precisely and consistently confine the cavitation within the vessel lumen, avoiding any contact with the vessel wall to prevent vessel damage. Microtripsy accurately generated flow channels inside the vessel phantom with 6.5-mm inner diameter, which is at the lower end of the reported DVT vein diameter range (Hertzberg et al. 1997). The flow channel created by microtripsy formed opening up to 60 % of the vessel lumen size and restored flow up to 500 mL/min. The 2cm-long clot was recanalized within 7 min and the generated channel could be enlarged by increasing the peak negative pressures of microtripsy pulses. The debris particles generated by microtripsy were measured with over 99.9% smaller than 10 μm and the largest particle at 153 μm, which are unlikely to form hazardous emboli. Future work will focus on optimizing acoustic parameters of microtripsy to further enhance treatment safety and efficiency.
Acknowledgments
This work is supported by grants from the National Institute of Biomedical Imaging and Bioengineering, under Award R01 EB008998.
References
- 1.Mozaffarian D, et al. Executive Summary: Heart Disease and Stroke Statistics—2015 Update A Report From the American Heart Association. Circulation. 2015;131:434–441. doi: 10.1161/CIR.0000000000000152. [DOI] [PubMed] [Google Scholar]
- 2.Adams HP, et al. Guidelines for thrombolytic therapy for acute stroke: a supplement to the guidelines for the management of patients with acute ischemic stroke a statement for healthcare professionals from a special writing group of the stroke council, American heart association. Circulation. 1996;94:1167–1174. doi: 10.1161/01.cir.94.5.1167. [DOI] [PubMed] [Google Scholar]
- 3.Bates SM, Ginsberg JS. Treatment of deep-vein thrombosis. New England Journal of Medicine. 2004;351:268–277. doi: 10.1056/NEJMcp031676. [DOI] [PubMed] [Google Scholar]
- 4.Friedman HS, et al. Tissue plasminogen activator for acute ischemic stroke. N Engl J Med. 1996;334:1405. doi: 10.1056/NEJM199605233342114. [DOI] [PubMed] [Google Scholar]
- 5.Kasirajan K, et al. Percutaneous AngioJet thrombectomy in the management of extensive deep venous thrombosis. Journal of Vascular and Interventional Radiology. 2001;12:179–185. doi: 10.1016/s1051-0443(07)61823-5. [DOI] [PubMed] [Google Scholar]
- 6.Kim HS, et al. Catheter-directed thrombolysis with percutaneous rheolytic thrombectomy versus thrombolysis alone in upper and lower extremity deep vein thrombosis. Cardiovascular and interventional radiology. 2006;29:1003–1007. doi: 10.1007/s00270-005-0341-4. [DOI] [PubMed] [Google Scholar]
- 7.Smith WS, et al. Safety and efficacy of mechanical embolectomy in acute ischemic stroke results of the MERCI trial. Stroke. 2005;36:1432–1438. doi: 10.1161/01.STR.0000171066.25248.1d. [DOI] [PubMed] [Google Scholar]
- 8.Smith WS, et al. Mechanical thrombectomy for acute ischemic stroke final results of the multi MERCI trial. Stroke. 2008;39:1205–1212. doi: 10.1161/STROKEAHA.107.497115. [DOI] [PubMed] [Google Scholar]
- 9.Pfaffenberger S, et al. 2MHz ultrasound enhances t-PA-mediated thrombolysis: comparison of continuous versus pulsed ultrasound and standing versus travelling acoustic waves. THROMBOSIS AND HAEMOSTASIS-STUTTGART. 2003;89:583–589. [PubMed] [Google Scholar]
- 10.Holland CK, et al. Ultrasound-enhanced tissue plasminogen activator thrombolysis in an in vitro porcine clot model. Thrombosis research. 2008;121:663–673. doi: 10.1016/j.thromres.2007.07.006. [DOI] [PMC free article] [PubMed] [Google Scholar]
- 11.Hitchcock KE, et al. Ultrasound-Enhanced rt-PA Thrombolysis in an ex vivo Porcine Carotid Artery Model. Ultrasound in medicine & biology. 2011;37:1240–1251. doi: 10.1016/j.ultrasmedbio.2011.05.011. [DOI] [PMC free article] [PubMed] [Google Scholar]
- 12.Larsson J, et al. Ultrasound enhanced thrombolysis in experimental retinal vein occlusion in the rabbit. British journal of ophthalmology. 1998;82:1438–1440. doi: 10.1136/bjo.82.12.1438. [DOI] [PMC free article] [PubMed] [Google Scholar]
- 13.Alexandrov AV, et al. Ultrasound-enhanced systemic thrombolysis for acute ischemic stroke. New England Journal of Medicine. 2004;351:2170–2178. doi: 10.1056/NEJMoa041175. [DOI] [PubMed] [Google Scholar]
- 14.Molina CA, et al. Transcranial ultrasound in clinical sonothrombolysis (TUCSON) trial. Annals of neurology. 2009;66:28–38. doi: 10.1002/ana.21723. [DOI] [PubMed] [Google Scholar]
- 15.Tsivgoulis G, et al. Safety and efficacy of ultrasound-enhanced thrombolysis a comprehensive review and meta-analysis of randomized and nonrandomized studies. Stroke. 2010;41:280–287. doi: 10.1161/STROKEAHA.109.563304. [DOI] [PubMed] [Google Scholar]
- 16.Datta S, et al. Ultrasound-Enhanced Thrombolysis Using DefinityR as a Cavitation Nucleation Agent. Ultrasound in medicine & biology. 2008;34:1421–1433. doi: 10.1016/j.ultrasmedbio.2008.01.016. [DOI] [PMC free article] [PubMed] [Google Scholar]
- 17.Brown AT, et al. Microbubbles improve sonothrombolysis in vitro and decrease hemorrhage in vivo in a rabbit stroke model. Investigative radiology. 2011;46 doi: 10.1097/RLI.0b013e318200757a. [DOI] [PMC free article] [PubMed] [Google Scholar]
- 18.Culp WC, et al. Successful microbubble sonothrombolysis without tissue-type plasminogen activator in a rabbit model of acute ischemic stroke. Stroke. 2011;42:2280–2285. doi: 10.1161/STROKEAHA.110.607150. [DOI] [PMC free article] [PubMed] [Google Scholar]
- 19.Rosenschein U, et al. Ultrasound Imaging–Guided Noninvasive Ultrasound Thrombolysis Preclinical Results. Circulation. 2000;102:238–245. doi: 10.1161/01.cir.102.2.238. [DOI] [PubMed] [Google Scholar]
- 20.Burgess A, et al. High-intensity focused ultrasound (HIFU) for dissolution of clots in a rabbit model of embolic stroke. PloS one. 2012;7:e42311. doi: 10.1371/journal.pone.0042311. [DOI] [PMC free article] [PubMed] [Google Scholar]
- 21.Wright C, et al. In vitro and in vivo high intensity focused ultrasound thrombolysis. Investigative radiology. 2012;47:217. doi: 10.1097/RLI.0b013e31823cc75c. [DOI] [PMC free article] [PubMed] [Google Scholar]
- 22.Xu Z, et al. Effects of acoustic parameters on bubble cloud dynamics in ultrasound tissue erosion (histotripsy) The Journal of the Acoustical Society of America. 2007;122:229–236. doi: 10.1121/1.2735110. [DOI] [PMC free article] [PubMed] [Google Scholar]
- 23.Xu Z, et al. Evolution of bubble clouds induced by pulsed cavitational ultrasound therapy-histotripsy. Ultrasonics, Ferroelectrics and Frequency Control, IEEE Transactions on. 2008;55:1122–1132. doi: 10.1109/TUFFC.2008.764. [DOI] [PubMed] [Google Scholar]
- 24.Xu Z, et al. Noninvasive creation of an atrial septal defect by histotripsy in a canine model. Circulation. 2010;121:742–749. doi: 10.1161/CIRCULATIONAHA.109.889071. [DOI] [PMC free article] [PubMed] [Google Scholar]
- 25.Maxwell AD, et al. Noninvasive thrombolysis using pulsed ultrasound cavitation therapy–histotripsy. Ultrasound in medicine & biology. 2009;35:1982–1994. doi: 10.1016/j.ultrasmedbio.2009.07.001. [DOI] [PMC free article] [PubMed] [Google Scholar]
- 26.Maxwell AD, et al. Noninvasive treatment of deep venous thrombosis using pulsed ultrasound cavitation therapy (histotripsy) in a porcine model. Journal of Vascular and Interventional Radiology. 2011;22:369–377. doi: 10.1016/j.jvir.2010.10.007. [DOI] [PMC free article] [PubMed] [Google Scholar]
- 27.Maxwell AD, et al. Cavitation clouds created by shock scattering from bubbles during histotripsy. The Journal of the Acoustical Society of America. 2011;130:1888–1898. doi: 10.1121/1.3625239. [DOI] [PMC free article] [PubMed] [Google Scholar]
- 28.Eberhardt RT, Raffetto JD. Chronic venous insufficiency. Circulation. 2005;111:2398–2409. doi: 10.1161/01.CIR.0000164199.72440.08. [DOI] [PubMed] [Google Scholar]
- 29.Maxwell AD, et al. Probability of cavitation for single ultrasound pulses applied to tissues and tissue-mimicking materials. Ultrasound in medicine & biology. 2013;39:449–465. doi: 10.1016/j.ultrasmedbio.2012.09.004. [DOI] [PMC free article] [PubMed] [Google Scholar]
- 30.Lin K-W, et al. Histotripsy beyond the “Intrinsic” Cavitation Threshold using Very Short Ultrasound Pulses: “Microtripsy”. IEEE transactions on ultrasonics, ferroelectrics, and frequency control. 2014;61:251. doi: 10.1109/TUFFC.2014.6722611. [DOI] [PMC free article] [PubMed] [Google Scholar]
- 31.Spengos K, et al. Acceleration of thrombolysis with ultrasound through the cranium in a flow model. Ultrasound in medicine & biology. 2000;26:889–895. doi: 10.1016/s0301-5629(00)00211-8. [DOI] [PubMed] [Google Scholar]
- 32.Albrechtsson U, et al. Femoral vein pressure measurements for evaluation of venous function in patients with postthrombotic iliac veins. Cardiovascular and interventional radiology. 1981;4:43–50. doi: 10.1007/BF02552407. [DOI] [PubMed] [Google Scholar]
- 33.Negus D, Cockett F. Femoral vein pressures in post-phlebitic iliac vein obstruction. British Journal of Surgery. 1967;54:522–525. doi: 10.1002/bjs.1800540605. [DOI] [PubMed] [Google Scholar]
- 34.Browne J, et al. Assessment of the acoustic properties of common tissue-mimicking test phantoms. Ultrasound in medicine & biology. 2003;29:1053–1060. doi: 10.1016/s0301-5629(03)00053-x. [DOI] [PubMed] [Google Scholar]
- 35.Park S, et al. Non-Invasive Embolus Trap Using Histotripsy—An Acoustic Parameter Study. Ultrasound in medicine & biology. 2013;39:611–619. doi: 10.1016/j.ultrasmedbio.2012.11.026. [DOI] [PMC free article] [PubMed] [Google Scholar]
- 36.Hertzberg B, et al. Sonographic assessment of lower limb vein diameters: implications for the diagnosis and characterization of deep venous thrombosis. AJR American journal of roentgenology. 1997;168:1253–1257. doi: 10.2214/ajr.168.5.9129422. [DOI] [PubMed] [Google Scholar]
- 37.Parsons JE, et al. Cost-effective assembly of a basic fiber-optic hydrophone for measurement of high-amplitude therapeutic ultrasound fields. The Journal of the Acoustical Society of America. 2006;119:1432–1440. doi: 10.1121/1.2166708. [DOI] [PubMed] [Google Scholar]
- 38.Coulter B. Coulter Counter Multisizer 3 User’s Manual. 2000. Hialeah, FL. [Google Scholar]
- 39.Wang TY, et al. An efficient treatment strategy for histotripsy by removing cavitation memory. Ultrasound in medicine & biology. 2012;38:753–766. doi: 10.1016/j.ultrasmedbio.2012.01.013. [DOI] [PMC free article] [PubMed] [Google Scholar]
- 40.Fronek A, et al. Common femoral vein dimensions and hemodynamics including Valsalva response as a function of sex, age, and ethnicity in a population study. Journal of vascular surgery. 2001;33:1050–1056. doi: 10.1067/mva.2001.113496. [DOI] [PubMed] [Google Scholar]
- 41.Miller RM, et al. Investigation of the mechanism of ARFI-based Color Doppler feedback of histotripsy tissue fractionation. Ultrasonics Symposium (IUS), 2013 IEEE International; 2013; pp. 934–937. [Google Scholar]
- 42.Zhang X, et al. Real-Time Feedback of Histotripsy Thrombolysis Using Bubble-Induced Color Doppler. Ultrasound in medicine & biology. 2015 doi: 10.1016/j.ultrasmedbio.2014.12.006. [DOI] [PMC free article] [PubMed] [Google Scholar]
- 43.Ross MH, et al. Histology: a text and atlas with cell and molecular biology. 2003 [Google Scholar]
- 44.Eskandari MK. Cerebral embolic protection. Seminars in vascular surgery. 2005:95–100. doi: 10.1053/j.semvascsurg.2005.04.006. [DOI] [PubMed] [Google Scholar]


