

Abstract
Although numerous data suggest that glutamate (GLU) is involved in mediating the neural effects of nicotine, direct data on nicotine-induced changes in GLU release are still lacking. Here we used high-speed amperometry with enzyme-based GLU and enzyme-free GLU-null biosensors to examine changes in extracellular GLU levels in the ventral tegmental area (VTA) and nucleus accumbens shell (NAcc) induced by intravenous nicotine in a low, behaviorally active dose (30 μg/kg) in freely moving rats. Using this approach, we found that the initial nicotine injection in drug-naive conditions induces rapid, transient, and relatively small GLU release (~90 nM; latency ~15 s, duration ~60 s) that is correlative in the VTA and NAcc. Following subsequent nicotine injections within the same session, this phasic GLU release was supplemented by stronger tonic increases in GLU levels (100–300 nM) that paralleled increases in drug-induced locomotor activation. GLU responses induced by repeated nicotine injections were more phasic and stronger in the NAcc than in VTA. Therefore, GLU is phasically released within the brain’s reinforcement circuit following intravenous nicotine administration. Robust enhancement of nicotine-induced GLU responses following repeated injections suggests this change as an important mediator of sensitized behavioral and neural effects of nicotine.
Keywords: electrochemistry, enzyme-based glutamate biosensors, glutamate release, experience-dependent neuroplasticity of glutamate neurotransmission
Introduction
It is generally believed that nicotine’s reinforcing properties are related to its abilities to release dopamine (DA) in the nucleus accumbens (NAcc) and other limbic structures, and are associated with an increase in locomotion (Clarke, 1990; Di Chiara, 2000; Dani et al., 2011). Both these effects are enhanced (sensitized) following repeated drug exposure (Balfour et al., 1998; Mao and McGehee, 2010). Although nicotine can excite ventral tegmental area (VTA) DA neurons and increase terminal DA release by directly acting on α4β2 nicotinic receptors on DA cells (Keath et al., 2007; Liu et al., 2012; Matsubayashi et al., 2003), the same effect could also occur indirectly via modulation of glutamate (GLU) or GABA inputs to VTA DA cells and their terminals in target areas. This modulation could be especially important when nicotine is used at low doses, where it initially acts at high concentrations on afferents of sensory nerves at the administration sites (lung alveoli, oro-nasal cavity, blood vessels; Anand, 1996; Juan, 1982; Ginzel, 1975; Liu and Simon, 1996) before dilution into the bloodstream. Due to this peripheral action, nicotine administration produces an ascending neural signal that rapidly reaches the CNS via visceral sensory pathways (Engberg and Hajos, 1994; Erhardt et al., 2002; Lenoir and Kiyatkin, 2011) before the drug directly interacts with central neurons (Berridge et al., 2010; Rose et al., 2010).
The second-scale latencies of EEG desynchronization induced by intravenous (iv) nicotine and its attenuation by hexamethonium (Lenoir and Kiyatkin, 2011), a blocker of peripheral nicotinic receptors, are consistent with the peripheral triggering of nicotine-induced neural activation, but the neurochemical basis of this action remains unclear. However, a large body of evidence suggests GLU as a possible mediator of nicotine’s excitatory effects and its stimulatory action on mesocorticolimbic DA transmission. Intra-VTA injections of GLU antagonists strongly attenuate several important effects of nicotine, including locomotor activation (Kelsey et al., 2002), self-administration (Kenny et al., 2009; D’Souza and Markou, 2011), DA cell excitation (Erhardt et al., 2002; Svensson et al., 1998), NAcc DA release (Fu et al., 2000; Sziraki et al., 2002), and drug-induced reinstatement of lever pressing (Bespalov et al., 2005). While nicotine-induced increases in extracellular GLU levels have been reported in microdialysis studies (Fu et al., 2000), the low temporal resolution of this technique limits examination of rapid GLU fluctuations induced by nicotine in awake animals.
Whereas microdialysis directly samples the content of the extracellular space at a slow, minute scale, electrochemistry allows second-scale sampling, a critical advantage for detecting rapid fluctuations in extracellular GLU levels. Here we used enzyme-based GLU-selective biosensors coupled with high-speed amperometry to examine rapid changes in extracellular GLU induced by iv nicotine at a low, self-administering dose (30 μg/kg) in freely moving rats. Electrochemical measurements were conducted in the NAcc and VTA, two primary interrelated structures of the mesocorticolimbic motivation-reinforcement circuit (Wise and Bozarth, 1987). Since the locomotor-activating effects of nicotine are rapidly enhanced or sensitized following repeated exposure (Clarke, 1990; Domino, 2001; Mao and McGehee, 2010; Vezina et al., 2007), we also examined how nicotine-induced GLU responses change during repeated drug injections and how these neurochemical changes are related to changes in locomotion.
Materials and Methods
Subjects and surgical preparations
21 male Long-Evans rats (Charles River Laboratories, Raleigh, NC) weighing 440±40 g at the time of surgery were used in this study. Rats were individually housed in a climate-controlled vivarium maintained on a 12–12 light-dark cycle (lights on at 8:00 AM), with food and water available ad libitum. All procedures were approved by the NIDA-IRP Animal Care and Use Committee and complied with the Guide for the Care and Use of Laboratory Animals (NIH, Publication 865–23) and UK ARRIVE guidelines.
Each rat was implanted with a BASi cannula (Bioanalytical Systems, West Lafayette, IN) for future insertions of the electrochemical sensor in either the NAcc shell or VTA under general anesthesia (Equithesin 0.33 ml/100 g; active ingredients: sodium pentobarbital, 32.5 mg/kg and chloral hydrate, 145 mg/kg). Target coordinates were: for NAcc shell: − AP +1.2 mm, ML ±0.8 mm and DV +7.6 mm; and for VTA: AP −5.5 mm, ML ±2.0 mm and DV +8.4 mm (with a 10° angle), according to coordinates of Paxinos and Watson (1998). The guide cannulae were fixed in place with dental acrylic and secured to the skull by three stainless steel bone screws. During the same surgery, each rat was also implanted with a jugular venous catheter, which was fed subcutaneously to the head mount and secured to the head assembly. Rats were allowed a minimum of 5 days of post-operative recovery; jugular catheters were flushed daily with 0.2 ml sterile saline.
In vitro calibration and testing of electrochemical sensors
We used glutamate oxidase-based GLU sensors and enzyme-free, GLU-null sensors (Pinnacle Technology, Lawrence, KS) prepared from platinum-iridium wire (180 μm diameter), with a sensing cavity of ~ 1 mm length on its tip and an Ag/AgCl reference electrode incorporated with the active electrode. On the active surface of GLU sensors, glutamate oxidase converts GLU to α-ketoglutarate and H2O2, which is detected as an amperometric oxidation current generated by a +0.6 V applied potential (Hu et al., 1994). The contribution of ascorbic acid to the measured current is competitively reduced by co-localizing ascorbic acid oxidase on the sensor’s active surface that converts ascorbic acid to non-electroactive dehydroascorbate and water. A negatively charged Nafion polymer layer further helps to exclude the contribution anionic compounds.
Despite the relatively high selectivity of GLU sensors in vitro, electrochemical currents generated by these sensors in vivo are affected by various non-specific physical and chemical factors (Wakabayashi and Kiyatkin, 2012; Kiyatkin et al., 2013). To exclude these contributions, we used GLU-null sensors of identical construction but lacking glutamate oxidase. These sensors are exposed in vivo to the same physical and chemical milieu as GLU sensors but are fully insensitive to GLU. Therefore, the difference between currents detected by GLU and GLU-null sensors under identical conditions provides the best possible method for evaluating true extracellular GLU levels and their fluctuations. Electrochemical recordings with GLU and GLU-null sensors were conducted in the same brain locations (either NAcc or VTA), but in different animals because, as shown previously (Wakabayashi and Kiyatkin, 2012), two simultaneously active sensors create electrical cross-talk during in vivo recording, thus affecting measurement accuracy of each sensor. Currents from each sensor were passed to a computer via a potentiostat (Model 3104, Pinnacle Technology), and electrochemical data were sampled at 1 Hz (mean current over 1 s) using PAL software (Version 1.5.0, Pinnacle Technology).
Immediately before and after each in vivo experiment, GLU and GLU-null sensors were calibrated in vitro. These calibrations were conducted in phosphate-buffered saline (PBS) by incrementally increasing the concentration of GLU from 0 to 2, 4, and 6 μM followed by a single addition of ascorbate (250 μM). Since the current response to GLU directly depends upon temperature (Wakabayashi and Kiyatkin, 2012), all sensitivities were corrected for 37°C (+84%). Although GLU sensors used in this study (n=14) varied slightly in their in vitro GLU sensitivity (mean 0.46±0.03 nA/1 μM), all produced incremental, highly linear (r=0.99) increases in current with increases in [Glu] and showed current increases with addition of ascorbate (mean 1.32±0.10 nA/250 μM); their average ascorbate:GLU selectivity ratio was 1:82. Post-recording calibrations of GLU sensors revealed an approximately two-fold decrease in GLU sensitivity (0.20±0.04 nA/1 μM) consistent with other studies using sensors of similar design (Naylor et al., 2011). As expected, GLU-null sensors (n=9) were fully insensitive to GLU, but showed current responses to ascorbate that were slightly smaller than those in GLU sensors during pre-recording in vitro calibration but remained virtually unchanged after in vivo recordings. GLU and GLU-null sensors are equally temperature-sensitive and show similar dynamics of current changes following long-term in vitro recording (Wakabayashi and Kiyatkin, 2012), thus allowing to exclude two major non-specific contributions to GLU currents: drug-induced brain temperature fluctuation and consistent downward drift in electrochemical baseline typical of any long-term electrochemical recording (Kiyatkin et al., 2013). Additional methodological aspects of this technique are considered in more detail in Supplementary Materials and Methods.
Experimental protocol
All behavioral procedures occurred in an electrically insulated chamber (38x47x47 cm) located in a larger cabinet, under dim white illumination; a room-wide air fan provided background white noise. The chamber was equipped with four infrared motion detectors (Med Associates, Burlington, VT) to monitor locomotor activity. Prior to recording sessions, rats were habituated to the testing environment for a minimum of 6 hrs per day for 3 consecutive days.
Each animal was exposed to one recording session (~8 hrs). At the beginning of each session, rats were minimally anesthetized (<2 min) with isoflurane and a calibrated sensor (either GLU or GLU-null) was inserted into the brain through the guide cannula. The rat was placed into the testing chamber and the sensor was connected to the potentiostat via an electrically shielded cable and an electrical swivel. The catheter injection port on the head mount was connected to a plastic catheter extension, which passed through a liquid swivel to outside the recording chamber, thus allowing stress-free drug delivery. Testing began a minimum of 135 min after insertion of the sensor when baseline currents had relatively stabilized. During the session, each rat received three iv injections of nicotine (hydrogen tartrate; 30 μg/kg in 0.2 ml saline over 20 s) delivered under quiet resting conditions with ~120-min inter-injection intervals. Although low relative to body weight, this dose of nicotine is optimal for maintaining self-administration behavior in rats (Cox et al., 1984; Donny et al., 1995) and comparable to that delivered during smoking of one to two cigarettes in humans (Berridge et al., 2010; Rose and Corrigall, 1997; Rose et al., 2010). At this dose, nicotine induces rapid EEG desynchronization and EMG activation coupled with moderate increases in locomotion (Lenoir and Kiyatkin, 2011) as well as significant changes in brain, muscle and skin temperatures (Tang and Kiyatkin, 2011). Iv administration provides very large but transient spike in nicotine levels within blood vessels. After injection, the concentration of nicotine is highest at the administration site (where nicotine-sensitive afferents of sensory nerves are located), quickly falls to 75–150 ng/ml as the drug is distributed by the cardio-vascular system to the brain and peripheral organs, and is 10–15-fold lower (5–10 ng/ml) at 60 min post-injection (Sastry et al., 1995; Turner, 1969). Using autoradiography with [14C]nicotine in mice, it was shown that brain nicotine levels are maximal (~13% of the injected dose) at 1–2 min after iv injection but fall rapidly below 1% at 60 min post-injection (Stalhandske, 1970). As shown previously (Tang and Kiyatkin, 2011; Lenoir and Kiyatkin, 2011; Lenoir et al., 2013), electrophysiological, temperature and behavioral effects of nicotine at this dose are usually within 20–40 min in duration, with return to pre-injection baseline thereafter. Considering these dynamics, we thus expect a near-to-total nicotine clearance from the blood 120 min after iv injection at a 30 μg/kg dose, when the subsequent injection was performed.
At the end of each session, rats were anesthetized (Equithesin; 0.7–1.0 ml iv) and biosensors were removed for post-recording calibration. The rats were transcardially perfused with PBS followed by 10% formalin and brains were extracted for subsequent verification of sensor placement on 45 μm brain slices using the stereotaxic atlas of Paxinos and Watson (1998). Electrochemical data were accepted only if the sensor tips were localized in either the NAcc shell or VTA.
Data analysis
Data analysis was based on comparisons of currents detected by GLU and enzyme-free GLU-null sensors. Using this approach, we first determined basal [GLU] in each structure by subtracting basal currents detected by GLU-null sensors from currents detected by GLU sensors (Fig. S1). Second, we compared changes in electrochemical currents detected by GLU and GLU-null sensors after each nicotine injection. This analysis was conducted at two temporal resolutions: slow current changes were analyzed with 1-min bins from 5 min before to 60 min after each injection, and rapid current changes were analyzed with 4-s bins from 30 s before to 300 s after each injection (Fig. S1). The 4-s time resolution is optimal for detecting rapid changes in electrochemical currents while simultaneously reducing the contribution of background noise. Since the baseline currents slightly varied in amplitude between individual electrodes, the absolute drug-induced current changes were transformed into relative changes, taking a basal value as 0 nA. To reveal the GLU contribution, we calculated current differentials as changes generated by GLU sensors minus those generated by GLU-null sensors. These data were calibrated in nM concentrations based on in vitro sensor sensitivity adjusted by the known temperature coefficient.
Two-way repeated-measures (RM) ANOVA was used for evaluating differences in nicotine-induced current dynamics produced by GLU and GLU-null sensors. When a significant current x time interaction was found, between-group current differences (shown as GLU concentration) were evaluated using Fisher’s PLSD test. Correlative and regression analyses were used to examine between-structure [GLU] dynamics. Locomotor data were collected as the number of photobeam breaks per 10 s and analyzed in 1-min bins using one-way RM ANOVA followed by Fisher’s PLSD test. Data are represented as mean±SEM; the minimal level of significant difference was set as p<0.05. Student’s t-test was used for comparing mean basal currents detected by GLU and GLU-null sensors.
Results
Basal glutamate levels
The difference between electrochemical currents recorded by GLU and GLU-null sensors from the same structure under the same conditions should provide the best possible measure of basal GLU extracellular concentrations. Although baseline currents detected by both GLU and GLU-null sensors decreased during the session (Fig. S1 and 1), they differed significantly from each other in both structures at each time point, with consistently larger between-sensor current differences in the NAcc than the VTA. By transferring these current differences into concentration values, we found that mean basal levels of extracellular GLU are 1.70±0.25 μM in the NAcc and ~2–3-fold lower in the VTA (0.67±0.10 μM, p<0.001). These basal levels remained similar in each structure during long-term in vivo recording (compare mean values at each time point, Fig. 1).
Figure 1.
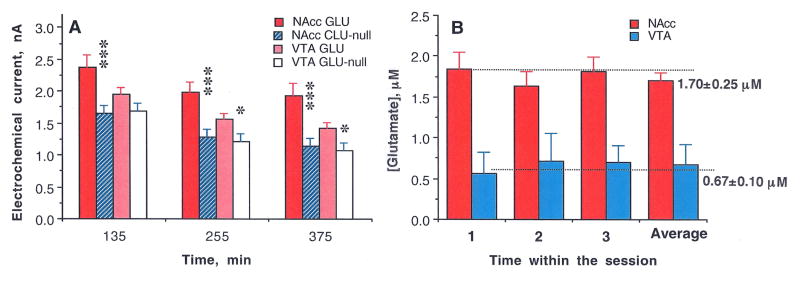
(A) Mean (±SEM) values of basal electrochemical currents recorded by GLU and GLU-null sensors in the NAcc and VTA at three time points (from the moment of sensor insertion in the brain) before each consecutive nicotine injection. In each case, the mean value for GLU sensors was larger than the corresponding value for GLU-null sensors (*, p<0.05; ** and ***, p<0.001; Student’s t-test) and the current values detected by GLU sensors in the VTA were consistently lower than those in the NAcc. By subtracting these values and converting them to concentrations (B) we found that basal levels of GLU in the NAcc are significantly larger than those in the VTA. Importantly, despite the decreases in absolute values of currents detected during the course of the experiment, the difference between GLU and GLU-null sensors that reflects [GLU] remained relatively stable during the entire experiment.
Nicotine-induced GLU responses
Slow-resolution analysis of electrochemical currents recorded by GLU and GLU-null sensors following the first nicotine injection of a session revealed no significant between-group Current x Time interaction (Fig. 2A and B), suggesting no change in [GLU] in either NAcc or VTA. In each structure, electrochemical currents detected by both sensors decreased similarly after nicotine injection and their difference revealed only a small, transient increase during the first minute post-injection, which was significant in NAcc but not VTA (Fig. 2C; p<0.05 and p=0.11, respectively). However, rapid time-scale analysis (Fig. 2D and E) revealed significant Current x Time interactions for the first 44 and 36 s after the injection onset in both NAcc and VTA (F12,120=1.93 and F10,90=2.08; p<0.05; see asterisks in Fig. 2D and E). In each case, [GLU] began to increase during the nicotine injection, peaked at ~40 s (80–90 nM), and decreased toward baseline at 60–80 s (Fig. 2F). The time-course and magnitude of [GLU] increase were similar in both structures, showing a significant correlation within 10–60 s from the injection start (r=0.69; p<0.01). Consistent with previous observations (Wakabayashi and Kiyatkin, 2012) and tests conducted in this study (2 rats; 12 injections), saline injections did not affect electrochemical currents recorded by GLU sensors (Fig. S2).
Figure 2.

Changes in electrochemical currents detected in the NAcc and the VTA by GLU and GLU-null sensors following the initial iv nicotine injection in drug-naive rats. Left panel (A–C) shows changes analyzed with slow time-course resolution (5 min before to 60 min after the injection, 1-min quantification bins). Right panel (D–F) shows changes analyzed with rapid time-course resolution (60 s before to 300 s after the start of iv injection, 4-s quantification bins). Top graphs (A, D) show changes (mean±SEM) detected in the NAcc; middle graphs (B, E) show changes (mean±SEM) detected in the VTA; and bottom graphs (C, F) show between-sensor current differences in both structures calibrated in nM of GLU, based on pre-recording sensor sensitivity. Bold horizontal lines with asterisks in D and E mark the time of a significant Current x Time interaction; filled symbols in F show values significantly different from baseline (p<0.05).
A similar analysis applied to the second nicotine injection revealed larger differences between currents detected by GLU and GLU-null sensors (Fig. 3A and B). The Current x Time interaction was significant in both structures (NAcc: F3,27= 3.51 and VTA: F2,16=5.00 for 3 and 2 min post-injection, respectively; p<0.05), suggesting a significant increase in [GLU] (Fig. 3C). In both structures, GLU levels rapidly rose during the first minute after injection onset and maintained elevated for ~20 min post-injection. While GLU levels in the VTA returned to baseline within 40 min, they remained at higher levels in the NAcc for up to 60 min. Changes detected by GLU sensors in the NAcc were more variable than in the VTA (see SEMs in Fig. 3A and B).
Figure 3.

Changes in electrochemical currents detected in the NAcc and the VTA by GLU and GLU-null sensors following the second iv nicotine injection. Left panel (A–C) shows changes analyzed with slow time-course resolution (5 min before to 60 min after the injection, 1-min quantification bins). Right panel (D–F) shows changes analyzed with rapid time-course resolution (60 s before to 300 s after the start of iv injection, 4-s quantification bins). Top graphs (A, D) show changes (mean±SEM) detected in the NAcc; middle graphs (B, E) show changes (mean±SEM) detected in the VTA; and bottom graphs (C, F) show between-sensor current differences in the NAcc and VTA calibrated in nM of GLU based on pre-recording sensor sensitivity. Bold horizontal lines with asterisks mark the time of significant Current x Time interaction, filled symbols in C and F shows values significantly different from baseline (p<0.05).
The pattern of the GLU response to the second injection was seen more clearly when data were analyzed at high temporal resolution (Fig. 3D–F). In this case, the Current x Time interactions were significant in both structures for a longer duration (NAcc: F37,296=1.46 for 144 s and VTA: F26,208=1.57 for 100 s post-injection; p<0.05). GLU levels in both structures increased rapidly during nicotine injection, peaked at 30–60 s, and maintained at increased levels for the next 5 min. Despite a similar time-course, the GLU increase appeared stronger and more prolonged in the NAcc than the VTA. As with the first injection, changes in GLU levels after the second nicotine injection were correlative in the NAcc and VTA (r=0.60, p<0.01 for the first 100 s).
GLU differences increased even further the third nicotine injection (Fig. 4). In this case, Current x Time interactions were significant in both structures for slow-scale (NAcc: F21,168= 1.77 and VTA: F60,540=3.17 for 21 and 60 min, respectively) and rapid-scale (NAcc: F76,608=2.50 and VTA: F18,162=1.68 for 30 and 68 s after the injection start) analyses. Although current changes in the NAcc were more variable than in the VTA, the GLU increase was stronger and more rapid in the NAcc than the VTA during the first 20 min post-injection (Fig. 4C). These between-structure differences were more pronounced in rapid-scale analyses (Fig. 4F). The initial phase of GLU increase was similarly rapid in both structures, but NAcc [GLU] peaked at ~170 nM at 50–60 s and VTA [GLU] reached only ~90 nM. Similar to other injections, the initial GLU increase correlated in both structures (r=0.47, p<0.05 for 60 s post-injection; Fig. 4F).
Figure 4.

Changes in electrochemical currents detected in the NAcc and the VTA by GLU and GLU-null sensors following the third, final iv nicotine injection. Left panel (A–C) shows changes analyzed with slow time-course resolution (5 min before to 60 min after the injection, 1-min quantification bins). Right panel (D–F) shows changes analyzed with rapid time-course resolution (60 s before to 300 s after the start of iv injection, 4-s quantification bins). Top graphs (A, D) show changes (mean±SEM) detected in the NAcc; middle graphs (B, E) show changes (mean±SEM) detected in the VTA; and bottom graphs (C, F) show between-sensor current differences calibrated in nM of GLU, based on pre-recording sensor sensitivity. Bold horizontal lines with asterisks mark the time of significant Current x Time interaction; filled symbols in C and F shows values significantly different from baseline (p<0.05).
Relationships between nicotine-induced changes in GLU responses and locomotion
Locomotor responses elicited by nicotine injections showed a progressive increase (Fig. 5). While the effect of treatment was weak after the first injection (F20,650=1.48, p=0.049), it grew following the second and third injections (F20,650=3.07 and 2.87; p<0.001). The mean locomotion also gradually increased, and the effect of the third injection was almost two-fold larger than that of the first injection (Fig. 5A4). These increases in locomotion were associated with changes in GLU responses (Fig. 5B). The mean GLU response (area under the curve for 20 min post-injection) in the NAcc was slightly negative after the first nicotine injection but became progressively more positive and long-lasting after each subsequent injection (B1–3). This trend is reflected in a significant increase in mean GLU response (B4). A similar pattern was found in the VTA, where [GLU] showed no significant change after the first injection and a progressively stronger response after the second and third injections. Despite a significant within-session trend, mean [GLU] changes were much smaller in the VTA than in NAcc (B4).
Figure 5.

The time-course (A1–3) and mean values (A4; (mean±SEM) of locomotion (top graphs) and changes in GLU levels in the NAcc and VTA (B1–3, time-course and B4, mean±SEM values; bottom graphs) following three repeated iv nicotine injections within a single treatment session. Bold hatched lines show the moments of iv injection and the second hatched lines (in B1–B3) show the 20-min interval of nicotine action, which was used for calculating mean values of locomotor and GLU responses (in A4 and B4). The effect of nicotine on locomotion was significant in each case (see text). Bold symbols show values significantly different (p<0.05; Fisher test) from pre-injection baseline; asterisks in A4 show that mean values of locomotion in each case were significant compared to baseline, and hash signs indicate significance of between-injection difference in locomotion. B4 shows mean values of the GLU response in the NAcc and the VTA (area under the curve); significant increases for each injection are shown by asterisks and between-group differences are shown by hash marks.
The between-structure differences in GLU responses were especially evident when the data were analyzed at rapid-scale resolution (Fig. 6). In the NAcc, [GLU] phasically increased after each nicotine injection, but the total increase (mean area under the curve for 300 s) steadily grew following the second and third injections. While the phasic increases were equally rapid, [GLU] did not fall from these increased levels after the second, and further increased after the third, injection. In contrast, changes in VTA [GLU] were much weaker in amplitude and showed minimal change following repeated drug injections.
Figure 6.

Rapid changes in extracellular GLU levels in the NAcc (A) and the VTA (B) induced by three repeated iv injections of nicotine during the same treatment session (1, 2, 3). C shows mean values (±SEM) of the GLU change (area under the curve for 300 s) in each structure. Asterisks show significance of between-group differences (*, p<0.05; **, p<0.01, and *** p<0.001).
Discussion
This study produced three novel findings. First, iv nicotine used at a low iv self-administering dose induces rapid, transient GLU release in the NAcc and VTA in drug-naive rats. Second, nicotine-induced GLU responses in both structures significantly increase following repeated injections, in parallel with increases in drug-induced locomotion. These correlated changes at the behavioral and neurochemical levels suggest the rapid development of experience-dependent sensitization of neural effects of nicotine, a phenomenon related to the drug’s reinforcing properties and abuse potential. Third, despite similarities in the general pattern of change in response to nicotine, the NAcc and VTA clearly differ in both basal GLU levels and GLU responses following repeated nicotine exposure.
Rapid GLU responses induced by iv nicotine and their possible mechanisms
Although a large body of indirect evidence (see Introduction) suggests that nicotine can induce GLU release in limbic structures, this study is the first to directly demonstrate rapid, transient rise in extracellular [GLU] in the NAcc and VTA induced by iv nicotine at a low behaviorally active dose in drug-naive rats. Despite known differences between the VTA and NAcc in the source and density of their GLU inputs, the phasic GLU release elicited by the initial nicotine injection was similar in its onset latency, amplitude, and duration in these two interrelated structures. In both cases, GLU levels began to increase at the end of a 20-s drug injection and peaked at 30–40 s before returning to baseline. The timing of this GLU rise is similar to latencies of cortical EEG desynchronization previously reported after iv drug injection (Lenoir and Kiyatkin, 2011), suggesting that GLU release may be either a cause or an essential component of the generalized neural activation induced by nicotine. The short latencies of both effects also suggest that they are triggered in the periphery, involving rapid neural transmission. While a definite time is always required for nicotine to reach brain vessels, cross the blood-brain barrier, diffuse to its neuronal receptor sites, and exert its effects on central neurons (Berridge et al., 2010; Rose et al., 2010), iv nicotine can directly act on nicotinic receptors on afferents of the sensory nerves that densely innervate blood vessels, inducing neural signal, which rapidly reaches the CNS. The critical role of peripheral actions of iv nicotine in triggering its central effects has been recently confirmed by using pharmacological tools. Hexamethonium, a peripherally acting nicotinic antagonist, strongly attenuates nicotine-induced EEG desynchronization and motor activation, but nicotine pyrrolidine methiodide, a peripherally acting nicotinic agonist, mimics rapid electrophysiological effects of nicotine (Lenoir and Kiyatkin, 2011; Lenoir et al., 2013). Therefore, it appears that GLU is rapidly released in the brain as a result of stimulation of peripherally located nicotinic receptors and a subsequent rapid excitatory neural signal, which reaches the VTA and NAcc via visceral sensory pathways.
Rapid changes in GLU responses following repeated nicotine injections
In contrast to relatively small, transient GLU increases induced by nicotine in drug-naive conditions, subsequent nicotine injections induced larger and more prolonged GLU responses in both the NAcc and VTA. In addition to the rapid GLU rise, GLU levels tonically increased after the second and especially after the third injections within the same treatment session. These changes were associated with changes in locomotor responses, which also became stronger and occurred more rapidly after repeated nicotine injections. Therefore, it appears that the development of locomotor sensitization following repeated nicotine exposure is associated with the enhancement of drug-induced GLU release in both the VTA and NAcc.
While the initial, rapid component of the GLU increase seen within seconds after the start of nicotine injection is likely an echo of neuronal GLU release and its subsequent spillover from the synaptic release sites, the mechanisms underlying the tonic phase of the GLU response remain less clear and may include GLU release from non-synaptic neural sites and glial cells. In contrast to rapid synaptic GLU release and subsequent reuptake by low-affinity GLU transporters (Nicolls and Atwell, 1990), extracellular GLU levels are much lower (1–3 μM; Nicholls and Attwell, 1990; Vizi et al., 2010; this study) and less affected by reuptake (Kanai and Hediger, 2004), thus capable of more prolonged fluctuations. However, these fluctuations are several orders of magnitude (hundreds of nM) weaker than those presumably occurring in GLU synapses, but are nonetheless high enough to affect high-affinity extrasynaptic GLU receptors (Zito and Scheuss, 2009) and high-affinity extrasynaptic GLU transporters on neural, glial and epithelial cells (Kanai and Hediger, 2003; Moussawi et al., 2011). While speculative, interaction of GLU with these high-affinity GLU receptors, primarily of the NMDA type, could eventually lead to long-term changes in synaptic strength (including long-term potentiation and depression) and alterations in synaptic structure and connectivity—a possible mechanism of learning-related neuroplasticity (Zito and Scheuss, 2009). Therefore, robust changes in GLU responses following repeated nicotine injections may reflect rapid experience-dependent neuroplasticity of GLU transmission, which may in turn determine sensitization of nicotine’s behavioral, neural, and physiological effects.
Our study supports the idea suggested by previous work (see Introduction) that enhanced DA responses found following repeated nicotine exposure could result from enhanced GLU inputs in the VTA. The causal relations between these two effects, however, remain unclear and changes on both DA and GLU responses could reflect other neurochemical changes occurring due to drug experience. GLU is usually viewed as rapid neurotransmitter, so the appearance of relatively slow, small-magnitude changes in [GLU] elicited by nicotine after drug experience was unexpected. However, the basal GLU levels we report are consistent with those found in electrophysiological studies (Herman et al., 2011) suggesting that extracellular GLU levels fluctuate within much lower limits (50–200 nM), affecting high-affinity extrasynaptic GLU receptors on multiple neurons and modulating their intrinsic properties and responsiveness to phasic inputs.
Differences in GLU responses in the VTA and NAcc
The VTA and NAcc are two interrelated structures, cross-talking to each other but regulated by different afferent inputs. While GLU inputs play an exclusive role in driving NAcc neural activity (Rebec, 1998), extrinsic GLU inputs to the VTA are more sparse (Geisler et al., 2007) and VTA DA neurons are less sensitive to iontophoretic GLU than striatal neurons (Kiyatkin and Rebec, 1998, 1999). Consistent with these differences, we found that basal GLU levels in the NAcc are two to three-fold larger than in the VTA and that GLU responses in the NAcc are stronger following repeated nicotine injections than in the VTA. However, despite more tonic changes in the VTA, GLU responses in both structures had the same overall pattern following repeated nicotine exposure, suggesting a generalized nature of this effect.
Conclusions
Using high-speed amperometery coupled with GLU biosensors, we found that iv nicotine at a low, behaviorally active dose induces rapid, transient GLU release equally evident in the NAcc and the VTA. These nicotine-induced GLU responses are rapidly enhanced (sensitized) following repeated drug exposure, paralleling increases in nicotine’s locomotor-activating effects. Our findings support previous studies, suggesting a critical role of rapid changes in GLU transmission in the experience-dependent sensitization of neural effects of nicotine. They also demonstrate the critical advantage of high-speed neurochemical evaluations in revealing highly phasic fluctuations in extracellular GLU levels induced by drugs and occurring after drug experience.
Supplementary Material
Acknowledgments
This study was supported by the Intramural Research Program of NIDA-IRP. We thank Dr. Ken T. Wakabayashi and Stephanie Myal for valuable comments on the content and language of this manuscript as well as assistance in data analysis.
Abbreviations
- DA
dopamine
- GLU
glutamate
- NAcc
nucleus accumbens
- VTA
ventral tegmental area
Footnotes
Conflict of Interest: The Authors declare no competitive interests in relation to the work described.
References
- Anand A. Role of aortic chemoreceptors in the hypertensive response to cigarette smoke. Respir Physiol. 1996;106:231–238. doi: 10.1016/s0034-5687(96)00087-4. [DOI] [PubMed] [Google Scholar]
- Balfour DJK, Benwell MEM, Birrell CE, Kelly J, Al-Aloul M. Sensitization of the mesoaccumbens dopamine response to nicotine. Pharmacol Biochem Behav. 1998;59:1021–30. doi: 10.1016/s0091-3057(97)00537-6. [DOI] [PubMed] [Google Scholar]
- Berridge MS, Apana SM, Nagano KK, Berridge CE, Leisure GP, Boswell MV. Smoking produces rapid rise of [11C]nicotine in human brain. Psychopharmacology. 2010;209:383–394. doi: 10.1007/s00213-010-1809-8. [DOI] [PubMed] [Google Scholar]
- Bespalov AY, Dravolina OA, Sukhanov I, Zakharova E, Blokhina E, Zvartau E, Danysz W, van Heeke G, Markou A. Matabotropic glutamate receptor (mGluR5) antagonist MPEP attenuates cue- and schedule-induced reinstatement of nicotine self-administration behavior in rats. Neuropharmacology. 2005;49(Suppl 1):167–78. doi: 10.1016/j.neuropharm.2005.06.007. [DOI] [PubMed] [Google Scholar]
- Clarke PB. Mesolimbic dopamine activation—the key to nicotine reinforcement? Ciba Found Symp. 1990;152:153–62. doi: 10.1002/9780470513965.ch9. [DOI] [PubMed] [Google Scholar]
- Cox BM, Goldstein A, Nelson WT. Nicotine self-administration in rats. Br J Pharmac. 1984;83:49–55. doi: 10.1111/j.1476-5381.1984.tb10118.x. [DOI] [PMC free article] [PubMed] [Google Scholar]
- Dani JA, Jenson D, Broussard JI, De Biasi M. Neurophysiology of nicotine addiction. J Addict Res Ther. 2011;S1 doi: 10.4172/2155-6105.S1-001. pii: 001. [DOI] [PMC free article] [PubMed] [Google Scholar]
- D’Souza MS, Markou A. Metabotropic glutamate receptor 5 antagonist 2-metyl-6-(phenylethynyl)pyridine (MPEP) microinfusions into the nucleus accumbens shell or ventral tegmental area attenuate the reinforcing effects of nicotine in rats. Neuropharmacology. 2011;61:1399–405. doi: 10.1016/j.neuropharm.2011.08.028. [DOI] [PMC free article] [PubMed] [Google Scholar]
- Di Chiara G. Role of dopamine in the behavioral actions of nicotine related to addiction. Eur J Pharmacol. 2000;393:295–314. doi: 10.1016/s0014-2999(00)00122-9. [DOI] [PubMed] [Google Scholar]
- Domino EF. Nicotine induced behavioral locomotor sensitization. Prog Neuropsychopharmacol Biol Psych. 2001;25:59–71. doi: 10.1016/s0278-5846(00)00148-2. [DOI] [PubMed] [Google Scholar]
- Donny EC, Caggiula AR, Knopf S, Brown C. Nicotine self-administration in rats. Psychopharmacology. 1995;122:390–394. doi: 10.1007/BF02246272. [DOI] [PubMed] [Google Scholar]
- Engberg G, Hajos M. Nicotine-induced activation of locus coeruleus neurons—an analysis of peripheral versus central induction. Naunyn Schmiedeberg’s Arch Pharmacol. 1994;349:443–3446. doi: 10.1007/BF00169131. [DOI] [PubMed] [Google Scholar]
- Erhardt S, Schwieler L, Engberg G. Excitatory and inhibitory responses of dopamine neurons in the ventral tegmental area to nicotine. Synapse. 2002;43:227–237. doi: 10.1002/syn.10044. [DOI] [PubMed] [Google Scholar]
- Fu Y, Shannon G, Matta SG, Gao W, Brower VG, Sharp BM. Systemic nicotine stimulates dopamine release in nucleus accumbens: Re-evaluation of the role of N-Metyl-D-aspartate receptors in the ventral tegmental area. J Pharmacol Exp Ther. 2000;294:458–65. [PubMed] [Google Scholar]
- Geisler S, Derst C, Veh RW, Zahm DS. Glutamatergic afferents of the ventral tegmental area in the rat. J Neurosci. 2007;27:5730–5743. doi: 10.1523/JNEUROSCI.0012-07.2007. [DOI] [PMC free article] [PubMed] [Google Scholar]
- Ginzel KH. The importance of sensory nerve endings as sites of drug action. Naunyn-Schmiedeberg’s Arch Pharmacol. 1975;288:29–56. doi: 10.1007/BF00501812. [DOI] [PubMed] [Google Scholar]
- Herman MA, Nahir B, Jahr CE. Distribution of extracellular glutamate in the neuropil of hippocampus. PlosOne. 2011;6:e26501. doi: 10.1371/journal.pone.0026501. [DOI] [PMC free article] [PubMed] [Google Scholar]
- Hu Y, Mitchell KM, Albahadily FN, Michaelis EK, Wilson GS. Direct measurement of glutamate release in the brain using a dual enzyme-based electrochemical sensor. Brain Res. 1994;659:117–125. doi: 10.1016/0006-8993(94)90870-2. [DOI] [PubMed] [Google Scholar]
- Juan H. Nicotine nociceptors on perivascular sensory nerve endings. Pain. 1982;12:259–264. doi: 10.1016/0304-3959(82)90157-9. [DOI] [PubMed] [Google Scholar]
- Kanai Y, Hediger MA. The glutamate and neutral amino acid transporter family: physiological and pharmacological implications. Eur J Pharmacol. 2003;479:237–47. doi: 10.1016/j.ejphar.2003.08.073. [DOI] [PubMed] [Google Scholar]
- Keath JR, Iacoviello MP, Barrett LE, Mansvelder HD, McGehee DS. Differential modulation by nicotine of substantia nigra versus ventral tegmental area dopamine neurons. J Neurophysiol. 2007;98:3388–3396. doi: 10.1152/jn.00760.2007. [DOI] [PubMed] [Google Scholar]
- Kelsey JE, Beer T, Lee E, Wagner A. Low doses of dizocipline block the development and subsequent expression f locomotor sensitization to nicotine in rats. Psychopharmacology. 2002;161:370–378. doi: 10.1007/s00213-002-1015-4. [DOI] [PubMed] [Google Scholar]
- Kenny PJ, Chartoff E, Roberto M, Carlezon WA, Markou A. NMDA receptors regulate nicotine-enhanced brain reward functions and intravenous nicotine self-administration: role of the ventral tegmental area and central nucleus of the amygdala. Neuropsychopharmacology. 2009;34:266–381. doi: 10.1038/npp.2008.58. [DOI] [PMC free article] [PubMed] [Google Scholar]
- Kiyatkin EA, Rebec GV. Heterogeneity of ventral tegmental area neurons: single-unit recording and iontophoresis in awake, unrestrained rats. Neuroscience. 1998;85:1285–309. doi: 10.1016/s0306-4522(98)00054-2. [DOI] [PubMed] [Google Scholar]
- Kiyatkin EA, Rebec GV. Modulation of striatal neuronal activity by glutamate and GABA: iontophoresis in awake, unrestrained rats. Brain Res. 1999;822:88–106. doi: 10.1016/s0006-8993(99)01093-8. [DOI] [PubMed] [Google Scholar]
- Kiyatkin EA, Wakabayashi KT, Lenoir M. Physiological fluctuations in brain temperatures as a factor affecting electrochemical evaluations of extracellular glutamate and glucose in behavioral experiments. ACS Chem Neurosci. 2013;4:652–65. doi: 10.1021/cn300232m. [DOI] [PMC free article] [PubMed] [Google Scholar]
- Lenoir M, Kiyatkin EA. Critical role of peripheral actions of intravenous nicotine in mediating its central effects. Neuropsychopharmacology. 2011;36:2125–38. doi: 10.1038/npp.2011.104. [DOI] [PMC free article] [PubMed] [Google Scholar]
- Lenoir M, Tang JS, Woods AS, Kiyatkin EA. Rapid sensitization of physiological, neuronal, and locomotor effects of nicotine: Critical role of peripheral drug actions. J Neurosci. 2013;33:9937–9949. doi: 10.1523/JNEUROSCI.4940-12.2013. [DOI] [PMC free article] [PubMed] [Google Scholar]
- Liu L, Zhao-Shea R, McIntosh JM, Gardner PD, Tapper AR. Nicotine persistently activates ventral tegmental area dopaminergic neurons via nicotinic acetylcholine receptors containing a4 and a6 subunits. Mol Pharmacol. 2012;81:541–8. doi: 10.1124/mol.111.076661. [DOI] [PMC free article] [PubMed] [Google Scholar]
- Liu L, Simon SA. Capsaicin and nicotine both activate a subset of rat trigeminal ganglion neurons. A J Physiol. 1996;270:C1807–C1814. doi: 10.1152/ajpcell.1996.270.6.C1807. [DOI] [PubMed] [Google Scholar]
- Mao D, McGehee DS. Nicotine and behavioral sensitization. J Mol Neurosci. 2010;40:154–163. doi: 10.1007/s12031-009-9230-7. [DOI] [PMC free article] [PubMed] [Google Scholar]
- Matsubayashi H, Amano T, Seki T, Sasa M, Sakai N. Electrophysiological characterization of nicotine-induced excitation of dopaminergic neurons in the rat substantia nigra. J Pharmacol Sci. 2003;93:143–148. doi: 10.1254/jphs.93.143. [DOI] [PubMed] [Google Scholar]
- Moussawi K, Reigel A, Nair S, Kalivas PW. Extracellular glutamate: functional compartments operate in different concentration ranges. Front Syst Neurosci. 2011;24 doi: 10.3389/fnsys.2011.00094. [DOI] [PMC free article] [PubMed] [Google Scholar]
- Nichols DG, Attwell D. The release and uptake of excitatory amino acids. Trends Pharmacol Sci. 1990;11:462–468. doi: 10.1016/0165-6147(90)90129-v. [DOI] [PubMed] [Google Scholar]
- Paxinos J, Watson C. The Rat Brain in Stereotaxic Coordinates. Academic Press; Sydney: 1998. [Google Scholar]
- Rebec GV. Dopamine, glutamate, and behavioral correlates of striatal neuronal activity. Adv Pharmacol. 1998;42:737–740. doi: 10.1016/s1054-3589(08)60853-4. [DOI] [PubMed] [Google Scholar]
- Rose JE, Corrigall WA. Nicotine self-administration in animals and humans: similarities and differences. Psychopharmacology. 1997;130:28–40. doi: 10.1007/s002130050209. [DOI] [PubMed] [Google Scholar]
- Rose JE, Mukhin AG, Lokitz SJ, Turkington TG, Herskovic J, Behm FM, Garg S, Garg PK. Kinetics of brain nicotine accumulation in dependent and nondependent smokers assessed with PET and cigarette containing 11C-nicotine. PNAS. 2010;107:5190–5195. doi: 10.1073/pnas.0909184107. [DOI] [PMC free article] [PubMed] [Google Scholar]
- Sastry BV, Chance MB, Singh G, Horn JL, Janson VE. Distribution and retention of nicotine and its metabolite, cotinine, in the rat as a function of time. Pharmacology. 1995;50:128–36. doi: 10.1159/000139274. [DOI] [PubMed] [Google Scholar]
- Stalhanske T. Effect of increased liver metabolism of nicotine on its uptake, elimination and toxicity. Acta Physiol Scand. 1970;80:222–34. doi: 10.1111/j.1748-1716.1970.tb04786.x. [DOI] [PubMed] [Google Scholar]
- Svensson TH, Mathe JM, Nomikos GG, Shilstrom B. Role of excitatory amino acids in the ventral tegmental area for the central actions of non-competitive NMDA-receptor antagonists and nicotine. Amino Acids. 1998;14:51–6. doi: 10.1007/BF01345242. [DOI] [PubMed] [Google Scholar]
- Sziraki I, Sershen H, Hashim A, Lajtha A. Receptors in the ventral tegmental area mediating nicotine-induced dopamine release in the nucleus accumbens. Neurochem Res. 2002;27:253–61. doi: 10.1023/a:1014844823534. [DOI] [PubMed] [Google Scholar]
- Tang JS, Kiyatkin EA. Fluctuations in central and peripheral temperatures induced by intravenous nicotine: Central and peripheral contributions. Brain Res. 2011;1383:141–53. doi: 10.1016/j.brainres.2011.01.092. [DOI] [PMC free article] [PubMed] [Google Scholar]
- Turner DM. The metabolism of [14C]nicotine in the cat. Biochem J. 1969;115:889–96. doi: 10.1042/bj1150889. [DOI] [PMC free article] [PubMed] [Google Scholar]
- Vezina P, McGehee DS, Green WN. Exposure to nicotine and sensitization of nicotine-induced behaviors. Prog Neuropsychopharmacol Biol Psychiatry. 2007;31:1625–38. doi: 10.1016/j.pnpbp.2007.08.038. [DOI] [PMC free article] [PubMed] [Google Scholar]
- Vizi EA, Fekete A, Karoly R, Mike A. Non-synaptic receptors and transporters involved in brain functions and targets of drug treatment. Brit J Pharmacol. 2010;160:785–809. doi: 10.1111/j.1476-5381.2009.00624.x. [DOI] [PMC free article] [PubMed] [Google Scholar]
- Wakabayashi KT, Kiyatkin EA. Rapid changes in extracellular glutamate induced by natural arousing stimuli and intravenous cocaine in the nucleus accumbens shell and core. J Neurophysiol. 2012;108:285–299. doi: 10.1152/jn.01167.2011. [DOI] [PMC free article] [PubMed] [Google Scholar]
- Wise RA, Bozarth MA. A psychomotor stimulant theory of addiction. Psychol Rev. 1987;94:469–492. [PubMed] [Google Scholar]
- Zito K, Scheuss V. NMDA receptor function and physiological modulation. In: Squire LR, editor. Encyclopedia of Neuroscience. Vol. 6. Oxford: Academic Press; 2009. pp. 1157–64. [Google Scholar]
Associated Data
This section collects any data citations, data availability statements, or supplementary materials included in this article.