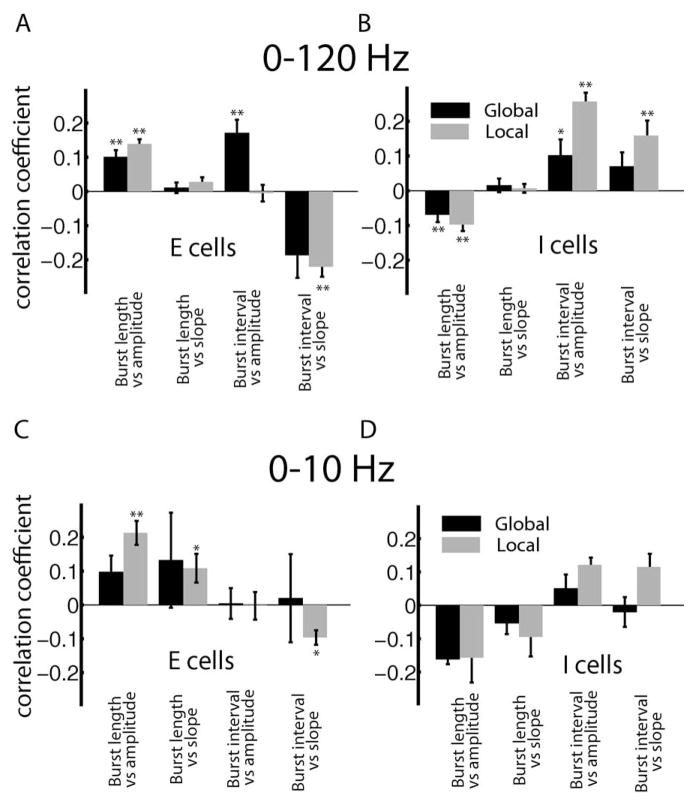
Fig. 8.
Summary of population-averaged correlation coefficients obtained between burst and stimulus attributes for 0–120 Hz stimuli for E (A) and I (B) cells. The correlation coefficients obtained for 0–10 Hz stimuli for E (C) and I (D) cells are also shown. “**” and “*” indicate statistical significance at the P=0.01 and 0.05 levels using a signrank test, respectively.

