Abstract
Many neurons display intrinsic interspike interval correlations in their spike trains. However, the effects of such correlations on information transmission in neural populations are not well understood. We quantified signal processing using linear response theory supported by numerical simulations in networks composed of two different models: One model generates a renewal process where interspike intervals are not correlated while the other generates a nonrenewal process where subsequent interspike intervals are negatively correlated. Our results show that the fractional rate of increase in information rate as a function of network size and stimulus intensity is lower for the nonrenewal model than for the renewal one. We show that this is mostly due to the lower amount of effective noise in the nonrenewal model. We also show the surprising result that coupling has opposite effects in renewal and nonrenewal networks: Excitatory (inhibitory coupling) will decrease (increase) the information rate in renewal networks while inhibitory (excitatory coupling) will decrease (increase) the information rate in nonrenewal networks. We discuss these results and their applicability to other classes of excitable systems.
I. INTRODUCTION
The study of excitable systems has applications in various fields such as semiconductor physics, laser physics, photodetection, and neural spike trains [1]. In particular, studying models of spike train generation in neurons is critical for our understanding of their information transmission properties which is complicated by the fact that neurons will display variability to repeated presentations of the same stimulus [2]. The role of this noise is still unclear. On the one hand, noise can be used to enhance information transmission about relevant stimuli through stochastic resonance [3] where the output signal-to-noise ratio displays a maximum as a function of the noise intensity. At the single neuron level, stochastic resonance is exclusively seen in the subthreshold regime and noise can thus only degrade information transmission in the suprathreshold regime. From this point of view, noise should be minimized in order to improve information transmission.
Our understanding of information transmission by neurons is also complicated by the fact that many neurons display intrinsic dynamics such as bursting [4], oscillations [5], and correlations between successive interspike intervals [6,7]. In the case of intrinsic interspike interval correlations, it was shown through numerical simulations that they could enhance information transmission at the single neuron level [8]. Recent theoretical studies [9,10] have shown that this enhancement in information transmission occurred via noise shaping: a process in which noise power is shifted from one frequency range to another thereby improving signal transmission in the former frequency range. Noise shaping was originally proposed in the context of σ-δ modulators [11] and is thought to be used in the brain [12].
While noise shaping can occur at the individual neuron level, it can also be an emergent property of neural networks with inhibitory coupling [13]. As such, it is not clear how coupling neurons that display noise shaping at the individual level will affect their information transmission properties. We investigated the information transmission in neural networks composed of neurons that display noise shaping (non-renewal) when considered in isolation and compared these to neural networks where the neurons displayed no noise shaping (renewal). The paper is organized as follows. We first present the models in Sec. II. In Sec. III we present theoretical calculations based on linear response theory [14] for the information transmission [15] of neural networks [16]. We then explore in Sec. IV the role of network size and noise intensity. Finally, we explore how coupling affects information transmission for networks composed of renewal and nonrenewal neurons. We then discuss the potential implications of our results.
II. THE MODELS
A. Renewal versus nonrenewal models
Both the renewal and nonrenewal models are perfect integrators of the input and the observable output v (e.g., the membrane voltage) is given by [9,10]
| (1) |
where μ is a positive bias current and s(t) is the time-dependent stimulus. Whenever v reaches a threshold θ, an action potential is said to have occurred and v is reset to a value θR. After each firing, a new value for θ is drawn from a uniform distribution [θ0 − D, θ0 + D]. As such, a nonzero value of D will lead to variability in the firing sequence. The main difference between the models is the reset rule. In the nonrenewal model, also referred as model A, v is decreased by a fixed amount θ0 immediately after an action potential (i.e., θR = θ − θ0). This will lead to a uniform distribution of reset values in the interval [−D,D]. With this, the mean interspike interval (ISI) will be given by 〈I〉 =θ0/μ or, equivalently, a stationary firing rate
| (2) |
It can be shown that the threshold value θ and the subsequent reset value θR are perfectly correlated by the reset rule, thereby correlating successive interspike intervals in the absence of a signal [9,10].
On the other hand, in the renewal model, also referred to as model B, the voltage v is reset to θR with θR drawn independently from the uniform distribution [−D,D] after each firing. In this way, since both the threshold and reset values are completely independent, successive interspike intervals will not be correlated. We note that model B will be more random than model A as the former requires that two random numbers be generated after each firing whereas the latter only requires one [10].
Both models A and B share the same first order statistics of threshold and reset values and therefore the first order statistics will be the same, such as the stationary firing rate r0 given by Eq. (2). We take the output of the neuron to be a train of δ functions centered on the times at which action potentials occur:
| (3) |
B. Network architecture
The neuron models described previously are then coupled with the membrane voltage v of the ith neuron vi is given by
| (4) |
where μi is the bias current for neuron i, is the mth spike of neuron j, and Mj(t) is the spike count (i.e., the total number of action potentials) fired by neuron j at time t. Kij represents the coupling strength between neurons j and i and γ(t) is the post-synaptic potential waveform given by
| (5) |
where Θ(t) is the Heaviside function and τs determines the rate of decay. Throughout this study we will consider the case of homogeneous networks such that Kij = K and μi = μ.
III. THEORY OF SIGNAL TRANSMISSION BY NETWORKS OF RENEWAL AND NONRENEWAL NEURONS
In this section we derive an analytical expression for the mutual information between the input s(t) and the output of the network which we define as the average activity X(t):
| (6) |
Throughout this study, we will take that s(t) is zero mean Gaussian white noise and spectral height α that is low-pass filtered by an eighth-order Butterworth filter at cutoff frequency fC.
A. Information theory
Information theory was first developed by Shannon [17] in the context of communications systems and has become a standard measure to characterize information transmission by excitable systems [15,18,19]. For systems driven by a stimulus with a Gaussian probability distribution, a lower bound on the rate of information transmission has been derived and this lower bound is exact for a linear system [15,18]
| (7) |
where the signal to noise ratio is related to the coherence by
| (8) |
and the coherence function C(f) is given by
| (9) |
where PXX(f) =〈|X̂(f)|2〉 is the power spectrum of the averaged network activity X(t), Pss(f) =〈|ŝt(f)|2〉 is the power spectrum of the stimulus s(t), and PXs(f) is the cross spectrum between the average network activity X(t) and the stimulus s(t).
B. Linear response theory
Linear response theory [14] assumes that both the stimulus s(t) as well as the activity of other neurons in the network are perturbations of the baseline activity of the single neuron x0i(t) given by setting Kij =0 and s(t) =0. Thus, we have
| (10) |
where γ̂(f) is the Fourier transform of γ(t) given by
| (11) |
and χ(f) is the susceptibility. Previous studies have found that the susceptibility of models A and B are equal and given by [9,10]
| (12) |
We note that Eq. (10) is only valid for small values of K and s(f).
By averaging both sides of Eq. (10) and isolating for X̂(f) we obtain
| (13) |
The power spectrum of the network activity can thus be obtained by computing 〈X̂X̂★〉, where the average 〈···〉 is performed over realizations. By substituting Eqs. (11) and (12) into Eq. (13) and performing the averaging we get
| (14) |
where P00(f) = 〈|x̂0|2〉 is the baseline spectrum of a single neuron which is given by [9,10]
| (15) |
| (16) |
| (17) |
where β=2πd/μ.
The cross-spectrum can be found by evaluating PXs(f) = 〈X̂ŝ★〉:
| (18) |
and the coherence is given by
| (19) |
substituting Eq. (14) into Eq. (19) gives
| (20) |
where P00(f) = P00A(f) or P00B(f). Which is then used in Eqs. (7) and (8) to evaluate the mutual information rate MI.
As in previous studies [16,20], we decompose the input from other neurons into constant and time-dependent components. The constant part gives a net bias current μ′ given by
| (21) |
substituting r0(μ′) = μ′/θ0 and solving for μ′ gives
| (22) |
which is then used in the theoretical expressions (15) and (16).
IV. RESULTS
A. Renewal versus nonrenewal networks
We first compare the baseline [i.e., s(t) =0 and K=0] power spectra of the two models for N=1. Figure 1 shows the power spectrum of the baseline activity of both renewal and nonrenewal single neurons which are similar to those found in previous studies [9,10]. We note two important differences between the curves: (1) the power spectrum of the nonrenewal neuron model approaches 0 as f → 0 whereas the power spectrum of the renewal neuron model tends towards a nonzero positive value; (2) the peaks in the power spectrum of the nonnenewal neuron are sharper than those of the renewal neuron. Both observations (1) and (2) stem from the fact that successive ISIs are negatively correlated in the non-renewal neuron whereas they are uncorrelated in the renewal neuron [9,10]. The power spectrum at f =0 is related to the coefficient of variation and the ISI correlation coefficients by
[21] where 〈I〉 is the mean interspike interval and the coefficient of variation
 is the same for both models since they have identical ISI distributions and ρi =0 for i>1 for both models [9,10]. The only difference is that ρ1 =−0.5 for the nonrenewal model and ρ1 =0 for the renewal model which gives
FIG. 1.
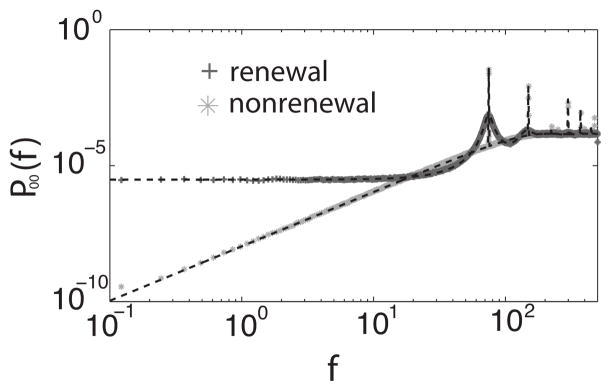
Power spectrum of the baseline of a single renewal and nonrenewal neuron. Numerical simulations are represented with the symbols and were averaged between 50 trials. The theoretical value is represented as a black dashed line. The parameters used were μ =290, θ0 =4, d =0.7.
| (23) |
| (24) |
Parameter values for the numerical simulations where chosen such as to give baseline firing rates r0 ≈ 100 which was inspired by the firing rates (in Hz) of neurons that tend to display negative ISI correlations experimentally [8,22]. We varied K and used large values in our numerical simulations in order to test the limits of the linear response theory that we presented above.
B. Network size
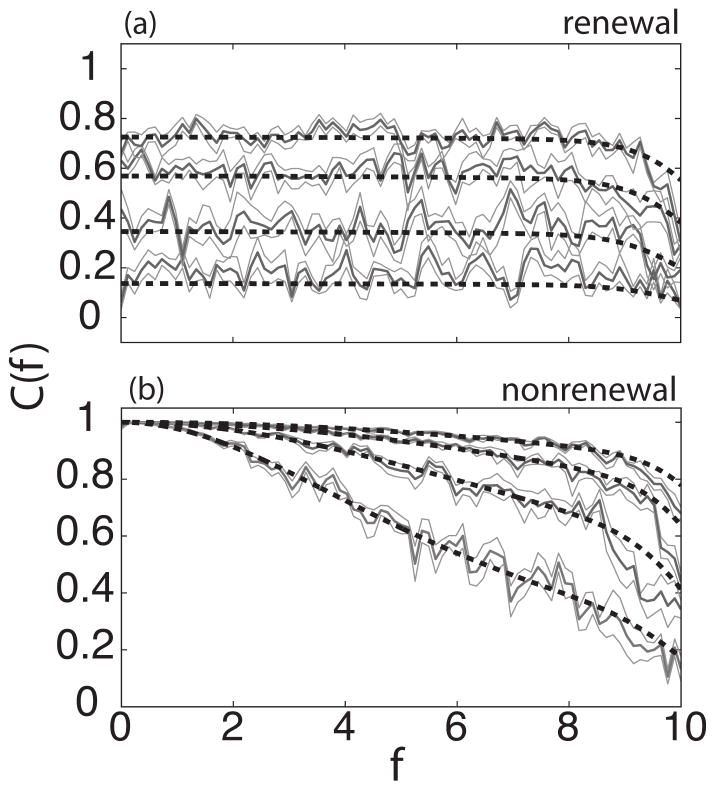
We first explored the effects of increasing the network size N in networks of uncoupled renewal and nonrenewal neurons receiving common input. Figure 2 shows the coherence of the networks for a stimulus with fC =10 as the network size N is varied. It is seen that the coherence increases as a function of the number of neurons in the network for both models. However, there are qualitative differences: Whereas in the renewal model the coherence has a constant value in the frequency range [0, fC], for the nonrenewal populations the coherence has a fixed value of 1 at f =0 and decreases monotonically for f>0. These differences are due to the differing baseline power spectra [9,10]: In the absence of any stimulus, the baseline power spectrum in Fig. 1 can be thought as the power carried by the intrinsic noise of the neurons. When the stimulus is added, the coherence between the stimulus and the response can be computed as in Eq. (20) which shows that the coherence is related to the inverse of the power spectrum of a single neuron. As such, since the baseline power spectrum of model A goes to zero as f → 0, the coherence of the network activity for model A at f =0 is thus one according to Eq. (20).
FIG. 2.
Coherence C(f) as function of frequency f for different values of the network size N with renewal (a) and nonrenewal (b) neurons. In both panels the number of neurons from bottom to top: 3,10,25,50 neurons. Solid color shows simulation and dashed line the theory. Dark gray represents the mean from ten trials surrounded in light gray by the standard error. The parameter values are as follows: θ0 =4, d =0.7, τs =0.001, fC =10, μ=290, I=5, K=0.
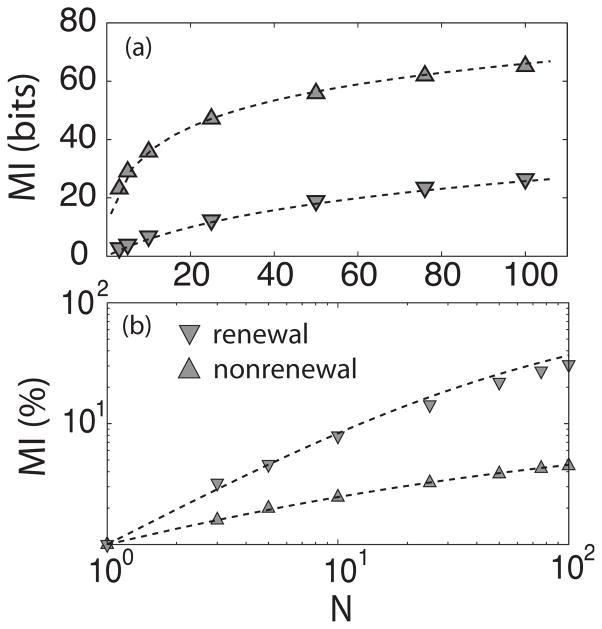
We then computed the mutual information from the coherence function using Eq. (7). Although networks of nonrenewal neurons had larger mutual information rate than networks of renewal neurons, there were differences in the rate at which this quantity increases as a function of network size. The range at which this is more evident is from 1 to 25 neurons where the rate is higher for the nonrenewal neurons that for the renewal ones. After 25 neurons, the rate of increase appears to be the same for both models. However, the fractional increase of MI which stands for MI normalized to its value with one neuron is greater for the renewal network than for the nonrenewal network Fig. 3. We shall return to these differences later when we investigate the effects of the noise intensity D.
FIG. 3.
Mutual information as a function of the number of neurons in the network. In (a) both models are shown together, nonrenewal (triangles up) and renewal (triangles down) neurons. The triangles represent the simulations and dashed line the theoretical results. The standard error is less than the height of the triangles. The plots in (b) show MI for each of the models normalized to the value of MI for one neuron. Parameter values are the same as in Fig. 2.
C. Internal noise intensity
We now explain the qualitative differences in the variation of the mutual information rate MI as a function of network size N and stimulus intensity I seen in renewal and nonrenewal networks. Specifically, we hypothesize that these differences are primarily due to a lower effective noise in the nonrenewal model. Thus, we explore the effect of varying the amount of intrinsic noise as set by the noise intensity D on the information transmission properties of renewal and nonrenewal networks.
1. Suprathreshold stochastic resonance
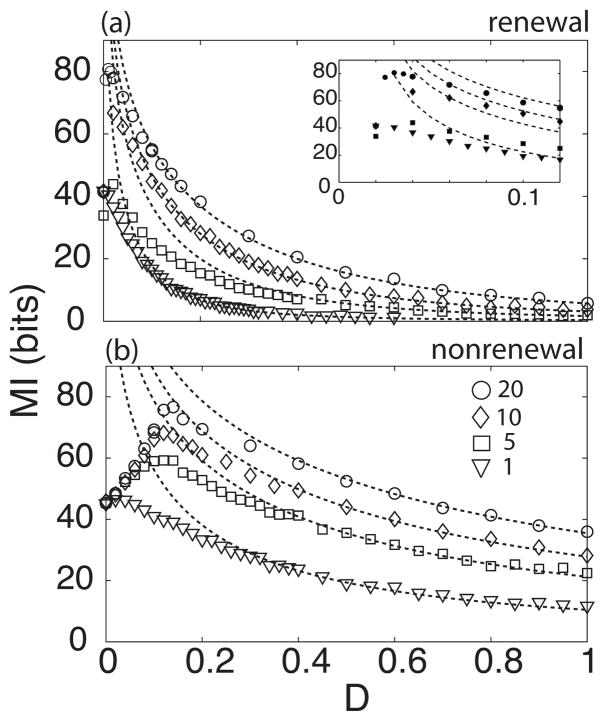
First we computed the mutual information rate MI as a function of the noise intensity D for networks with different sizes. Figures 4(a) and 4(b) show MI as a function of internal noise intensity for renewal and nonrenewal networks, respectively. The symbols represent numerical simulations and the dashed line the theoretical results. There is a disagreement between theory and simulations for low values of noise intensity. While the theory predicts that MI should decrease monotonically as a function of noise intensity, the simulations show that MI reaches a maximum value at D≠0. The behavior of both models is similar. When D=0, MI has the same value independent of the model chosen as both models have completely similar dynamics. When increasing D, MI increases and reaches a maximum value for a nonzero value of D after which it monotonically decreases. The maximum value of MI is dependent on network size N as well as the model used. For networks with higher number of neurons, MI is higher and its maximum is achieved at higher values of D. Using the same parameters in both models, MI of the renewal model reaches a maximum for lower values of D [Fig. 4(a), inset] as compared to the nonrenewal model.
FIG. 4.
Mutual information as a function of noise intensity D for renewal (a) and nonrenewal (b) networks for different network sizes. From top to bottom we used N=20, 10, 5, and 1. Symbols represent simulations and dashed lines theoretical values. Inset shows the MI for D between 0 to 0.1 to better show the MI peaks for different values of N.
The resonance in the mutual information as a function of noise intensity is a phenomenon previously described as suprathreshold stochastic resonance [23] which is only observed in population of two or more excitable systems. We note that this phenomenon cannot be explained with linear response theory which predicts an infinite mutual information for zero noise intensity.
2. Effective noise intensity
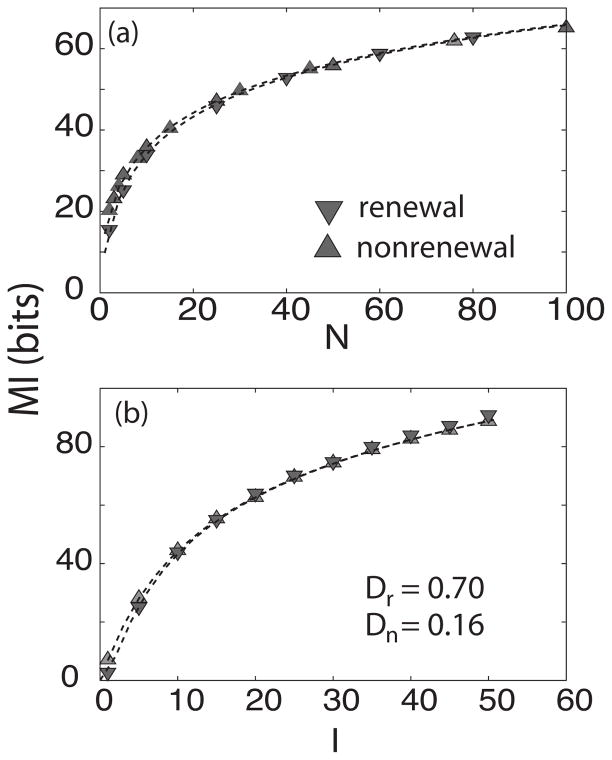
The dependence on noise intensity D of the mutual information rate MI is qualitatively similar for both models except that the maximum in information is achieved for lower values of D for the renewal model (Fig. 4). This suggests that both models should behave the same way if we scale the value of D appropriately in order to have the same effective noise intensity. In order to test this, we computed MI as a function of network size N and stimulus intensity I for different values of D (data not shown). It was found empirically that for a certain relation of the noise intensity of both models, the information transmission behaves in a similar fashion as seen below. Namely, there exists a number a such that Dn = aDr where Dn is the noise intensity of the nonrenewal model and Dr of the renewal model for which MI as a function of stimulus intensity and network size N agree for both models, for the parameters used throughout this study we found that a=4.44.
Figures 5(a) and 5(b) show the mutual information rate MI as a function of network size N and stimulus intensity I, respectively. With the parameter values chosen as in Fig. 2 and by suitable values of Dr and Dn MI, the mutual information rate MI behaves in a quantitatively similar manner as a function of both stimulus intensity and network size for both models. As such, the qualitative differences seen previously were primarily due to differences in the effective noise in the models at frequencies for which the stimulus has power.
FIG. 5.
Renewal and nonrenewal models behave similarly for different values of the noise intensity D. Mutual information rate MI as a function of network size N(a) and stimulus intensity I(b) Here Dn =0.7, Dr =0.158 while other parameters have the same value as in Fig. 4. Up and down triangles represent simulations for nonrenewal and renewal networks, respectively, and the dashed lines the theoretical values.
D. Excitatory and inhibitory coupling
We now explore the effects of coupling in both networks by varying the coupling strength K. It was shown by Mar et al. [13] that introducing inhibitory coupling in the network can give rise to noise shaping and thereby increase the signal-to-noise ratio.
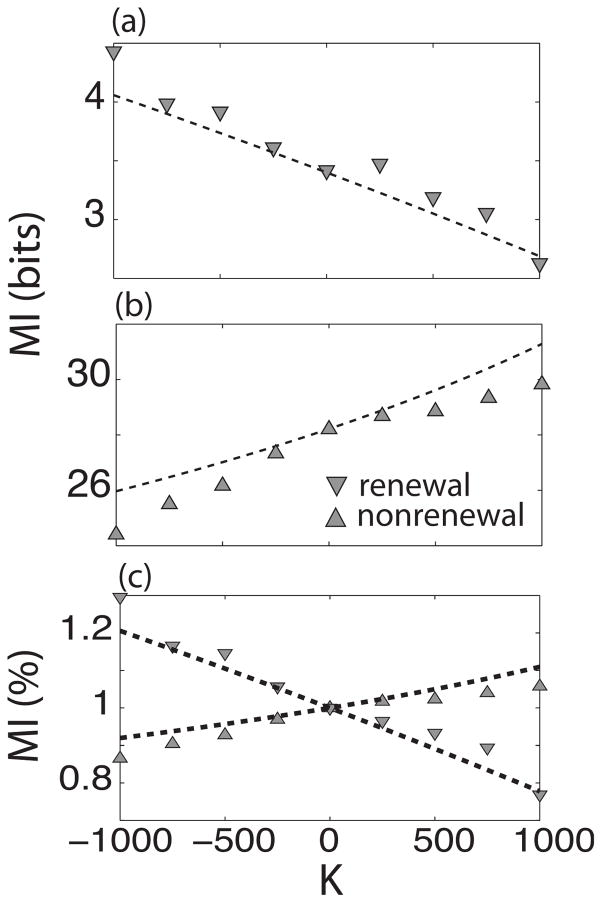
The effect of varying the amount of coupling K can be seen in Fig. 6. Figures 6(a) and 6(b) show the mutual information rate as a function of coupling for nonrenewal and renewal networks, respectively. It can be seen that MI decreases as a function of increasing K for the renewal network. Surprisingly, the behavior for the nonrenewal network is opposite: MI increases for increasing K. The absolute values of MI are greater for the nonrenewal than for the renewal network. In order to make a clear comparison between both models, MI was normalized to its value at K=0. Figure 6(c) shows the normalized MI for both models. The theory (dashed lines) predicts the behavior seen in the simulations. However, the theory best predicts the simulations for values of K close to zero. For larger K, nonlinear effects take place and the agreement between simulations and theory becomes only qualitative with the theory overestimating the numerical values of mutual information. This overestimation of information rate by linear response theory has been seen previously [16].
FIG. 6.
Mutual information as a function of coupling strength K of renewal (a) and nonrenewal (b) networks. The triangles represent the simulations and the dashed line the theoretical values. (c) Shows MI normalized to the value of coupling at K=0. A clear qualitative difference can be seen for both models.
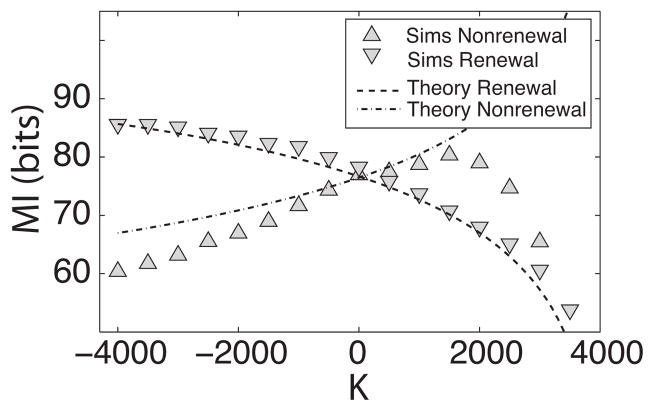
It is possible that this qualitatively different behavior is due to the different effective noise intensities in both models. As such, we scaled the values of Dr and Dn as done previously and compared the effects of coupling. Figure 7 shows the mutual information rate MI as a function of coupling strength K for both model and is qualitatively similar to Fig. 6(c). MI for the renewal model decreases as K is increased. On the contrary, MI for the nonrenewal model increases as K increases up to a certain value (K ≈ 1500) after which it decreases. The theory predicts the behavior of both models for a region close to K=0 where nonlinear effects are not too large. The drop of MI for the nonrenewal model is not predicted by the theory and is most probably due to strong nonlinear synchronization for large positive values of coupling strength K. However, our results show that the opposite effects of coupling persist even when both models have similar effective noise values in a neighborhood of K=0.
FIG. 7.
Mutual information rate as a function of coupling strength for renewal and nonrenewal models with different noise intensities. Here we set N=20, I=40, Dr=0.4, Dn=1.78 with other parameters having the same value as in Fig. 6.
We now explain this counterintuitive result: Direct examination of the expression for the coherence C(f) shows that the only difference between the models is the baseline power spectrum P00(f) as seen from inspection of Eq. (20). We furthermore note that coupling will introduce changes in the effective value of the bias current μ used in the theory which are due to the changes in firing rate that are caused by coupling as explained above. Moreover, the power spectrum of a single neuron [Eqs. (16) and (15)] is a function of μ for both renewal and nonrenewal models. As such, we explored the effects of varying the baseline firing rate r0=μ/θ0 on the power spectra of single isolated renewal and nonrenewal models while keeping θ0 constant.
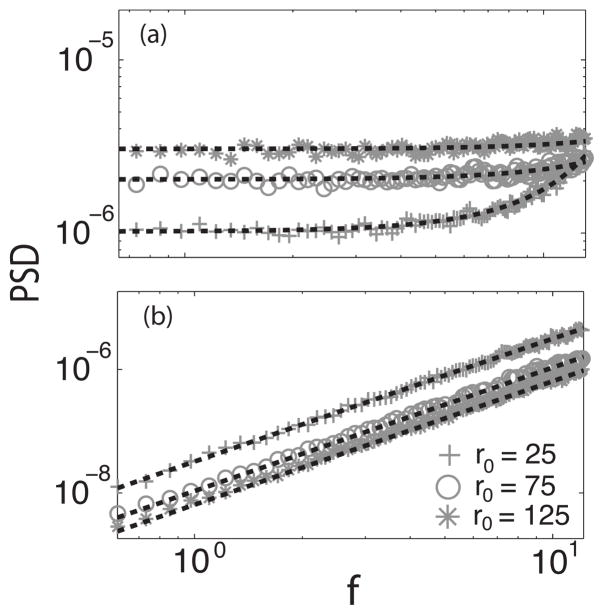
Figures 8(a) and 8(b) show the power spectra of single renewal and nonrenewal neurons, respectively. An increase (decrease) in firing rate would correspond to positive (negative) coupling. For the renewal neuron it can be seen that as the firing rate increases the power spectrum also increases. The situation for the nonrenewal neurons is exactly opposite: as the firing rate increases the power spectrum decreases. This explains why the mutual information is greater for the nonrenewal network when introducing positive coupling as compared to an uncoupled network or equivalently the mutual information increasing when a negative coupling is introduced in a network of renewal neurons.
FIG. 8.
Power spectrum of a single renewal (a) and nonrenewal (b) neuron as a function of stationary firing rate. Symbols represent numerical simulations. Crosses represents r0=25, circles r0=75, and diamonds r0=125. Dashed lines represent the theoretical values accordingly. Other parameters of the single neuron are the same as in Fig. 1.
We now turn our attention towards the differential behavior of the baseline power spectra of each model as μ is increased. In order to better understand the behavior of each spectrum at low frequencies we performed Taylor series expansions of Eqs. (15) and (16) around f=0 and obtained
| (25) |
| (26) |
| (27) |
| (28) |
| (29) |
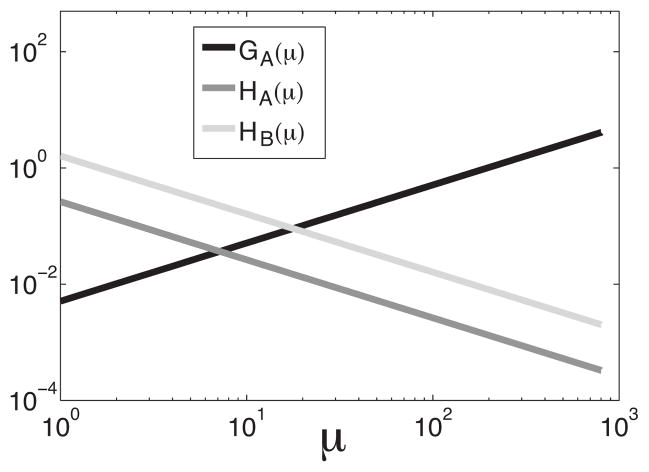
Figure 9 shows GA,B(μ) and HA,B(μ) as a function of μ. The zeroth order term of the renewal model increases linearly with μ, whereas the zeroth order term of the nonrenewal model is zero. In both models the second order terms decay as 1/μ. For the renewal model, the behavior of the baseline power spectrum near f=0 is dominated by the zeroth order term GB(μ) which increases linearly with μ. For the nonrenewal model, the behavior of the baseline power spectrum near f=0 is dominated instead by the second order term HA(μ) which decreases as 1/μ since GA(μ)=0. This explains the results of Fig. 8.
FIG. 9.
First and second coefficients of the Taylor expansion of the power spectra P00A and P00B. Both second order terms decrease as μ increases while the zeroth-order term is nonzero only for model B and increases linearly with μ. Here θ0=4, D=0.7, and μ =290.
V. DISCUSSION
We have compared information transmission in networks of renewal and nonrenewal neurons. Our results show theoretically and through numerical simulations that both networks will behave in a similar manner when stimulus intensity, network size, and cutoff frequency are varied although the fractional increase in mutual information rate was higher for the renewal network. Both networks were shown to display suprathreshold stochastic resonance when the noise intensity was varied although the maximum for the renewal network was obtained for a lower noise intensity than the nonrenewal network. We then hypothesized that the differences seen between both networks where primarily due to a lower “effective” noise in the nonrenewal network. To test that hypothesis, we compared the mutual information rates of both networks for different noise intensities. Our results showed that, for noise intensities that would give similar information rates at the single neuron level, the behavior of the information rate for both networks was essentially the same. We then looked at the effects of coupling on both renewal and nonrenewal networks and found opposite effects: While inhibitory coupling increased information transmission for the renewal network, it actually decreased information transmission for the nonrenewal network. Examination of the theoretical results leads to the fact that the influence of the quality of the coupling is done directly through a an effective baseline current that the neurons receive. The power spectrum of a single neuron has a qualitative different dependence on the bias current. The noise power is reduced when decreasing μ for the renewal model and is increased for the nonrenewal one. The effect is opposite when increasing μ. This results suggest that intrinsic properties of the neurons such as spike patterning are important when attempting to transmit a signal through a network.
Our results for uncoupled networks show that the information rate will fractionally increase more slowly as a function of network size for nonrenewal networks. This result has important applications for peripheral sensory neurons that display negative interspike interval correlations and that are not coupled. This is the case for electroreceptor neurons of weakly electric fish [7] which must detect the weak signals emitted by prey stimuli that impinge on only a small portion of their sensory epithelium [24]. The fact that the information does not increase as much suggests that only a few of these electroreceptor neurons would be sufficient for transmitting information about prey stimuli.
Our results make predictions for the behavior of the power spectrum at low frequencies as a function of bias current. For neurons displaying negative interspike interval correlations, the power spectrum should decrease as a function of increasing bias current whereas, for neurons that do not display interspike interval correlations, the power spectrum should increase. This prediction can be directly tested experimentally in intracellular recordings in which the bias current can be varied. As experimental results have shown values of 0≥ρ1>−0.5 [6], the value of the power spectrum for such neurons at f=0 is then proportional to the firing rate times the coefficient of variation squared [21]. In order for this quantity to decrease as a function of increasing bias current, it is sufficient for the coefficient of variation to decrease faster than with r the mean firing rate. Previous experimental studies have shown that the coefficient of variation will decrease as a power law for sufficiently high firing rates although the power law exponent remains to be measured [25]. Incidentally, a recent experimental study has shown that neurons displaying negative interspike interval correlations tended to have larger firing rates than neurons that did not [22]. Further experimental studies are needed to verify this.
Our results show that coupling can have profound consequences on information transmission depending on the intrinsic dynamics of the neurons from which the network is comprised of. Indeed, it was found by Mar et al. [13] that inhibitory coupling would lead to an increased signal-to-noise ratio for networks of integrate-and-fire neurons. Our results for the renewal model were consistent with those of Mar et al. and we have extended their results using information theory. However, our results show that it is excitatory coupling, and not inhibitory coupling, that will lead to increased information transmission for the nonrenewal model. Anatomical studies have found that the majority of synaptic connections between neurons are excitatory [26] and that neurons can display intrinsic interspike interval correlations experimentally [6,7]. As such, our results suggest that noise shaping may occur at the network level in the brain. Further theoretical studies should incorporate other forms of intrinsic dynamics such as resonance [27], time delays, as well as burst firing [4] to look at their effects on information transmission.
Acknowledgments
This research was supported by CONACyT, SEP (O.A.A.), and CIHR, CFI, and CRC (M.J.C).
Footnotes
PACS number(s): 87.19.lc, 87.19.ll, 87.19.lo
References
- 1.Yacomotti AM, Eguia MC, Aliaga J, Martinez OE, Mindlin GB, Lipsich A. Phys Rev Lett. 1999;83:292. [Google Scholar]; Wiesenfeld K, Satija I. Phys Rev B. 1987;36:2483. doi: 10.1103/physrevb.36.2483. [DOI] [PubMed] [Google Scholar]
- 2.Mainen ZF, Sejnowski TJ. Science. 1995;2681503 doi: 10.1126/science.7770778. [DOI] [PubMed] [Google Scholar]
- 3.Bulsara A, et al. J Stat Phys. 1993;70(1) [Google Scholar]; Gammaitoni L, et al. Rev Mod Phys. 1998;70:223. [Google Scholar]; Moss F, Ward L, Sannita W. Clin Neurophysiol. 2004;115:267. doi: 10.1016/j.clinph.2003.09.014. [DOI] [PubMed] [Google Scholar]
- 4.Izhikevich EM. Int J Bifurcation Chaos Appl Sci Eng. 2000;10:1171. [Google Scholar]; Sherman SM. Trends Neurosci. 2001;24:122. doi: 10.1016/s0166-2236(00)01714-8. [DOI] [PubMed] [Google Scholar]
- 5.Gray C, Singer W. Proc Natl Acad Sci USA. 1989;86:1698. doi: 10.1073/pnas.86.5.1698. [DOI] [PMC free article] [PubMed] [Google Scholar]; Sillito AM, et al. Nature (London) 1994;369:479. doi: 10.1038/369479a0. [DOI] [PubMed] [Google Scholar]; MacLeod K, Laurent G. Science. 1996;274:976. doi: 10.1126/science.274.5289.976. [DOI] [PubMed] [Google Scholar]; Kashiwadani H, et al. J Neurophysiol. 1999;82:1786. doi: 10.1152/jn.1999.82.4.1786. [DOI] [PubMed] [Google Scholar]; Stopfer M, et al. Nature (London) 1997;390:70. doi: 10.1038/36335. [DOI] [PubMed] [Google Scholar]
- 6.Klemm WR, Sherry CJ. Int J Neurosci. 1981;14:15. doi: 10.3109/00207458108985812. [DOI] [PubMed] [Google Scholar]; Lowen SB, Teich MC. J Acoust Soc Am. 1992;92:803. doi: 10.1121/1.403950. [DOI] [PubMed] [Google Scholar]; Lebedev MA, Nelson RJ. Exp Brain Res. 1996;111:313. doi: 10.1007/BF00228721. [DOI] [PubMed] [Google Scholar]; Ratnam R, Nelson ME. J Neurosci. 2000;20:6672. doi: 10.1523/JNEUROSCI.20-17-06672.2000. [DOI] [PMC free article] [PubMed] [Google Scholar]; Chacron MJ, Longtin A, St-Hilaire M, Maler L. Phys Rev Lett. 2000;85:1576. doi: 10.1103/PhysRevLett.85.1576. [DOI] [PubMed] [Google Scholar]; Korn H, Faure P. C R Biol. 2003;326:787. doi: 10.1016/j.crvi.2003.09.011. [DOI] [PubMed] [Google Scholar]
- 7.Chacron MJ, Maler L, Bastian J. Nat Neurosci. 2005;8673 doi: 10.1038/nn1433. [DOI] [PMC free article] [PubMed] [Google Scholar]
- 8.Chacron MJ, Longtin A, Maler L. J Neurosci. 2001;21:5328. doi: 10.1523/JNEUROSCI.21-14-05328.2001. [DOI] [PMC free article] [PubMed] [Google Scholar]; Chacron MJ, Longtin A, Maler L. Neurocomputing. 2001;38:129. [Google Scholar]
- 9.Chacron MJ, Lindner B, Longtin A. Phys Rev Lett. 2004;92:080601. doi: 10.1103/PhysRevLett.92.080601. [DOI] [PubMed] [Google Scholar]; Chacron MJ, Lindner B, Longtin A. 2004;93:059904(E). ibid. [Google Scholar]; Chacron MJ, Lindner B, Longtin A. Fluct Noise Lett. 2004;4:L195. doi: 10.1103/PhysRevLett.92.080601. [DOI] [PubMed] [Google Scholar]
- 10.Lindner B, Chacron MJ, Longtin A. Phys Rev E. 2005;72021911 doi: 10.1103/PhysRevE.72.021911. [DOI] [PMC free article] [PubMed] [Google Scholar]
- 11.Norsworthy SR, Schreier R, Temes GC, editors. Delta-Sigma Data Converters. IEEE Press; Piscataway, NJ: 1997. [Google Scholar]
- 12.Shin J. Int J Electron. 1993;74:359. [Google Scholar]; Shin J. Neural Networks. 2001;14:907. doi: 10.1016/s0893-6080(01)00077-6. [DOI] [PubMed] [Google Scholar]
- 13.Mar DJ, et al. Proc Natl Acad Sci USA. 1999;9610450 [Google Scholar]
- 14.Risken H. The Fokker-Planck Equation. Springer; Berlin: 1996. [Google Scholar]
- 15.Rieke F, et al. Spikes: Exploring the Neural Code. MIT Press; Cambridge, MA: 1996. [Google Scholar]
- 16.Chacron MJ, Longtin A, Maler L. Phys Rev E. 2005;72051917 doi: 10.1103/PhysRevE.72.051917. [DOI] [PMC free article] [PubMed] [Google Scholar]
- 17.Shannon R. Bell SystTechJ. 1948;27:379. [Google Scholar]; Cover T, Thomas J. Elements of Information Theory. Wiley; New York: 1991. [Google Scholar]
- 18.Borst A, Theunissen F. Nat Neurosci. 1999;2947 doi: 10.1038/14731. [DOI] [PubMed] [Google Scholar]
- 19.Chacron MJ, Longtin A, Maler L. Network. 2003;14:803. [PubMed] [Google Scholar]; Passaglia CL, Troy JB. J Neurophysiol. 2004;91:1217. doi: 10.1152/jn.00796.2003. [DOI] [PMC free article] [PubMed] [Google Scholar]; Marsat G, Pollack GS. J Neurosci. 2005;25:6137. doi: 10.1523/JNEUROSCI.0646-05.2005. [DOI] [PMC free article] [PubMed] [Google Scholar]; Chacron MJ, et al. Nature (London) 2003;423:77. doi: 10.1038/nature01590. [DOI] [PubMed] [Google Scholar]; Chacron MJ, Maler L, Bastian J. J Neurosci. 2005;25:5521. doi: 10.1523/JNEUROSCI.0445-05.2005. [DOI] [PMC free article] [PubMed] [Google Scholar]; Chacron MJ. J Neurophysiol. 2006;95:2933. doi: 10.1152/jn.01296.2005. [DOI] [PMC free article] [PubMed] [Google Scholar]; Ellis LD, et al. 2007;98:1526. doi: 10.1152/jn.00564.2007. ibid. [DOI] [PMC free article] [PubMed] [Google Scholar]; Sadeghi S, et al. J Neurosci. 2007;27:771. doi: 10.1523/JNEUROSCI.4690-06.2007. [DOI] [PMC free article] [PubMed] [Google Scholar]; Chacron MJ, Bastian J. J Neurophysiol. 2008;99:1825. doi: 10.1152/jn.01266.2007. [DOI] [PMC free article] [PubMed] [Google Scholar]; Krahe R, Bastian J, Chacron MJ. 2008;100:852. doi: 10.1152/jn.90300.2008. ibid. [DOI] [PMC free article] [PubMed] [Google Scholar]
- 20.Doiron B, Lindner B, Longtin A, Maler L, Bastian J. Phys Rev Lett. 2004;93:048101. doi: 10.1103/PhysRevLett.93.048101. [DOI] [PubMed] [Google Scholar]; Lindner B, Doiron B, Longtin A. Phys Rev E. 2005;72:061919. doi: 10.1103/PhysRevE.72.061919. [DOI] [PubMed] [Google Scholar]
- 21.Holden AV. Models of the Stochastic Activity of Neurons. Springer; Berlin: 1976. [Google Scholar]
- 22.Chacron MJ, Lindner B, Longtin A. J Comput Neurosci. 2007;23301 doi: 10.1007/s10827-007-0033-y. [DOI] [PMC free article] [PubMed] [Google Scholar]
- 23.Stocks NG. Phys Rev Lett. 2000;842310 doi: 10.1103/PhysRevLett.84.2310. [DOI] [PubMed] [Google Scholar]
- 24.Nelson ME, MacIver MA. J Exp Biol. 1999;2021195 doi: 10.1242/jeb.202.10.1195. [DOI] [PubMed] [Google Scholar]
- 25.Goldberg JM, Smith CE, Fernandez C. J Neurophysiol. 1984;511236 doi: 10.1152/jn.1984.51.6.1236. [DOI] [PubMed] [Google Scholar]
- 26.Braitenberg V, Schüz A. Anatomy of the Cortex. Springer; Berlin: 1991. [Google Scholar]; McGuire BA, et al. J Neurosci. 1984;4:3021. doi: 10.1523/JNEUROSCI.04-12-03021.1984. [DOI] [PMC free article] [PubMed] [Google Scholar]; Kisvarday ZF, et al. Exp Brain Res. 1986;64:541. doi: 10.1007/BF00340492. [DOI] [PubMed] [Google Scholar]
- 27.Hutcheon B, Yarom Y. Trends Neurosci. 2000;23:216. doi: 10.1016/s0166-2236(00)01547-2. [DOI] [PubMed] [Google Scholar]


