Abstract
Purpose
To assess the antiangiogenic effect of bumetanide with dynamic contrast enhanced (DCE)-MRI and a biodegradable macromolecular MRI contrast agent.
Methods
A new polydisulfide containing macrocyclic gadolinium (Gd(III)) chelates, poly([(Gd-DOTA)-DETA]-co-DTBP) (GODP), was synthesized as a safe biodegradable macromolecular MRI contrast agent for DCE-MRI. Nude mice bearing flank HT29 colon cancer xenografts were then treated daily with either bumetanide or saline for a total of 3 weeks. DCE-MRI was performed before and after the treatment weekly. The DCE-MRI data were analyzed using the adiabiatic approximation to the tissue homogeneity (AATH) model to assess the change of tumor vascularity in response to the treatment. Immunohistochemistry (IHC) and western blot were performed to study tumor angiogenic biomarkers and hypoxia.
Results
DCE-MRI with GODP revealed that bumetanide reduced vascular permeability and plasma volume fraction by a significantly greater extent than the saline control therapy after 3 weeks of therapy. These changes were verified by the significant decline of CD31 and VEGF expression in the bumetanide treatment group. Despite a significant regression in vascularity, the tumors remained highly proliferative. Overexpression of the transcription factor HIF-1α in response to elevated hypoxia is thought to be the driving force behind the uninterrupted tumor expansion.
Conclusion
This study demonstrated the effectiveness of DCE-MRI with GODP in detecting vascular changes following the administration of bumetanide. Bumetanide has the potential to curtail growth of the tumor vasculature and can be employed in future therapeutic strategies.
Keywords: dynamic contrast-enhanced MRI, anti-angiogenesis, bumetanide, cancer therapy, polydisulfide
Introduction
DCE-MRI is a robust imaging methodology that is commonly used to non-invasively characterize changes in tumor vascularity and to assess the therapeutic efficacy of anticancer strategies (1, 2). Angiogenic tumor vasculature is known to be very leaky, owing to the fact that they contain large gaps in the endothelial and basement membrane linings of the blood vessels (3, 4). Quantitative pharmacokinetic analysis of contrast agent uptake in regions of interest provides parametric values that reflect underlying physiological and anatomical properties of the vasculature. Such measures are extremely valuable due to their insensitivity to variations in the imaging protocols that may be used in separate studies (5, 6). However, the ability to accurately quantify the vascular parameters in DCE-MRI relies on the use of a proper contrast agent. Low molecular weight clinical agents (LMCM) (<1000 Da), such as Gd-DTPA, have been commonly utilized in DCE-MRI studies. Although they are readily excreted through the kidneys, LMCMs are not optimal for this imaging technique since they can non-selectively extravasate from both the normal and tumor vasculature. In addition, studies have shown that their extremely high diffusional rates can mask small physiological changes in permeability and plasma volume fraction that may occur during anti-angiogenic therapies, limiting the robustness of these vascular parameters as informative biomarkers (7, 8). Therefore, macromolecular Gd-based contrast agents (MMCM) are preferable for DCE-MRI since their large size (>20 kDa) limits extravasation strictly to the hyperpermeable vessels within the tumor, thus slowing diffusion into the interstitium to make the pharmacokinetic modeling analysis more sensitive to vascular remodeling events (9). Unfortunately, there are inherent safety concerns regarding the use of MMCMs since they are too large for renal excretion (>5 nm).
We previously developed a new class of biodegradable macromolecular contrast agents based on polydisulfide Gd(III) complexes that is excreted more readily than traditional MMCM to alleviate potential toxicity issues. Degradation of these polydisulfide contrast agents gradually occurs as endogenous thiols in the blood plasma effectively break the disulfide bonds in the polymeric backbones, facilitating degradation into low molecular weight monomeric subunits for fast renal excretion (10). In addition, we demonstrated that DCE-MRI with such biodegradable macromolecular agents provides a more accurate assessment of tumor vascularity and therapeutic response to anticancer treatments than low molecular weight alternatives (11, 12). However, the reported polydisulfide Gd(III) contrast agents were originally composed of linear Gd-DTPA bisamide subunits, which possess low chelating stability. Therefore, we recently synthesized a polydisulfide agent that incorporated macrocyclic Gd(III) chelates to improve stability (13). In this study, we further optimized the structure of our latest contrast agent by incorporating symmetric monomeric subunits into the polymeric backbone.
Bumetanide is an FDA approved inhibitor of the Na+-K+-2Cl− (NKCC1) cotransporter, which is responsible for modulating the volume changes in cells (14). NKCC1 is able to exert such an effect by actively pumping sodium, potassium, and chloride ions into the cells, driving an additional influx of water to maintain osmotic equilibrium (15). Although bumetanide is a traditional loop diuretic in the clinic, several groups have discovered that bumetanide displays a few features that could ultimately be exploited for cancer therapy. By blocking the NKCC1 cotransporter, bumetanide has shown the ability to suppress the proper volume regulation required to support tumor growth and migration in an orthotopic glioma model (16). Bumetanide is also able to increase glioma sensitivity to chemotherapeutics by preventing the tumor’s ability to resist the significant cellular volume loss that occurs at the onset of apoptosis (17). Lastly, by inhibiting the volume increase that accompanies cell growth and division, bumetanide can effectively slow down the transition between the G1 and S phases of the cell cycle to decrease the overall rate of proliferation (18, 19). Together, these changes have the potential to greatly affect tumor progression and viability, although there is currently limited information detailing how bumetanide affects the development of various types of tumors.
Here, we synthesized a new macrocyclic agent, poly([(Gd-DOTA)-DETA]-co-DTBP) (GODP), by condensation polymerization of DETA-DOTA and dithiobispropionic acid (DTBP) NHS ester, followed by complexation with Gd(III) ions. We then investigated the therapeutic efficacy of bumetanide in treating cancer by utilizing DCE-MRI with GODP in a subcutaneous HT29 colon cancer mouse model, which is known to express the NKCC1 co-transporter. In order to analyze the DCE-MRI data, the adiabatic approximation to the tissue homogeneity (AATH) model was used to parametrically calculate blood flow (Fp), permeability-surface area product (PS), and volume fraction of the plasma space (Vp) values within the tumor tissue (20). Histological analysis of CD31 and vascular endothelial growth factor (VEGF) expression was also performed upon completion of the bumetanide therapy in order to validate the DCE-MRI quantitative results.
Materials and Methods
Diethylenetriamine (DETA), [2-(tert-butoxycarbonyloxyimino)-2-phenylacetonitrile] (BOC-ON), N,N-diisopropylethylamine (DIPEA), formic acid, sodium hydroxide (NaOH), 3,3′-dithiobis(sulfosuccinimidylpropionate) (DTSSP), and gadolinium(III) acetate were all purchased from Sigma-Aldrich (St. Louis, MO). Ethyl acetate, hexane, dimethylformamide (DMF), dichloromethane (DCM) and tetrahydrofuran (THF) were purchased from Fisher Scientific (Waltham, MA). Benzotriazol-1-yl-oxytripyrrolidinophosphonium hexafluorophosphate (PyBOP) was purchased from Chem-Impex International, Inc (Wood Dale, IL). Primary antibodies for HIF-1α and CD31 were purchase from Novus Biologicals (Littleton, CO) and Abcam (Cambridge, MA), respectively, while the primary antibody for β-actin was purchased from Cell Signaling (Danvers, MA). The secondary antibodies Dk-anti-Rb-HRP and Dk-anti-Rb-Alexa647 were purchased from Jackson ImmunoResearch (West Grove, PA). The pimonidazole hypoxia stain was supplied by Hypoxyprobe Inc. (Burlington MA).
Synthesis of poly([(Gd-DOTA)-DETA]-co-DTBP)(GODP)
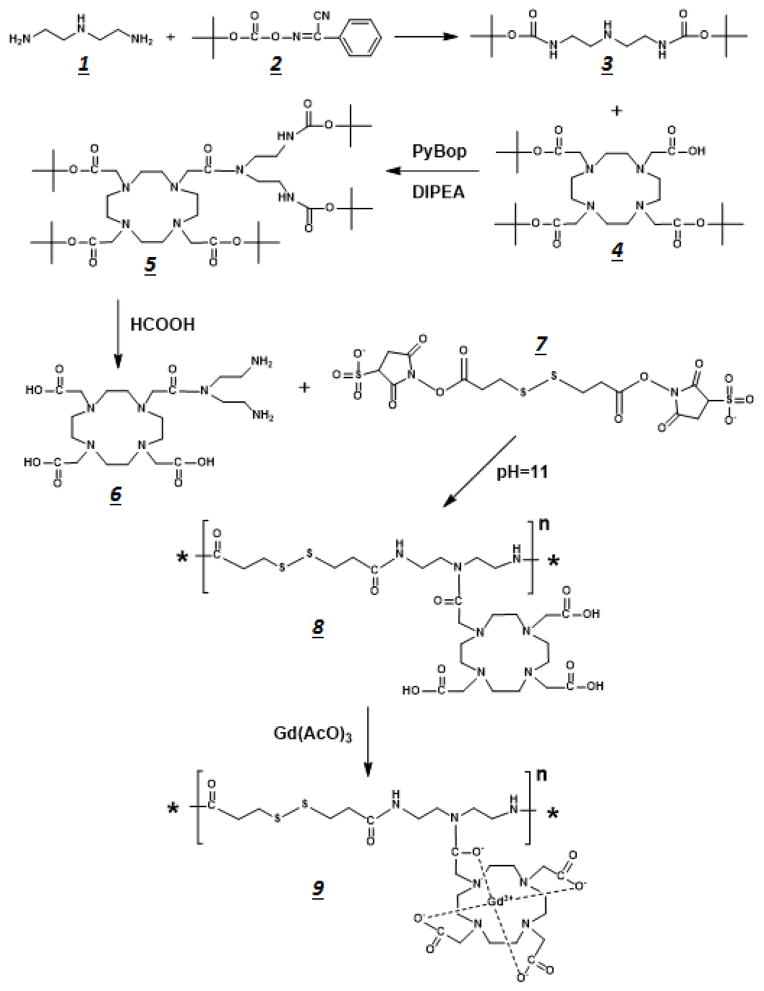
The synthetic reaction scheme for the biodegradable macromolecular contrast agent is presented in Figure 1. DETA (1) (1.03 g, 10 mmol) was dissolved in 10 mL anhydrous THF and bubbled with nitrogen for 20 min. At 0°C, a 3x excess of Boc-ON (2), dissolved in 15 mL anhydrous THF, was added drop-wise into the DETA solution. The mixture was stirred at this temperature for another 2 h. The solvent was removed under vacuum and the product DiBoc-DETA (3) was purified using column chromatography with an ethyl acetate: hexane mobile phase at a 1:15 ratio (yield = 90%).
Figure 1.
Reaction scheme used to synthesize the GODP macromolecular contrast agent for DCE-MRI techniques.
DiBoc-DETA (3) (1.8 g, 5.95 mmol) was dissolved into 20 mL anhydrous DMF. TB-DOTA (4) (1.8 g, 3.14 mmol) was then added into this solution, along with PyBOP (2.45 g, 4.71 mmol) and DIPEA (0.65 g, 4.71 mmol) to catalyze the coupling reaction. After reacting overnight at room temperature, the solvent was removed under vacuum and DiBoc-DETA-DOTA (5) was purified by column chromatography using an ethyl acetate: DCM mobile phase (1:15, yield = 85%). DiBoc-DETA-DOTA (5) (2.0 g) was dissolved into 30 mL formic acid and stirred at 50°C to remove the Boc protecting groups. Upon completion, the formic acid was removed under vacuum and DOTA-DETA (6) was purified with column chromatography using an ethyl acetate: DCM mobile phase (10:1, yield = 95%).
DETA-DOTA (6) (0.29 g, 0.5 mmol) was dissolved in 0.8 mL DI water. Afterwards, the basicity of this solution was adjusted to pH 11 with saturated NaOH solution. DTSSP (7) (0.35 g, 0.56 mmol) was then added into the DETA-DOTA solution gradually over 30 minute. The NHS active esters on each end of the DTSSP were allowed to react to the amine groups on both ends of the DETA-DOTA structure at room temperature overnight to form a polymeric structure. The polymer poly([DOTA-DETA]-co-DTBP) (8) was then purified with a PG-50 column (yield = 20%). Poly([DOTA-DETA]-co-DTBP) was then dissolved in DI water and mixed with a 1.5 molar excess of gadolinium(III) acetate with respect to the ligand concentration. The mixture was adjusted to pH 6, and the reaction proceeded for 12 hours. The pH was monitored every two hours to ensure that pH remained constant. The final product, poly([(Gd-DOTA)-DETA]-co-DTBP) (GODP) (9), was purified with dialysis and then lyophilized. The number and weight average molecular weights of GODP were 19 and 21 kDa as determined on a GE FPLC system with an analytic Superose 12 column.
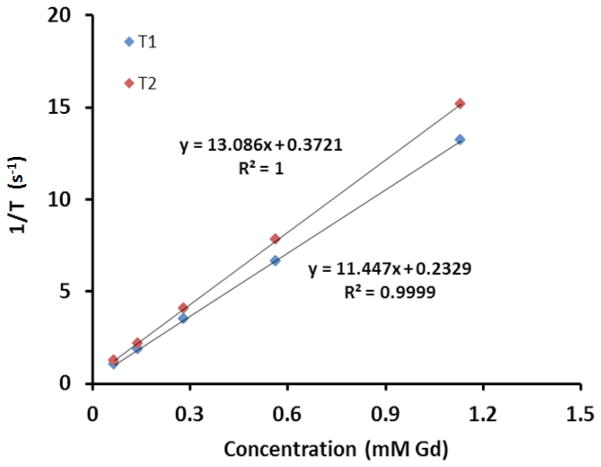
The relaxation rates 1/T1 and 1/T2 of GODP at five different concentrations were measured on a Bruker Medical Minispec machine at 1.5T. Longitudinal and transverse relaxivities (r1 and r2) of the GODP contrast agent were equal to the slopes of the linear curves obtained by plotting the measured 1/T1 and 1/T2 relaxation rates versus Gd concentration, as shown in Figure 2.
Figure 2.
Plot of the relaxation rate versus GODP concentration at 1.5T. The above curves demonstrate that the GODP contrast agent has a T1 relaxivity (r1) of 11.45 mM−1s−1 and a T2 relaxivity (r2) of 13.09 mM−1s−1.
Treatment with bumetanide in a mouse tumor model
The anti-angiogenic effects of bumetanide were investigated in a mouse model bearing subcutaneous HT29 colon adenocarcinoma xenografts. HT29 cells were initially cultured in McCoy’s 5A growth media (ATCC, Manassas, VA), supplemented with 10% FBS, 100 μg/mL of streptomycin, and 100 units/mL of penicillin (Invitrogen, Carlsbad, CA). A total of 1×10⁶ cells were then inoculated into athymic nude mice in a 250 μL volume of Matrigel (BD Bioscienes, San Jose, CA). Tumors were allowed to grow for 10 days until they were approximately 0.5 cm in diameter prior the treatment. A group of three mice was treated with bumetanide, and the other three with a saline control. The drug and saline were injected intraperitoneally on a daily basis for 3 weeks, with a bumetanide dose of 10 mg/kg. All mice were sacrificed on day 21 of the treatment regimen. Tumor growth was measured at several time points during the therapy with a caliper. Volumes were calculated using the formula (1/6)πD12D22, where D1 and D2 were two diameters measured along perpendicular axes of the tumor lesion.
DCE-MRI
Changes in the tumor vascularity were monitored during the treatment by DCE-MRI in both groups. Baseline data were acquired from each mouse before the therapies. The mice were then imaged on days 7, 14, and 21 during the treatment. Each mouse was catheterized in the tail vein using a 30 gauge needle connected to a tubing approximately 1.5 meters long. The mice were then placed inside the scanner, where they were kept under constant anesthesia using isoflurane and constant temperature (37°C). DCE-MRI acquisition was carried out on a Bruker 7T system using a cylindrical radiofrequency volume coil that was 72 mm in diameter. Once inside the scanner, the mice were properly positioned with the aid of a simple tri-pilot sequence. Afterwards, a set of 17 2D axial images were acquired using a spin-echo sequence to identify the center position of the tumors for ensuing DCE-MRI. DCE-MRI acquisition commenced using a 3-dimensional FLASH gradient echo sequence with the following parameters: TR = 10 ms, TE = 1.05 ms, flip angle = 15°, number of average = 1, FOV = 3.53 cm × 3.53 cm × 2.04 cm, and pixel matrix size = 128 × 96 × 17. The spatial resolution was 0.276 mm × 0.368 mm × 1.2 mm. Images were acquired for 90 seconds prior to the GODP bolus injection in order to obtain a baseline signal intensity. The contrast agent was then injected manually into the tail vein at a dose of 0.1 mmol Gd/kg in saline (100μL) within 5 seconds. A total of 400 scans were then acquired at a temporal resolution of 4.32 seconds. The entire scan time lasted for 28 min 48 sec.
DCE-MRI data analysis using the AATH model
After the DCE-MRI was complete, two different slices were extracted from 3D scans we acquired. One slice was selected to analyze the tumor, and the other slice was selected so that it contained a major artery in the body near the tumor tissue. Signal enhancement values (ΔSI) were calculated for each pixel in these slices to account for the change in signal intensity over time by GODP. The general equation ΔSI(t) = [S(t)−S0]/S0 was used for this calculation, where S(t) is the signal intensity in the image at time ‘t’, and S0 is the average baseline signal intensity during the 90 second scan prior to GODP injection. We assumed that ΔSI was proportional to the GODP concentration, which is a typical approximation when utilizing low concentrations that are within the linear range (21).
Contrast-enhanced time curves were created for both the tumor and the artery by plotting ΔSI versus scan time. Parametric non-linear curve-fitting was performed in MATLAB to mathematically fit the contrast-enhanced time curves to the AATH model in order to calculate the changes in blood flow, permeability, and plasma volume fraction that occurred during the bumetanide and saline control treatments (20). The parametric analysis was accomplished using average contrast-enhanced data from ROIs that covered the entire tumors. It was also done on a pixel-by-pixel basis to gather spatial heterogeneity information for each parameter.
The AATH model is a simplified form of its parent tissue homogeneity model, with the approximation that the concentration of contrast agent changes much slower in the extravascular space due to diffusion, than it does in the intravascular space due to blood flow (22). This assumption decouples the intra- and extra-vascular compartments, and as a result, the impulse response function RAATH (Figure 1) possesses two separate phases, whereby:
| (1) |
Here, the capillary transit time Tc = Vp/Fp, and the extraction coefficient E = 1−exp(−PS/Fp). The concentration in the tumor tissue Ct was found by convolving the impulse response function with the arterial input function Ca, so that Ct(t) = FpCa(t)*RAATH (22). The arterial input function was equal to the contrast-enhanced time curve from the center pixel of the artery.
Immunohistochemistry and western blotting
Once the final DCE-MRI scans were complete, the mice were intravenously injected with 60 mg/kg of pimonidazole, an established marker for tissue hypoxia. After one hour following the pimonidazole staining, the mice were sacrificed and tumors were resected for biological analysis. Half of each tumor that we collected was snap-frozen in liquid nitrogen for western blot, while the other half was sliced into thin sections and formalin-fixed/paraffin-imbedded for IHC staining. For western blot, cell lysates from the frozen tissue were prepared by homogenizing entire tumor tissues in RIPA lysis buffer supplemented with a Halt protease inhibitor cocktail (Thermo Fisher Scientific). A total of 50 μg protein from whole tumor lysate was loaded into each well of a 12% TGX gel, and after SDS-PAGE, the separated protein extracts were transferred onto a PVDF membrane (BioRad). The blots were blocked for 1 hr and then stained overnight at 4°C with primary antibodies for HIF-1α and β-actin, the latter of which serving as the housekeeper control. Image J software was utilized to quantify the relative protein expression of HIF-1α from the blots by calculating the total pixel intensity from each protein band, and then normalizing these signals with its corresponding β-actin stain. Sections of the formalin-fixed tissue were stained with the antibodies for CD31 and the Ki67 nuclear proliferation marker. They were also stained with a primary antibody for the detection of the pimonidazole hypoxia marker. All of the primary antibodies used in this study were produced in rabbits, and were thus paired with donkey anti-rabbit secondary antibodies, either conjugated to a horseradish peroxidase for western blot, or to an AlexaFluor-647 dye for IHC. The primary antibody for pimonidazole was conjugated to a FITC label, and therefore did not require a secondary antibody.
Statistical Analysis
Statistical analyses were performed using unpaired two-tailed Student’s t-tests with a 95% confidence interval, assuming equal variances. Probability values of p<0.05 were considered to be statistically significant. Mean data values from this study are reported with their standard deviations (mean ± SD).
Results
Synthesis of biodegradable GODP polymer
The biodegradable macromolecular contrast agent GODP was designed to improve chelation stability, by incorporating macrocyclic Gd(III) chelates, and to facilitate excretion from the body after imaging. It was synthesized according to the multi-step chemical reaction scheme illustrated Figure 1. DETA was conjugated to the macrocyclic ligand DOTA to give DOTA-DETA, which possessed two available primary amine groups for polymerization. DOTA-DETA was then copolymerized with the disulfide-containing active ester monomer DTSSP to obtain the polymer poly(DOTA-DETA-co-DTBP). The final contrast agent poly[(Gd-DOTA)-DETA-co-DTBP] (GODP) was then synthesized by complexing the polymeric ligand with Gd(III). According to the graphical analysis presented in Figure 2, the r1 and r2 relaxivities of this imaging agent were 11.45 and 13.09 mM−1s−1 at 1.5T, respectively.
DCE-MRI assessment of tumor vascularity
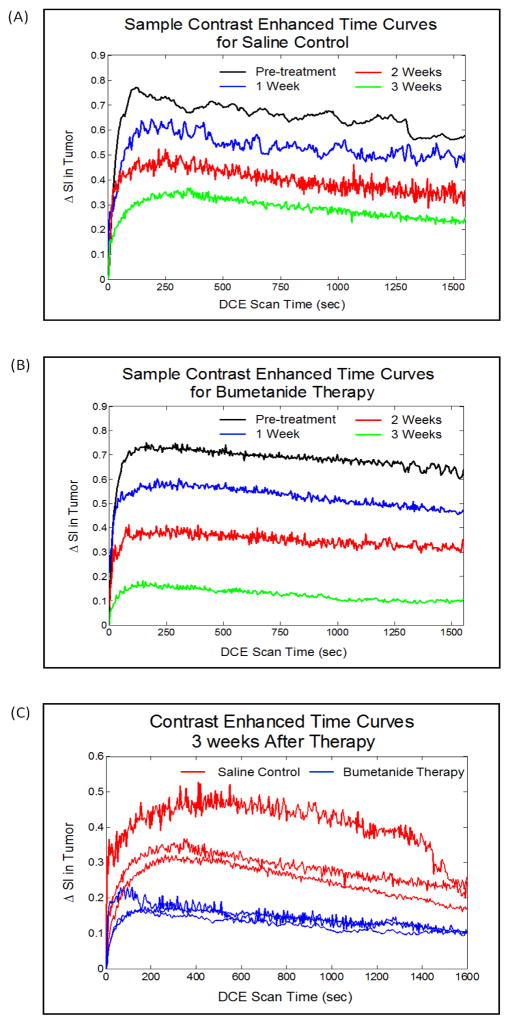
Average signal enhancement time curves were constructed for each individual mouse using DCE-MRI data gathered within regions-of-interest that covered the entire tumor tissue. Figure 4A and 4B shows representative sets of signal enhancement time curves that were obtained from the saline control and bumetanide treatment groups respectively. The images in each of these figures were acquired at weekly imaging time points both before and after the treatment regimens commenced. Meanwhile, Figure 4C displays the signal enhancement time curves that were obtained from all the mice in both groups at the completion of the 3-week treatment period. By simply analyzing the peak enhancements from both treatment groups in this set of images, it is evident that the degree of GODP contrast agent uptake was significantly lower in the bumetanide-treated tumors than in the control tumors, suggesting that tumor vascularity was significantly reduced by the NKCC1 inhibitor.
Figure 4.
The images in (A) and (B) are contrast-enhanced time curves obtained from a single representative mouse in the saline control and bumetanide-treated groups, respectively. The contrast enhanced-time curves in (C) were obtained from all of the mice in this study at the 3-week time point and show that the tumor uptake of GODP contrast agent is significantly compromised by the bumetanide therapy, suggesting a regression in tumor vascularity.
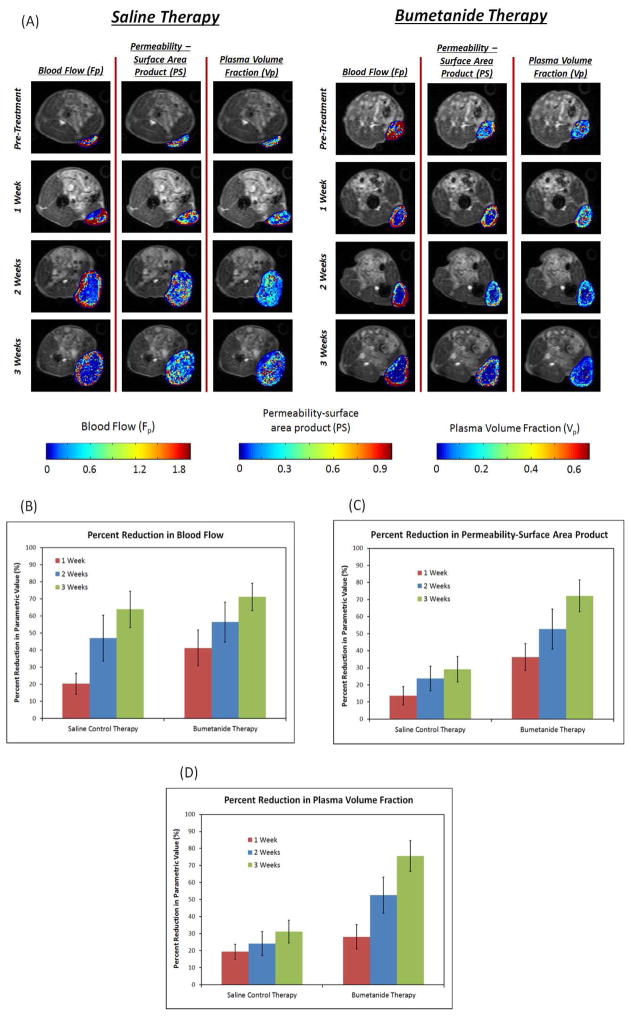
The DCE-MRI data was then parametrically fitted to the AATH tracer kinetic model (Figure 3, Equation 1) in order to quantitatively characterize how the bumetanide therapy anatomically and physiologically affected tumor vascularity. The blood flow rate (Fp), permeability-surface area product (PS), and fractional plasma volume (Vp) of the tumor vasculature were all calculated on a pixel-by-pixel basis, and also on a macroscopic level using average signal intensity data from regions-of-interest spanning entire tumor areas. Figure 5A shows a representative set of Fp, PS, and Vp pixel mappings that were collected from both treatment groups at each time point over the 3-week treatment period, while Figures 5B, 5C, and 5D display their respective average values. Prior to the start of treatment, each tumor from both groups was uniformly well perfused and well vascularized, while also exhibiting high permeability. Throughout the 3-week treatment period, all three of the vascular parameters we analyzed decreased from their pre-treatment levels in both the bumetanide and saline control groups. However, according to the quantitative data presented in Figure 5, the degree at which these parameters decreased were not necessarily the same for each therapy during the course of the study. In addition, the spatial variations of the above vascular parameters also differed between the two treatment groups.
Figure 3.
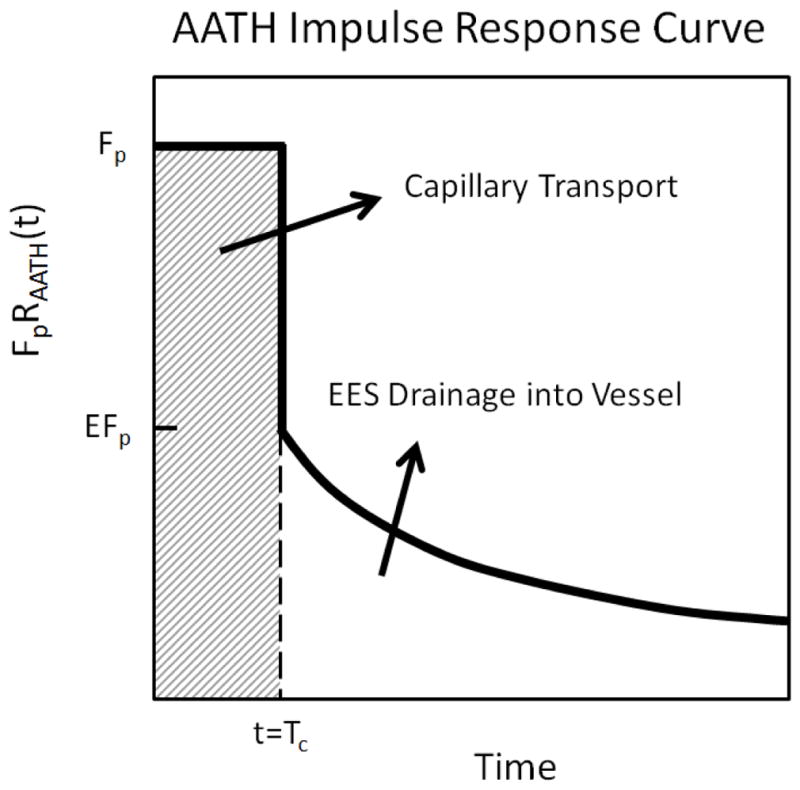
Graphical representation of the AATH impulse response function that was used for DCE-MRI parametric analysis.
Figure 5.
The parametric mappings in (A) were constructed by applying the AATH model to DCE-MRI signal intensity data on a pixel-by-pixel basis. The images display spatial variations in the Fp, PS, and Vp vascular parameters that occurred over time for both the saline control and bumetanide treatment groups. Average parametric values were calculated at each time point from regions-of-interest that covered the entire tumor lesions. Percent reductions from pre-treatment levels are reported for each of these vascular parameters in (B), (C), and (D) above. The data here reveals that the bumetanide therapy had a significantly greater effect on the PS (p=0.003) and Vp (p=0.002) parameters by the end of the 3-week treatment period, compared to the saline control therapy. However, no significant differences were observed in Fp.
After one week of daily bumetanide treatments, there was a significant reduction in the Fp and PS parameters within the tumor interior, as the values of these two parameters were much greater along the tumor periphery. However, this distribution profile was not observed for the Vp parameter, nor was it observed for any of the parameters from the saline control group. Instead, the magnitudes of each of these parameters appeared to remain relatively uniform throughout the tumor tissue, resembling their respective pre-treatment profiles. Average parametric value calculations from our analysis supported these observations. We discovered that the average Fp and PS parameters were 41.3 ± 10.5% and 36.3 ± 7.9% lower than their pre-treatment levels in the bumetanide treatment group, and only 20.3 ± 6.2% and 13.7 ± 5.3% lower in the saline control group, respectively. The differences in these parameters between the two treatment groups were found to be significant, with p = 0.041 for Fp and p = 0.014 for PS. Meanwhile, the average Vp was 28.2 ± 7.1% lower in the bumetanide group and 19.37 ± 4.5% lower in the control group than their respective pre-treatment levels, although the difference between these two groups was not significant (p = 0.143).
After two weeks of therapy, the Vp parametric values greatly reduced in the cores of the bumetanide-treated tumors, resembling the distribution patterns that were discovered in the Fp and PS mappings. Together, the changes observed in the spatial distribution of these three parameters demonstrated the gradual vascular regression that occurred during the first two weeks of daily bumetanide administration. On average, the bumetanide therapy caused the Vp parametric value to be significantly lower than that of the saline control group at the 2-week time point. The average Vp was found to decrease by 52.6 ± 10.6% from its pre-treatment level in the bumetanide group, and by 24.1 ± 7.1% in the control group (p = 0.0179).
In addition, the parametric mappings in Figure 5A show that Fp also reduced in the tumor cores of the control group after two weeks of therapy, displaying a similar pattern to that observed in the bumetanide treatment group. As a result, the average Fp parameters from both therapies were no longer statistically different from one another, contrary to similarity that was observed at the 1-week time point. Instead, the average Fp for the bumetanide group was now 56.4 ± 11.7% lower than its pre-treatment level, while the average value for the saline control group was reduced by 47.0 ± 13.4% (p = 0.411).
By the end of the 3-week therapeutic study, the control mice continued to maintain the rather uniform spatial distribution pattern in the PS and Vp mappings that was observed in the pre-treatment images. The presence of such widespread vessel coverage and vascular permeability, albeit at somewhat lower levels, suggests that angiogenesis persisted throughout the entire tumor lesions during this study. However, in the bumetanide-treated group, the magnitudes of the PS and Vp values remained significantly lower within the tumor cores between the 2-week and 3-week time points, thus implying that the drug was able to induce and sustain its anti-angiogenic capabilities until the end of the administration period. Following 3 weeks of therapy, the average reduction in PS and Vp from pre-treatment levels was 29.2 ± 7.4% and 31.3 ± 6.7%, respectively, for the control, while bumetanide was able to induce reductions of 72.2 ± 9.3% and 75.6 ± 9.0%, indicating that the latter had a significantly greater inhibitory effect on tumor vascularity (p = 0.003 for PS and p = 0.002 for Vp). During the third week of treatment, bumetanide also appeared to further reduce Vp along the tumor periphery, although this was not necessarily the case for PS parameter.
Despite the apparent differences in the PS and Vp mappings between the two treatment groups after 3 weeks of treatment, a similar inhibitory effect on the average Fp parameter value was not observed. The presence of significantly lower Fp values in the tumor interior continued between the second and third week of the study for both the bumetanide and the control groups. Such spatial distribution patterns demonstrate that the majority of the blood flow was concentrated to the outer rim of the tumor lesions, regardless of the administered treatment. Macroscopically, the magnitude of this parameter decreased from pre-treatment levels by an average of 63.9 ± 10.6% in the control group and by 71.2 ± 8.0% in the bumetanide group (p = 0.397), further supporting the fact that bumetanide did not have a significant effect on average tumor blood flow by the end of the 3-week administration period.
Bumetanide reduces CD31 and VEGF expression in tumor tissue
Following the completion of each treatment regimen, IHC analysis of tumor vasculature revealed a significant decrease in CD31 expression in response to bumetanide, indicating that the drug caused a regression in the blood vessel network. Figure 6 shows that the number of vessels in both the tumor periphery and core regions was significantly lower in the bumetanide group than in the saline control group. This finding is similar to the results that were obtained from the quantitative DCE-MRI data analysis presented in Figure 5, which showed that the bumetanide therapy was responsible for reducing the Vp parameter as well. Together, the 3-week CD31 and Vp biomarker data appear to validate one another. Not surprisingly, we also discovered that the decrease in CD31 expression coincided with an elevation of tumor hypoxia levels. This was evident by the increased signal intensity in the representative pimonidazole stainings that are displayed in Figure 6.
Figure 6.
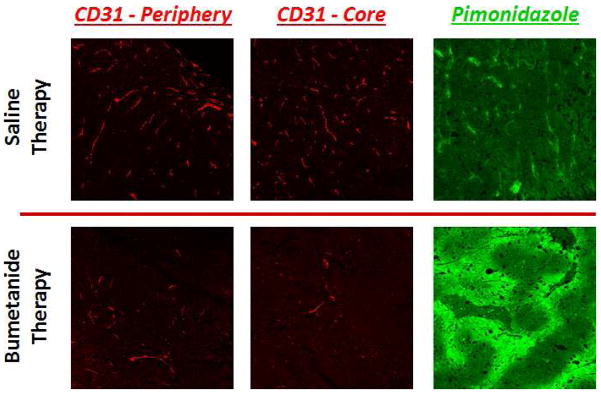
IHC stains for CD31 expression (red) reveal that vascularity is significantly compromised in both the periphery and core tissue of bumetanide-treated tumors, compared to those treated with the saline control. Not surprisingly, the decrease in CD31 levels coincided with an increase in tumor hypoxia, as evidenced by the increase in pimonidazole staining intensity (green).
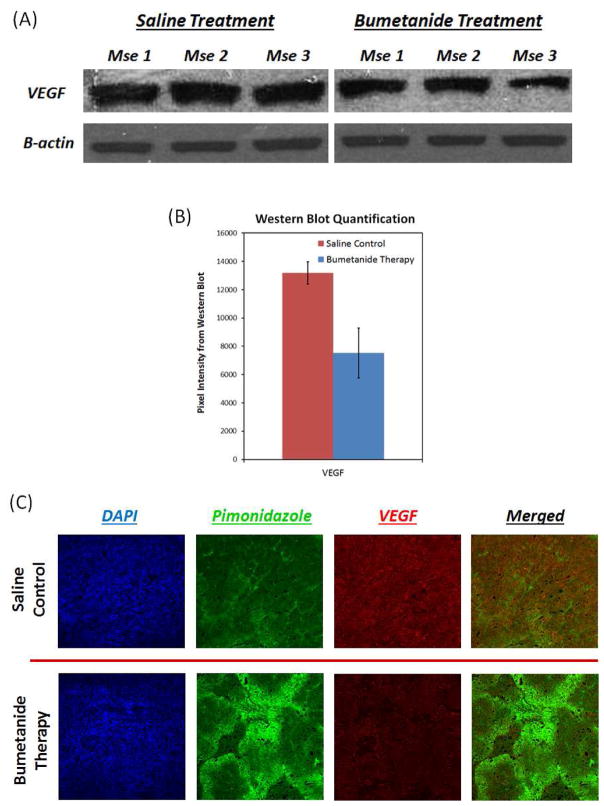
In addition to CD31, VEGF, a common proangiogenic growth factor in tumors, was also significantly reduced in response to bumetanide compared to the saline control. Figure 7 shows that VEGF protein levels were an average of 42.9% lower in the bumetanide-treated group upon completion of the 3 week treatment (p = 0.021), and that a reduction in this growth factor also coincided with an increase in tumor hypoxia. The decline in VEGF production may be responsible for the reduction in CD31 expression and blood vessel coverage in response to the bumetanide therapy.
Figure 7.
Western blot data in (A) and (B) reveal that VEGF expression was 42.9% lower in the bumetanide-treated tumors than in the control tumors after 3 weeks of therapy (p=0.021). The IHC images in (C) support this result and show that, much like CD31, a decrease in VEGF expression (red) is associated with greater levels of hypoxia (green).
Tumor growth rate and Ki67 expression remain unchanged after bumetanide therapy
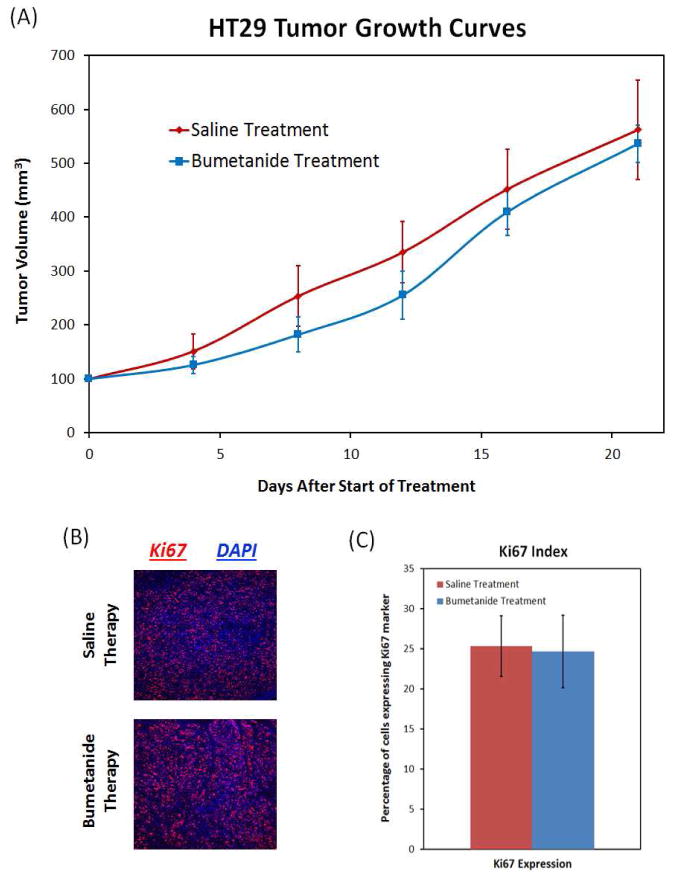
Despite the fact that bumetanide was able to inhibit angiogenesis and induce vascular regression, while lowering the Vp and PS DCE-MRI parameters, the drug was not able to slow down the tumor growth rate over the course of the study. Although the growth curves in Figure 8A show that the bumetanide-treated tumors were slightly smaller than their control counterparts at Day 8 and Day 12 of the study, statistical analysis revealed that there were no significant differences in average tumor volume at these two time points (p = 0.13 and p = 0.13, respectively). This slight variation in tumor volumes was short-lived, and by Day 21, the bumetanide and control tumors were nearly equal in size. By the end of the treatment period, the average tumor volume was 563 ± 35 mm3 in the bumetanide group and 562 ± 92 mm3 in the saline control group (p = 0.673). In support of this result, the IHC analysis in Figure 8B revealed that expression of the nuclear cell proliferation marker Ki67 also did not change in response to the bumetanide therapy. Expression of Ki67 is widely used as a biomarker to determine the proliferative capacity of a tumor. A Ki67 index value was created by determining the percentage of nuclei in a given area of tissue that expressed this protein. The Ki67 index was approximately 25.3 ± 3.8% and 24.7 ± 4.5% for the control and bumetanide-treated tumors, respectively, suggesting that the tumors in each group were equally proliferative (Figure 8C).
Figure 8.
The bumetanide therapy did not exhibit any significant effects on tumor growth and proliferation. Tumor size remained unchanged during the course of the treatment period in comparison to the control tumors (A). IHC staining of the proliferation marker Ki67 also did not show a significant difference between the two groups (B and C).
Bumetanide increases HIF-1α expression in tumor tissue
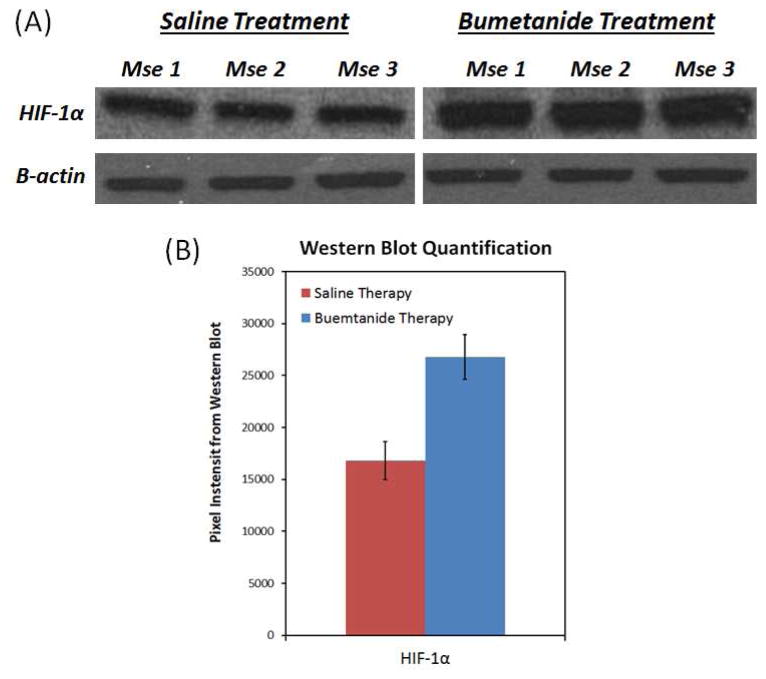
Intuitively, the sustained tumor growth and proliferation in response to the bumetanide therapy appears to be contradictory to its inhibitory effects on tumor vascularity. However, as seen in Figure 9, the western blot analysis of the tumor tissue revealed that HIF-1α expression was greater in the bumetanide treatment group than in the saline control group by an average of 59.2% (p = 0.003). Such an increase in HIF-1α expression may be the reason why bumetanide was unable to reduce the tumor growth rate, even though it was found to inhibit angiogenesis.
Figure 9.
Western blotting showed that the HIF-1α expression was 59.1% greater in the bumetanide-treated tumors than in the control tumors (p=0.003). The increase in this transcription factor coincides with the increase in tumor hypoxia following bumetanide administration, as seen in Figure 6.
Discussion
DCE-MRI is a powerful technique that has the ability to capture changes in the angiogenic vasculature by profiling the passage of a contrast agent bolus through tumor tissue. Traditional MRI contrast agents, such as Gd-DTPA chelates, have been commonly used for DCE-MRI protocols due to their clinical availability. However, their small size facilitates non-selective extravasation from both tumor and normal vasculature, leading to large first-pass extraction. On the other hand, MMCM with molecular weights over 20 kDa are not able to permeate through the vessel walls of normal vasculature. Their rather large hydrodynamic diameters limit their extravasation through only hyperpermeable blood vessels of the tumor, albeit at a significantly reduced rate compared to low molecular weight agents. As a result, preclinical studies have shown that DCE-MRI with MMCM can detect subtle changes in vascular parameter estimations that are not revealed when lower molecular weight alternatives, with much greater wash-in and wash-out rates, are used during the imaging protocol (11). Unfortunately, MMCMs are not readily excreted by the kidneys since they are generally greater than the 5 nm cutoff size for glomerular filtration. As a result, elimination of these agents are rather slow, and their prolonged retention in the body can persist for several weeks, potentially leading to toxic side effects (9, 23).
In recent years, we have explored the design of biodegradable macromolecular contrast agents for DCE-MRI analysis. Such agents possess accelerated clearance profiles whereby they can readily degrade into low molecular weight subunits that are readily removed by the kidneys after a DCE-MRI scan is completed (10). A previous study showed that our biodegradable contrast medium was able to improve the accuracy of this technique for the assessment of vascularity changes in response to anti-angiogenic treatment (11). The new agent synthesized here, GODP, was a similar biodegradable polymeric construct with monomers containing reducible disulfide bonds. Degradation and renal clearance was mediated through the reduction of these disulfide bonds in the presence of endogenous thiols during circulation. Macrocyclic DOTA chelators were also incorporated into the monomeric subunits, in place of the linear DTPA chelators we previously utilized, in order to improve the stability of Gd complexation, and thus make this new macromolecular agent more desirable for in-vivo applications (24).
In this study, DCE-MRI with GODP revealed the anti-angiogenic capabilities of the FDA approved drug bumetanide, an inhibitor of the NKCC1 cotransporter, in a mouse tumor model. NKCC1 is ubiquitously expressed in most tissue types, aiding in cell volume regulation by pumping sodium, potassium, and chloride ions into the cell, along with osmotically obligated water. Historically, bumetanide has been used as a loop diuretic in the clinic to treat hypertension and edema (14). However, the results from several earlier publications demonstrate the potential benefits this drug may have for cancer therapy. Most notably, Haas and Sontheimer revealed that bumetanide was able to inhibit the growth, cell migration, and invasion of glioma tumors. This effect was attributed to the fact that tumor cells require NKCC1 localization at the leading edge of their invading processes in order to regulate the requisite volume changes that enable migration through tight extracellular spaces of the tumor interstitium. Therefore, inhibition of NKCC1 activity played a major role in preventing glioma cell dispersion away from the primary tumor mass (16). Algharabil et al. also revealed that bumetanide was able to effectively enhance tumor sensitivity to the chemotherapeutic drug temezolomide, ultimately inducing significant cell death. One of the major hallmarks of apoptotic events is a significant reduction in cell volume, resulting from a loss of K+ and Cl− ions. However, by possessing the NKCC1 transporter, tumor cells are able to counteract such loss in ionic strength and pump water back into the cell, thus maintaining volume homeostasis and evading the induction of apoptosis by chemotherapeutic agents. Therefore, blocking the NKCC1 transporter with bumetanide inhibits this resistance pathway and facilitates the ensuing cell death mechanisms (17). Lastly, studies have also demonstrated that bumetanide-mediated inhibition of the NKCC1 cotransporter has the ability to reduce the proliferation of human skin fibroblasts, bovine endothelial cells, rat vascular smooth muscle cells, and human lung cells in culture by inhibiting the regulatory volume increase necessary for the transition between the G1 and S phases of the normal cell cycle (18, 19).
Although we discovered that bumetanide was not effective at inhibiting tumor growth in a mouse HT29 colon cancer model, DCE-MRI with GODP showed that it was able to induce significant reductions in the vascular parameters relating to vessel coverage and permeability. In this study, quantitative Vp and PS mappings indicated that the tumor vasculature severely regressed following the bumetanide therapy, relative to the saline control treatment, and this observation was further validated by significantly lower VEGF and CD31 expression levels in the tumors that were treated with the bumetanide drug. The results not only demonstrated that bumetanide was effective at inhibiting angiogenesis, but also that DCE-MRI with the new GODP contrast agent was effective at accurately assessing changes in tumor vascularity over time, which can be used non-invasive assessment of anti-angiogenic therapies (25).
Greater levels of tumor hypoxia and elevated HIF-1α expression in the bumetanide treatment group might have contributed to the unimpeded tumor growth, despite the apparent reduction in vascularity. HIF-1α is a transcription factor that is constitutively expressed in cancer cells, but it is constantly degraded by prolyl hydroxylases in normoxic, well-oxygenated microenvironments. In the presence of hypoxic conditions, HIF-1α is stabilized and induces the transcription of a variety of downstream genes, many of which play an essential role in preserving cell survival, metabolism, and proliferation under low oxygen tension (26–30). In fact, many studies have reported that the failures of anti-angiogenic therapies can be attributed to the compensatory up-regulation of HIF-1α. Nevertheless, these same studies have also reported that the increase in HIF-1α can lead to the simultaneous production and activation of various proangiogenic growth factors, pathways, stromal cells, and bone marrow-derived cells that have the ability to overcome these types of treatments (31–33). Considering that we observed the opposite in this study, whereby angiogenic inhibition persisted even after bumetanide-induced up-regulation of HIF-1α, the mechanism of action for this drug is rather unclear at the moment. Further comprehensive biological investigation at the molecular level needs to be conducted in order to elucidate the anti-angiogenic properties of bumetanide.
The anti-angiogenic capabilities of bumetanide can potentially be exploited in combination treatment regimens as a supplement to more traditional cytotoxic chemotherapeutic drugs in future studies. Combination therapies are relatively new strategies that have gained popularity for tumor treatment due to their propensity to prevent the onset of drug resistance and achieve long-term efficacy. Previous studies have shown that the incorporation of anti-angiogenic agents into combination strategies was able to increase response rates and prolong survival in cancer patients (34–36). With further understanding and optimization of its anti-angiogenic capabilities, bumetanide may potentially be employed as a drug candidate in future cancer therapies to enhance the tumor response and efficacy of various anti-cancer agents.
Conclusion
This investigative study demonstrated and validated the use of GODP as an efficient biodegradable macromolecular contrast agent for DCE-MRI assessment of tumor vascularity. With the aid of the AATH pharmacokinetic model, DCE-MRI with GODP revealed the anti-angiogenic activity of bumetanide. This drug induced a substantial decline in the vascular permeability and plasma volume fraction of HT29 xenografts compared to the saline control. The anti-angiogenic effect of bumetanide was verified by the reduced CD31 and VEGF expression within the tumor tissue. This subsequently led to an increase in tumor hypoxia and HIF-1α expression, likely contributing to the observation that tumor growth and proliferation did not subside. Bumetanide is a promising alternative anti-angiogenic agent that, with further development, could possibly be used in combination anticancer therapies.
Supplementary Material
Acknowledgments
This work was supported in part by the NIH grant R01 EB000489.
Abbreviations
- AATH
adiabiatic approximation to the tissue homogeneity
- BOC-ON
[2-(tert-butoxycarbonyloxyimino)-2-phenylacetonitrile]
- CD31
cluster of differentiation
- DCE-MRI
dynamic contrast enhanced magnetic resonance imaging
- DCM
dichloromethane
- DETA
diethylenetriamine
- DMF
dimethylformamide
- DOTA
tetraazacyclododecanetetraacetic acid
- DIPEA
N,N-diisopropylethylamine
- DTSSP
3,3′-dithiobis(sulfosuccinimidylpropionate)
- DTBP
dithiobispropionic acid
- DTPA
diethylene triamine pentaacetic acid
- FITC
Fluorescein isothiocyanate
- FOV
field of view
- Fp
blood flow
- Gd
gadolinium
- GODP
poly([(Gd-DOTA)-DETA]-co-DTBP)
- HIF-1α
hypoxia inducible factor-1 α
- IHC
immunohistochemistry
- kDa
kilodalton
- LMCM
low molecular weight clinical agents
- MMCM
macromolecular Gd-based contrast agents
- NKCC1
Na+-K+-2Cl− cotransporter
- PS
permeability-surface area product
- PyBOP
Benzotriazol-1-yl-oxytripyrrolidinophosphonium hexafluorophosphate
- r1
longitudinal relaxivity
- r2
longitudinal and transverse relaxivity
- ROI
region of interest
- SDS-PAGE
sodium dodecyl sulfate polyacrylamide gel electrophoresis
- THF
tetrahydrofuran
- TE
echo time
- TR
repetition time
- VEGF
Vascular endothelial growth factor
- Vp
volume fraction of the plasma space
- ΔSI
signal enhancement values
References
- 1.O’Connor JP, Jackson A, Parker GJ, Roberts C, Jayson GC. Dynamic contrast-enhanced MRI in clinical trials of antivascular therapies. Nature Rev Clin Onc. 2012;9:167–177. doi: 10.1038/nrclinonc.2012.2. [DOI] [PubMed] [Google Scholar]
- 2.Padhani AR, Husband JE. Dynamic contrast-enhanced MRI studies in oncology with an emphasis on quantification, validation and human studies. Clin Radiol. 2001;56(8):607–620. doi: 10.1053/crad.2001.0762. [DOI] [PubMed] [Google Scholar]
- 3.Kerbel RS. Tumor angiogenesis. The New Eng J Med. 2008;358:2039–2049. doi: 10.1056/NEJMra0706596. [DOI] [PMC free article] [PubMed] [Google Scholar]
- 4.Carmeliet P, Jain RK. Angiogenesis in cancer and other diseases. Nature. 2000;407:249–257. doi: 10.1038/35025220. [DOI] [PubMed] [Google Scholar]
- 5.Sourbron SP, Buckley DL. Tracer kinetic modelling in MRI: estimating perfusion and capillary permeability. Phys Med Bio. 2012;57:R1–33. doi: 10.1088/0031-9155/57/2/R1. [DOI] [PubMed] [Google Scholar]
- 6.Koh TS, Bisdas S, Koh DM, Thng CH. Fundamentals of tracer kinetics for dynamic contrast-enhanced MRI. Journal of magnetic resonance imaging: JMRI. 2011;34:1262–1276. doi: 10.1002/jmri.22795. [DOI] [PubMed] [Google Scholar]
- 7.Feng Y, Jeong EK, Mohs AM, Emerson L, Lu ZR. Characterization of tumor angiogenesis with dynamic contrast-enhanced MRI and biodegradable macromolecular contrast agents in mice. Magn Reson Med. 2008;60:1347–1352. doi: 10.1002/mrm.21791. [DOI] [PMC free article] [PubMed] [Google Scholar]
- 8.Brasch R, Pham C, Shames D, Roberts T, van Dijke K, van Bruggen N, Mann J, Ostrowitzki S, Melnyk O. Assessing tumor angiogenesis using macromolecular MR imaging contrast media. JMRI. 1997;7:68–74. doi: 10.1002/jmri.1880070110. [DOI] [PubMed] [Google Scholar]
- 9.Barrett T, Kobayashi H, Brechbiel M, Choyke PL. Macromolecular MRI contrast agents for imaging tumor angiogenesis. Eur J Radiol. 2006;60:353–366. doi: 10.1016/j.ejrad.2006.06.025. [DOI] [PubMed] [Google Scholar]
- 10.Lu ZR, Wu X. Polydisulfide Based Biodegradable Macromolecular Magnetic Resonance Imaging Contrast Agents. Israel J Chem. 2010;50:220–232. doi: 10.1002/ijch.201000016. [DOI] [PMC free article] [PubMed] [Google Scholar]
- 11.Wu X, Jeong EK, Emerson L, Hoffman J, Parker DL, Lu ZR. Noninvasive evaluation of antiangiogenic effect in a mouse tumor model by DCE-MRI with Gd-DTPA cystamine copolymers. Mol Pharmaceut. 2010;7:41–48. doi: 10.1021/mp900153f. [DOI] [PMC free article] [PubMed] [Google Scholar]
- 12.Wu X, Feng Y, Jeong EK, Emerson L, Lu ZR. Tumor characterization with dynamic contrast enhanced magnetic resonance imaging and biodegradable macromolecular contrast agents in mice. Pharm Res. 2009;26:2202–2208. doi: 10.1007/s11095-009-9935-x. [DOI] [PMC free article] [PubMed] [Google Scholar]
- 13.Ye Z, Wu X, Tan M, Jesberger J, Grisworld M, Lu ZR. Synthesis and evaluation of a polydisulfide with Gd-DOTA monoamide side chains as a biodegradable macromolecular contrast agent for MR blood pool imaging. Contr Media Mol Imaging. 2013;8:220–228. doi: 10.1002/cmmi.1520. [DOI] [PMC free article] [PubMed] [Google Scholar]
- 14.Asbury MJ, Gatenby PB, O’Sullivan S, Bourke E. Bumetanide: potent new “loop” diuretic. Bri Med J. 1972;1:211–213. doi: 10.1136/bmj.1.5794.211. [DOI] [PMC free article] [PubMed] [Google Scholar]
- 15.Haas M, Forbush B., 3rd The Na-K-Cl cotransporters. J Bioenerg Biomembranes. 1998;30:161–172. doi: 10.1023/a:1020521308985. [DOI] [PubMed] [Google Scholar]
- 16.Haas BR, Sontheimer H. Inhibition of the Sodium-Potassium-Chloride Cotransporter Isoform-1 reduces glioma invasion. Cancer Res. 2010;70:5597–5606. doi: 10.1158/0008-5472.CAN-09-4666. [DOI] [PMC free article] [PubMed] [Google Scholar]
- 17.Algharabil J, Kintner DB, Wang Q, Begum G, Clark PA, Yang SS, Lin SH, Kahle KT, Kuo JS, Sun D. Inhibition of Na(+)-K(+)-2Cl(−) cotransporter isoform 1 accelerates temozolomide-mediated apoptosis in glioblastoma cancer cells. Cell Phys Biochem. 2012;30:33–48. doi: 10.1159/000339047. [DOI] [PMC free article] [PubMed] [Google Scholar]
- 18.Iwamoto LM, Fujiwara N, Nakamura KT, Wada RK. Na-K-2Cl cotransporter inhibition impairs human lung cellular proliferation. Am J Phys Lung Cell Mol Phys. 2004;287:L510–514. doi: 10.1152/ajplung.00021.2004. [DOI] [PubMed] [Google Scholar]
- 19.Panet R, Atlan H. Stimulation of bumetanide-sensitive Na+/K+/Cl− cotransport by different mitogens in synchronized human skin fibroblasts is essential for cell proliferation. J Cell Bio. 1991;114:337–342. doi: 10.1083/jcb.114.2.337. [DOI] [PMC free article] [PubMed] [Google Scholar]
- 20.St Lawrence KS, Lee TY. An adiabatic approximation to the tissue homogeneity model for water exchange in the brain: I. Theoretical derivation. J Cereb Blood Flow Metab. 1998;18:1365–1377. doi: 10.1097/00004647-199812000-00011. [DOI] [PubMed] [Google Scholar]
- 21.Ingrisch M, Sourbron S. Tracer-kinetic modeling of dynamic contrast-enhanced MRI and CT: a primer. J Pharmacok Pharmacod. 2013;40:281–300. doi: 10.1007/s10928-013-9315-3. [DOI] [PubMed] [Google Scholar]
- 22.Kershaw LE, Cheng HL. Temporal resolution and SNR requirements for accurate DCE-MRI data analysis using the AATH model. Magn Reson Med. 2010;64:1772–1780. doi: 10.1002/mrm.22573. [DOI] [PubMed] [Google Scholar]
- 23.Cacheris WP, Quay SC, Rocklage SM. The relationship between thermodynamics and the toxicity of gadolinium complexes. Magn Reson Imaging. 1990;8:467–481. doi: 10.1016/0730-725x(90)90055-7. [DOI] [PubMed] [Google Scholar]
- 24.Laurent S, Elst LV, Copoix F, Muller RN. Stability of MRI paramagnetic contrast media: a proton relaxometric protocol for transmetallation assessment. Invest Radiol. 2001;36:115–122. doi: 10.1097/00004424-200102000-00008. [DOI] [PubMed] [Google Scholar]
- 25.Mishra GP, Doddapaneni BS, Nguyen D, Alani AW. Antiangiogenic effect of docetaxel and everolimus as individual and dual-drug-loaded micellar nanocarriers. Pharm Res. 2014;31:660–669. doi: 10.1007/s11095-013-1188-z. [DOI] [PubMed] [Google Scholar]
- 26.Harris AL. Hypoxia--a key regulatory factor in tumour growth. Nature Rev Cancer. 2002;2:38–47. doi: 10.1038/nrc704. [DOI] [PubMed] [Google Scholar]
- 27.Powis G, Kirkpatrick L. Hypoxia inducible factor-1alpha as a cancer drug target. Mol Cancer Therapeutics. 2004;3:647–654. [PubMed] [Google Scholar]
- 28.Semenza GL. HIF-1: upstream and downstream of cancer metabolism. Curr Opinion Genet Dev. 2010;20:51–56. doi: 10.1016/j.gde.2009.10.009. [DOI] [PMC free article] [PubMed] [Google Scholar]
- 29.Liao D, Johnson RS. Hypoxia: a key regulator of angiogenesis in cancer. Cancer Met Reviews. 2007;26:281–290. doi: 10.1007/s10555-007-9066-y. [DOI] [PubMed] [Google Scholar]
- 30.Fang JS, Gillies RD, Gatenby RA. Adaptation to hypoxia and acidosis in carcinogenesis and tumor progression. Sem Cancer Biology. 2008;18:330–337. doi: 10.1016/j.semcancer.2008.03.011. [DOI] [PMC free article] [PubMed] [Google Scholar]
- 31.Paez-Ribes M, Allen E, Hudock J, Takeda T, Okuyama H, Vinals F, Inoue M, Bergers G, Hanahan D, Casanovas O. Antiangiogenic therapy elicits malignant progression of tumors to increased local invasion and distant metastasis. Cancer Cell. 2009;15:220–231. doi: 10.1016/j.ccr.2009.01.027. [DOI] [PMC free article] [PubMed] [Google Scholar]
- 32.Rapisarda A, Melillo G. Role of the hypoxic tumor microenvironment in the resistance to anti-angiogenic therapies. Drug Resist Ppdates. 2009;12:74–80. doi: 10.1016/j.drup.2009.03.002. [DOI] [PMC free article] [PubMed] [Google Scholar]
- 33.Azam F, Mehta S, Harris AL. Mechanisms of resistance to antiangiogenesis therapy. Eur J Cancer. 2010;46:1323–1332. doi: 10.1016/j.ejca.2010.02.020. [DOI] [PubMed] [Google Scholar]
- 34.Gasparini G, Longo R, Fanelli M, Teicher BA. Combination of antiangiogenic therapy with other anticancer therapies: results, challenges, and open questions. J Clin Onco. 2005;23:1295–1311. doi: 10.1200/JCO.2005.10.022. [DOI] [PubMed] [Google Scholar]
- 35.Jain RK. Normalizing tumor vasculature with anti-angiogenic therapy: a new paradigm for combination therapy. Nature Med. 2001;7:987–989. doi: 10.1038/nm0901-987. [DOI] [PubMed] [Google Scholar]
- 36.Hsu HW, Wall NR, Hsueh CT, Kim S, Ferris RL, Chen CS, Mirshahidi S. Combination antiangiogenic therapy and radiation in head and neck cancers. Oral Onco. 2014;50:19–26. doi: 10.1016/j.oraloncology.2013.10.003. [DOI] [PubMed] [Google Scholar]
Associated Data
This section collects any data citations, data availability statements, or supplementary materials included in this article.


