

Abstract
Purpose
Experimental Blood–Brain Barrier (BBB) permeability models for drug molecules are expensive and time-consuming. As alternative methods, several traditional Quantitative Structure-Activity Relationship (QSAR) models have been developed previously. In this study, we aimed to improve the predictivity of traditional QSAR BBB permeability models by employing relevant public bio-assay data in the modeling process.
Methods
We compiled a BBB permeability database consisting of 439 unique compounds from various resources. The database was split into a modeling set of 341 compounds and a validation set of 98 compounds. Consensus QSAR modeling workflow was employed on the modeling set to develop various QSAR models. A five-fold cross-validation approach was used to validate the developed models, and the resulting models were used to predict the external validation set compounds. Furthermore, we used previously published membrane transporter models to generate relevant transporter profiles for target compounds. The transporter profiles were used as additional biological descriptors to develop hybrid QSAR BBB models.
Results
The consensus QSAR models have R2=0.638 for fivefold cross-validation and R2=0.504 for external validation. The consensus model developed by pooling chemical and transporter descriptors showed better predictivity (R2=0.646 for five-fold cross-validation and R2=0.526 for external validation). Moreover, several external bio-assays that correlate with BBB permeability were identified using our automatic profiling tool.
Conclusions
The BBB permeability models developed in this study can be useful for early evaluation of new compounds (e.g., new drug candidates). The combination of chemical and biological descriptors shows a promising direction to improve the current traditional QSAR models.
Keywords: biological descriptors, blood–brain barrier, hybrid model, permeability
INTRODUCTION
The blood–brain barrier (BBB) separates the central nervous system (CNS) from the circulatory system and selectively limits many substances from entering the brain. The BBB is a sophisticated barrier system. Besides the tight junction and cell membranes that limit passive diffusion of molecular substances, the BBB is also composed of transporters that selectively regulate permeation of exogenous molecules (1).
The study of BBB permeability is crucial for drug development. While BBB permeability is required for CNS drugs to work (2), unexpected passage of a drug through BBB may cause severe side effects (3). Traditional experimental approaches to evaluate drug BBB permeability, such as animal testing, are expensive and time consuming. Therefore, alternative methods with significantly lower cost, such as in vitro or computational models, are desirable for drug research and development. Various computational models, especially those using Quantitative Structure-Activity Relationship (QSAR) approaches, have been developed in the past decades. Table SI shows QSAR models on the BBB permeability published within the last 5 years. However, the QSAR hypothesis that “chemically similar compounds tend to have similar activities” has its limitation when the modeling set is neither large and nor diverse (4). In small datasets, the existence of structurally similar compounds with vastly different activities, also called “activity cliffs,” greatly affects the predictivity of QSAR models (5).
With the development of high-throughput screening (HTS) techniques in the past decades, massive amounts of bio-assay data have become publically available. PubChem, the largest public data sharing portal, contains over 700,000 bio-assays with around 50 million compounds tested (6). A substantial number of PubChem bio-assays showed relevance to BBB permeability. For example, brain adenylate cyclase assays (PubChem AID 34292 and 34293) indicate binding affinity of this membrane-associated enzyme, which catalyzes the formation of the secondary messenger cyclic adenosine monophosphate (cAMP) and regulates the permeability in the brain capillaries (7). While the current “Big Data” pool is large, complex, and informative, there still exists a major challenge in how to apply these available comprehensive data on systemic biological models (e.g., BBB permeability models) and benefit from it.
In this study, we address the above challenges by improving the predictivity of conventional QSAR models on BBB permeability using publicly available bio-assay data. To this end, we compiled a large quantitative BBB permeability database of 439 unique compounds (Supplementary files Table SII), which is larger than the training sets used in most of the previous modeling studies (Supplementary Table SI). After applying various modeling approaches (i.e., k-nearest neighbor, random forest and support vector machine), the external predictivity of the resulting combinatorial QSAR model is comparable to previous developed models. Then, by applying the transporter assay data generated by our in-house models (8) as biological descriptors, the predictivity of the resulting hybrid model was superior to the original QSAR models based only on chemical descriptors. Furthermore, we used our in-house automatic profiling tool (9) to generate a PubChem bio-assay profile for each compound in the dataset. The resulting profile contains 155 assays relevant to the BBB permeability. Although not suitable as additional descriptors due to missing data, some assays were able to provide possible explanations for some of the models’ prediction outliers (compounds with large prediction errors).
METHODS
Dataset
A dataset of 484 compounds with experimental BBB permeability results was compiled from various public sources (10–13). The experimental values, which were represented as logBB (logarithm of brain-plasma concentration ratio at steady-state), range from −2.15 to 1.64 for these compounds. The chemical structure curation was performed using two chemical structure standardizer tools (Standardizer 6.3.0 from ChemAxon and CASE Ultra Datakurator 1.5.0.0 from Multicase Inc.) to remove duplicates, inorganics and mixtures. Since our descriptor generator cannot distinguish stereoisomers and salts, they will be considered to have the same chemical structures as their parent compounds. For this reason, duplicate compounds with different logBB values were carefully examined. In these cases, the 2-D structure of each stereoisomer was used and the larger component of the salt was neutralized and kept. This effort resulted in a curated logBB dataset consisting of 439 unique compounds. The source containing the largest number of compounds (total 362 compounds reported, 341 unique compounds after the curation) (10), was used as the modeling set in our study. The remaining 98 compounds were used as the external validation set. The distribution of the dataset by logBB ranges is shown in Fig. 1. Furthermore, after the QSAR models were developed, the compounds in this dataset were further classified as BBB permeable (logBB>0) or non-permeable (logBB≤0). This arbitrary threshold used for classification was reported in several previous studies (14,15).
Fig. 1.

Distribution of compounds by logBB values. Left (blue) are “non-permeable” compounds with logBB≤0, right (red) are “permeable” compounds with logBB>0.
Overview of the Workflow in this Study
Figure 2 summarized the workflow designed for this study. After data curation, the QSAR approaches were applied to develop several QSAR logBB models. This procedure, framed red, represented the traditional QSAR modeling for the BBB permeability using rigorous external validation. Our in-house automatic profiling tool was used to extract all relevant biological response data for the compounds in the logBB dataset (framed by orange in Fig. 2). Then the chemical descriptors obtained from the chemical structures and the biological descriptors generated by the QSAR models of nine transporters were combined to develop an enhanced hybrid logBB model (framed by blue in Fig. 2).
Fig. 2.

Modeling workflow in this study.
Chemical Descriptors
The 2D Molecular Operating Environment (MOE) descriptors include physical properties, atom and bond counts, connectivity and shape indices, adjacency and distance matrix descriptors, subdivided surface areas, pharmacophore feature descriptors and partial charge descriptors, etc. A total of 192 2D descriptors were generated for each compound in the dataset using MOE version 2013.08. After the descriptors were range-scaled to [0, 1], redundant descriptors were removed by deleting those with low variance (standard deviation <0.01) and/or randomly keeping one of any pairs of descriptors that have high correlation (R2>0.95). The remaining 125 descriptors were used in the modeling process.
Modeling and Approaches
The QSAR models were developed using three different machine learning algorithms: Random Forest (RF), Support Vector Machine (SVM) and k-Nearest Neighbor (kNN). RF predictor consists of many decision trees and produces a prediction that combines the outputs from individual trees (16). SVM regression attempts to find the most narrow band in the descriptor-activity space containing most of the data points (17). We used standard implementation of RF and SVM algorithms as realized in R®0.2.15.1 using the package “e1071” (18). The settings of all statistical parameters to run these two algorithms were kept as default. The kNN (19) method uses weighted average of nearest neighbors as its prediction and employs variable selection procedure to define neighbors. It was developed using our in-house program implementation (20) (also available at chembench.mml.unc.edu). An extra consensus QSAR model was then generated by averaging predictions of the three individual models. The development and application of consensus QSAR models have been reported in our previous publications (21–23).
All models were validated using a five-fold cross-validation. Briefly, the modeling set was randomly divided into five equivalent subsets. One subset was used as the test set (20% of the modeling set compounds) and the remaining four subsets (80% of the modeling set compounds) were used as the training set. The training set was used to develop the QSAR models and the resulting models were validated by predicting the excluded test set. The procedure was repeated five times so that each modeling set compound was used in the test set once. Additional details regarding the QSAR modeling and validation procedure can be found elsewhere (24,25).
Integration of Biological Descriptors
We recently reported a QSAR modeling study for predicting chemical interactions of different Human Intestinal Transporters (HITs) (8). Some HITs presented on the BBB affect the permeability of compounds, e.g., Apical Sodium-Dependent Bile Acid Transporter (ASBT) (26,27), Bile Salt Export Pump (BSEP) (28,29), Monocarboxylic Acid Transporters (MCT) (30), Multidrug Resistance Protein 1 (MDR1) (31), Multidrug Resistance-Associated Proteins (MRP1,3,4,5) (32), and Organic Anion Transporting Polypeptides (OATPs) (33). In this study, the predicted values were obtained from previously developed transporter models (8) available on chembench.mml.unc.edu, model ID: ASBT (112a, 112q, 112r), BSEP (242x, 242z), MCT1 (311q, 311x), MDR1 (313a, 313d, 313s, 313z), MRP1 (321x, 321z), MRP3 (333a, 333q, 333s, 333w), MRP4 (342x, 342z), MRP5 (344a, 344q), OATP 2B1 (413x, 413z). There are multiple QSAR models available for each transporter, thus the average predictions from individual models of each transporter were calculated and used in constructing the transporter profile. Finally, nine transporter activities were obtained for all 439 compounds in our database. None of the nine transporter activities correlated with each other for our data set and neither of them correlated with any of the 125 chemical descriptors (standard deviation≥0.01, R2≤0.95) that were used in the modeling process. Thus, the predicted activities of nine transporters were directly combined with the chemical descriptors to get the hybrid descriptors set. Then, the hybrid models were built based on the hybrid descriptor set using the same modeling approaches.
Additional bio-assay data was obtained from PubChem using our in-house automatic profiling tool (9). This tool aims to automatically extract experimental activities of PubChem assays for target compounds. The bioassays and their response data were kept when a bioassay has at least four active responses in our 439 compounds. The output file is a two-dimension matrix similar to the descriptor set used in the modeling process. The gathered bioassay data were then used for correlation analysis of BBB permeability. To simplify the identification and analysis of the bio-assays, the logBB values were categorized (logBB>0 as permeable with activity as 1, logBB≤0 as non-permeable with activity as −1; see Fig. 1). The PubChem assays, with at least four compounds reported as permeable in our BBB database were kept for further analysis. Using this criterion, 310 PubChem assays and their response data were collected for the 275 compounds in our BBB database. Correlation of each bioassay to BBB permeability was calculated as the predictivity (number of true predictions over total number of known predictions) of this assay results to BBB permeability classifications. To further evaluate the correlation between bio-assay data and BBB permeability, a Psum parameter was created as following:
In which, Sum(Responses) is the sum of the classified assay activity (1 for actives and −1 for inactives) for all compounds tested in this bio-assay and N is the number of these compounds. Thus, Psum>0 indicates that active response dominants while Psum <0 indicates negative response dominants.
RESULTS
Overview of the BBB Permeability Database
We analyzed the chemical space of the logBB dataset by performing a Principle Component Analysis (PCA) with the 192 MOE 2D descriptors used in this study. The top three most important components were used to generate a three-dimensional distribution plot for all 439 compounds (Fig. 3). Since these three components explained 59% of the total descriptor variance in this dataset, Fig. 3 can be viewed as the representation of chemical space covered by all compounds. There are several structural outliers, mostly non-permeable compounds. For example, Digoxin (PubChem CID 30322), which is widely used in heart failure treatment, was proven to be actively transported out of the BBB by MDR1 (34). Excluding structural outliers from the modeling set may improve robustness of the QSAR models (35), while outliers in the external set should be detected by the model’s applicability domain (21,22). Since removing these structural outliers (e.g. Digoxin) did not show better modeling results (data not shown), and their logBB predictions might be improved after including biological descriptors, they were kept in this study. Using the same three principle components, the Supplementary Figure S1 showed the chemical space distribution of both modeling and external validation sets.
Fig. 3.

Chemical space of logBB database (n=439) using top three principal components of MOE 2D descriptors (59% variance explained). Purple dots are “non-permeable” compounds with logBB≤0, red dots are “permeable” compounds with logBB>0.
Consensus QSAR Results
We developed three individual models and one consensus logBB model using the same modeling set. The performances of the models are represented by the five-fold cross-validation results and by predicting the external validation compounds (98 compounds not used in model development). The performances for all models are shown in Fig. 4. Among the individual models, the kNN model has a superior result for the five-fold external cross-validation (R2=0.690 and MAE= 0.302). However, the RF model has the best performance when predicting external compounds (R2=0.524 and MAE=0.399). The conflicts between the results obtained from cross-validation and external prediction were reported in many previous QSAR studies (21,36). Meanwhile, using AD did not show improvement of results for five-fold cross-validation or external set predictions. We therefore retained all predictions (100% coverage). This condition makes it difficult to select the “top model” from various individual models for the purpose of external prediction. The consensus model (represented as CSS in Fig. 4), however, yielded better performance (R2=0.638 MAE=0.315 in five-fold cross-validation, and R2=0.504 MAE=0.430 in external validation) when compared to SVM and RF models in cross-validation, and SVM and kNN models in external prediction. Since it considers the output of all of the individual models without making model selection, yields better predictions for both cross-validation and external validation results than most individual models, the consensus model is more stable and reliable when predicting new compounds.
Fig. 4.

Performance of conventional QSAR (based on only MOE descriptors, represented as MOE) and hybrid models (based on both MOE descriptors and transporter assays, represented as HBD) on a five-fold cross-validation sets and b external set. Last category of each figure is the performance of the consensus model (represented as CSS). Prediction coverage was 100% in all cases.
Bio-assay Data Improve Model Predictive Power
Our previous studies showed that using hybrid descriptors, which are the combinations of chemical and biological descriptors, showed superior results compared to traditional QSAR models only based on chemical descriptors (23,37,38). The predictivity of hybrid modes is higher than the traditional QSAR models and the analysis of chemical-biological descriptor patterns in resulting models can reveal the relevant chemical biological mechanisms of target activities. In this project, we assumed BBB permeability of a drug strongly depends on its biological interactions with active transporters on the BBB. Based on this hypothesis, we integrated the in-house transporter model predictions into our QSAR modeling process as extra biological descriptors. By combining the original chemical descriptors with transporter activities (as biological descriptors) into a hybrid (shown in Fig. 2), the predictivity of models in both the cross-validation and external prediction was improved. For the five-fold cross-validation, the results were improved for all three models. For example, in the SVM model, the R2 value increased from 0.477 to 0.529, and the MAE decreased from 0.375 to 0.359 after including the transporter descriptors. Improvements were also observed in the external validation, with the exception of SVM. The kNN model, for instance, had the R2 value improved from 0.464 to 0.520, and the MAE decreased from 0.440 to 0.422 for the prediction of validation set after including the transporter descriptors. The consensus model, regardless of modeling tools, also yielded the same trend of improvement in both cross-validation and external prediction (Fig. 4). The non-parametric paired permutation test (N=10, 000 on MAE and R2 metrics) using the in-house Matlab script, which compares various performance metrics for two sets of matching predictions, showed that the improvement was significant for SVM (p<0.001) in five-fold cross-validation, RF and kNN and Consensus model (p<0.05) in external validation by paired permutation test comparison of MAE and R2, (N=10,000).
Driven by the benefit of including extra biological descriptors, we profiled 310 PubChem assays for the current BBB database. Figure 5 shows the correlation between these assays and BBB permeability. Assays were sorted by their correlation to the categorized logBB values for compounds in our BBB dataset. There are 144 assays (highlighted in orange dots on the bottom) with positive correlation to BBB permeability and 11 assays (highlighted in green dots on the top) with negative correlation to BBB permeability. In Fig. 5, according to the BBB permeability, the BBB database was divided into eight subsets, each containing 32–37 compounds. The difference of the Psum value for each subset indicates the correlation of the relevant PubChem assay responses to the BBB permeability. At this time, this extra information cannot be applied to our modeling procedure due to missing data, as only 275 of 439 compounds in the data set were found to have at least four experimental data points from these assays as well as the incomplete profiles within the 275 compounds. Future QSAR modeling studies on these assays could supply the missing data and allow for this approach to be fully implemented.
Fig. 5.

The PubChem assay response-BBB permeability correlations: (a) Heat-map for the response profiles of 275 compounds against 310 PubChem assays. The assays were sorted by predictivity to BBB permeability, and the AIDs were shown every five assays. The Psum of each assay were calculated for the eight groups consist of 32–37 compounds with similar logBB values within each group. Outlined assays are 11 assays negatively correlated to BBB permeability (circled by green dots) and 144 assays positively correlated to BBB permeability (circled by orange dots). (b) Average Psum values for different PubChem assays with the same compound distribution as above heat-map. (Orange line: 144 positively correlated assays, green line: 11 negatively correlated assays, yellow line: remaining 155 uncorrelated assays).
DISCUSSION
Since the BBB is a complex biological system composed of diverse receptors, enzymes, and transporters, the traditional QSAR studies meet the bottleneck of predictivity. Models built on chemical descriptors (e.g., MOE descriptors) obtained from a limited number of compounds are sometimes unable to distinguish two structurally similar compounds with different bio-activities (i.e., logBB values). This “activity cliff” issue limits the application of computational predictive models that are based only on chemical descriptors (4).
The bio-assay responses of target compounds provide extra information that can be used to improve traditional QSAR models (37,38). Membrane transporters expressed in brain micro-vessels regulate the extent of flux and rate of exchange of substances between the circulatory system and CNS (39). Thus, a compound’s binding affinity to transporters will affect BBB permeability. As expected, our modeling results showed predictivity improvement by a simple combination of chemical descriptors and transporter descriptors (Fig. 4). This indicates that the improvements of prediction were due to information provided by the transporter data.
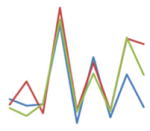
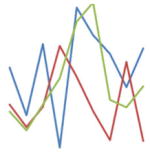
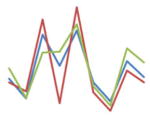
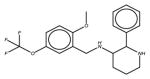
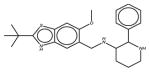
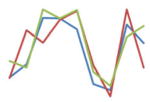
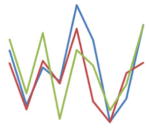
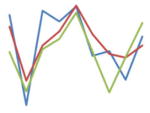
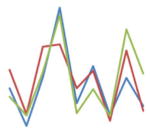
In order to interpret the mechanisms by which transporter interaction affects BBB permeability, we listed seven compounds that have better consensus predictions from the hybrid model compared to the conventional QSAR model, with their nearest neighbor compounds using chemical and transporter descriptors (Table I). The predicted activities for the nine transporters can be viewed as the transporter interaction profile for each compound (the range-scaled transporter interaction profiles are listed in the last column of Table I, blue: query compound, red: chemically nearest neighbor, green: combined nearest neighbor). The BBB permeability results, as well as transporter interaction profiles, indicate that chemically similar compounds do not always have similar biological responses. For example, in group A composed of beta adrenergic receptor antagonists/agonists (Table I), Toliprolol (CID 18047, red line in transporter profile) is the most structurally similar compound to Atenolol (CID 2249, blue line in transporter profile), which is a drug used to treat hypertension, yet the BBB permeability and transporter interactions are quite different, especially for MRP4 and MRP5. However, after including the transporter descriptors, the new nearest neighbor Salbutamol (CID 2083), a drug used for the relief of bronchospasms, has the same BBB permeability and similar transporter interactions with Toliprolol. Similar conditions were also observed in group B and C (Table I). This can potentially be a solution to the “activity cliff” issue in QSAR studies (23,37,38). The differences in transporter interaction activities are able to differentiate the two structurally similar compounds in chemical space but with different bio-activities, thus correct the prediction for the query compound. Therefore, including meaningful biological descriptors (e.g., transporter descriptors in this study) can improve the resulting models.
Table I.
Groups of Compounds with Transporter Profiles Comparison
| Structures | CID | Exp. logBB | ChemSim | Transporter Profile | |||||||||
|---|---|---|---|---|---|---|---|---|---|---|---|---|---|
| ASBT | MCT1 | OATP2B1 | BSEP | MDR1 | MRP1 | MRP3 | MRP4 | MRP5 | |||||
|
Group A Query Compound* Predictions: Pred(MOE) = −0.35 Pred(HBD) = −0.52 |
|
2249 | −1.14 | - |
|
||||||||
|
|
18047 | 0.34 | 0.79 | ||||||||||
|
2083 | −1.14 | 0.65 | ||||||||||
|
Group B Query Compound* Predictions: Pred(MOE) = −1.4 Pred(HBD) = −1.23 |
|
31703 | −0.83 | - |
|
||||||||
|
2583 | 0.01 | 0.64 | ||||||||||
|
5978 | −1.03 | 0.61 | ||||||||||
|
Group C Query Compound* Predictions: Pred(MOE) = −0.05 Pred(HBD) = 0.11 |
|
9864647 | 0.63 | - |
|
||||||||
|
10201984 | 0.88 | 0.94 | ||||||||||
|
22620091 | 0.85 | 0.69 | ||||||||||
|
Group D Query Compound* Predictions: Pred(MOE) = −0.84 Pred(HBD) = −1.13 |
|
55482 | −1.88 | - |
|
||||||||
|
|
72108 | −2 | 0.8 | ||||||||||
|
|
14022522 | −1.3 | 0.64 | ||||||||||
|
Group E Query Compound* Predictions: Pred(MOE) = −0.43 Pred(HBD) = −0.65 |
|
475100 | −0.67 | − |
|
||||||||
|
115237 | −0.67 | 0.99 | ||||||||||
|
10937291 | −0.23 | 0.61 | ||||||||||
|
Group F Query Compound* Predictions: Pred(MOE) = −0.45 Pred(HBD) = −0.6 |
|
3348 | −0.98 | - |
|
||||||||
|
5405 | 0.64 | 0.89 | ||||||||||
|
6426129 | −0.89 | 0.61 | ||||||||||
|
Group G Query Compound* Predictions: Pred(MOE) = −0.54 Pred(HBD) = −0.33 |
|
92242 | −0.01 | - |
|
||||||||
|
23274095 | −0.01 | 0.84 | ||||||||||
|
10352163 | −0.24 | 0.84 | ||||||||||
In transporter profiles, blue: query compound, red: chemically nearest neighbor, green: combined nearest neighbor
Abbreviations: Pred(MOE) predicted logBB value from model based on the MOE descriptors, Pred(HBD) predicted logBB value from the hybrid model, Exp. logBB experimental logBB value, ChemSim chemical similarity to the query compound
Query compound, listed as the first compound in each group, was compared to the two neighbors using the chemical w/o transporter descriptors. Second compound in each group is the chemically nearest neighbor. The third compound in group is the top nearest neighbor (in groups A, B, C, F and G) or second nearest neighbor (in groups D and E when the second compound is also the top nearest neighbor) with hybrid descriptors
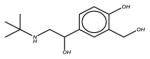
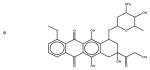
Through the analysis of the transporter interaction profiles, we are able to interpret the biological mechanisms of BBB permeability for specific compounds. For example, in group B of Table I, the query compound Doxorubicin (CID 31703, blue line in transporter profile), a DNA intercalator used in cancer chemotherapy, and its chemical nearest neighbor Carteolol (CID 2583, red line in transporter profile), a non-selective beta blocker used to treat glaucoma, are not actually quite structurally similar (Tanimoto coefficient=0.64) and have significantly different logBB values. After including the transporter descriptors, Doxorubicin and its new nearest neighbor Vincristine (CID 5978, green line in transporter profile), a mitotic inhibitor used in cancer chemotherapy, have closer logBB values. The transporter interaction profiles of these two compounds are similar and they both have higher affinity in four of the five efflux pump transporters (MDR1, MRP1, MRP3, MRP4 and MRP5) than Carteolol. This supports the theory that higher interaction activity with efflux transporters indicates lower BBB permeability. Regarding the two query compounds in group D and E in Table I, their chemical nearest neighbors have same logBB values but the model predictions are still not close. This is due to the existence of other chemically similar compounds with different logBB values that were used to predict the activities of the query compounds. The query compounds have higher similarities in the transporter interaction profile with their new neighbors after including the transporter descriptors (Table I). The better predictions benefit from increasing the distance in chemical space for the structural nearest neighbors with different transporter interaction profiles as well as decreasing distance for those with similar transporter interaction profiles. In group F and G, specifically, the combined evaluation results in the same nearest neighbors, thus the third line in each of these groups showed the second combined nearest neighbor. The correction of prediction is not from the first nearest neighbor itself, but from a combination of neighbors. The first nearest neighbors in these cases have “activity cliffs” with the query compounds, and the next neighbors help minimize the prediction error. The limitation of transporter assays to clear “activity cliffs” also suggests the limitation of information provided by the nine transporter assays.
Using our in-house automatic profiling tool (9), 310 PubChem assays were identified to have data for the compounds in our BBB permeability dataset. Among them, 155 PubChem assays were identified to be somewhat correlated with the BBB permeability with Predictivity ≥70% or Predictivity ≤30% (Fig. 5). Among these PubChem assays, many of the assay targets and receptors were proven to regulate, be regulated by or be relevant to BBB permeability, e.g., androgen receptor (40), MDR1 (31), serotonin (5-HT) receptor (41), adenylate cyclase (42), etc. See Supplementary file Table SIII for those assays and description. For example, for PubChem assays correlated to high BBB permeability (144 assays as circled in the orange dots in Fig. 5a), the 35 compounds with the highest BBB permeability (logBB values range from 0.85 to 1.65) show higher Psum values in these assay results than the other compounds with lower BBB permeability. Therefore, if a compound shows an active response in these bio-assays, it is likely to have high BBB permeability. One particular useful assay (AID 943) is a qHTS assay to identify small molecule antagonists of the androgen receptor signaling pathway. Androgen was reported to upregulate the transmembrane transporter MRP4 through androgen receptor activation in prostate cancer cells (43), thus, it was considered as a potentially informative bio-descriptor resource. Among the compounds tested in this assay, the Psum increases with logBB value increment (data not shown). The average values of the 144 positively-correlated assay (as circled in the yellow dots in the bottom of Fig. 5a) results show similar correlation with logBB values (orange line in Fig. 5b) and the average values of the other 11 negatively-correlated assays (as circled in the green dots in the top of Fig. 5a) show reversed correlation with logBB values (green line in Fig. 5b). The remaining assays, identified as non-correlated, (not circled in Fig. 5a) show no/low correlation with logBB values (yellow line in Fig. 5b).
This analysis provided many potential targets as meaningful biological descriptors, but their uses are limited due to missing data. This can be addressed by deriving corresponding individual QSAR models whose predictions are then used as descriptors, or by developing novel algorithms to integrate the currently available assay data into the modeling process. The current hybrid logBB model is expected to be further enhanced when this information is included.
CONCLUSION
In this study, we compiled a large and diverse BBB permeability dataset consisting of 439 unique compounds and applied a consensus QSAR approach to develop predictive logBB models. All of the resulting models showed predictivity that is better than or comparable to those previously reported. The consensus model obtained by averaging the predictions of individual models achieved similar predictivity to the best individual models.
QSAR models for nine transporters were used to generate extra descriptors for the compounds in the BBB permeability dataset. Hybrid models, based on the combination of the same chemical descriptors and nine transporter descriptors, showed better performance than traditional QSAR models. Through analyzing the nearest neighbor compounds in the traditional QSAR and hybrid models, we found that some “activity cliff” issues could be resolved by using hybrid models. Using our in-house automatic profiling tool, some PubChem assays were also considered to be correlated to BBB permeability. These assays can be potential biological descriptors (after developing their corresponding QSARs) to further improve the current hybrid models. Our research proposed a new strategy to enhance the traditional predictive modeling (e.g., QSAR) of complex biological activities by including extra biological descriptors.
Supplementary Material
Acknowledgments
Research reported in this publication was supported, in part, by the National Institute of Environmental Health Sciences of the National Institutes of Health under Award Number R15ES023148 and the Colgate-Palmolive Grant for Alternative Research. The content is solely the responsibility of the authors and does not necessarily represent the official views of the National Institutes of Health.
ABBREVIATIONS
- 5-HT
5-hydroxytryptamine
- AD
Applicability domain
- ADME
Absorption, distribution, metabolism, and excretion
- AID
PubChem bio-assay identifier
- ALDH1A1
Aldehyde dehydrogenase 1 family, member A1
- AR
Androgen receptor
- ASBT
Apical sodium-dependent bile acid transporter
- BBB
Blood–brain barrier
- BSEP
Bile salt export pump
- CAMP
Cyclic adenosine monophosphate
- CID
PubChem compound identifier
- CNS
Central nervous system
- ER-Alpha
Estrogen receptor alpha
- HITs
Human intestinal transporters
- HTS
High throughput screening
- kNN
k-nearest neighbor
- logBB
Logarithm of brain-plasma concentration ratio at steady-state
- MAE
Mean absolute error
- MCT
Monocarboxylic acid transporters
- MDR
Multidrug resistance
- MDR1
Multidrug resistance protein 1
- MOE
Molecular operating environment software
- MRP1
Multidrug resistance-associated protein 1
- MRP3
Multidrug resistance-associated protein 3
- MRP4
Multidrug resistance-associated protein 4
- MRP5
Multidrug resistance-associated protein 5
- OATPs
Organic anion transporting polypeptides
- PCA
Principle component analysis
- QSAR
Quantitative structure-activity relationship
- RF
Random forest
- SVM
Support vector machine
Footnotes
Electronic supplementary material The online version of this article (doi:10.1007/s11095-015-1687-1) contains supplementary material, which is available to authorized users.
References
- 1.Abbott NJ. Blood–brain barrier structure and function and the challenges for CNS drug delivery. J Inherit Metab Dis. 2013;36(3):437–49. doi: 10.1007/s10545-013-9608-0. [DOI] [PubMed] [Google Scholar]
- 2.Alavijeh MS, Chishty M, Qaiser MZ, Palmer AM. Drug metabolism and pharmacokinetics, the blood–brain barrier, and central nervous system drug discovery. NeuroRx. 2005;2(4):554–71. doi: 10.1602/neurorx.2.4.554. [DOI] [PMC free article] [PubMed] [Google Scholar]
- 3.Andersen HR, Nielsen JB, Grandjean P. Toxicologic evidence of developmental neurotoxicity of environmental chemicals. Toxicology. 2000;144(1–3):121–7. doi: 10.1016/s0300-483x(99)00198-5. [DOI] [PubMed] [Google Scholar]
- 4.Maggiora GM. On outliers and activity cliffs–why QSAR often disappoints. J Chem Inf Model Am Chem Soc. 2006;46(4):1535. doi: 10.1021/ci060117s. [DOI] [PubMed] [Google Scholar]
- 5.Bajorath J, Peltason L, Wawer M, Guha R, Lajiness MS, Van Drie JH. Navigating structure-activity landscapes. Drug Discov Today. 2009;14(13–14):698–705. doi: 10.1016/j.drudis.2009.04.003. [DOI] [PubMed] [Google Scholar]
- 6.Zhu H, Zhang J, Kim MT, Boison A, Sedykh A, Moran K. Big data in chemical toxicity research: the use of high-throughput screening assays to identify potential toxicants. Chem Res Toxicol Am Chem Soc. 2014;27(10):1643–51. doi: 10.1021/tx500145h. [DOI] [PMC free article] [PubMed] [Google Scholar]
- 7.Joó F, Rakonczay Z, Wollemann M. cAMP-Mediated regulation of the permeability in the brain capillaries. Experientia. 1975;31(5):582–4. doi: 10.1007/BF01932471. [DOI] [PubMed] [Google Scholar]
- 8.Sedykh A, Fourches D, Duan J, Hucke O, Garneau M, Zhu H, et al. Human intestinal transporter database: QSAR modeling and virtual profiling of drug uptake, efflux and interactions. Pharm Res. 2013;30(4):996–1007. doi: 10.1007/s11095-012-0935-x. [DOI] [PMC free article] [PubMed] [Google Scholar]
- 9.Zhang J, Hsieh J-H, Zhu H. Profiling animal toxicants by automatically mining public bioassay data: a big data approach for computational toxicology. In: Homayouni R, editor. PLoS One Public Libr Sci. 6. Vol. 9. 2014. Jan, p. e99863. [DOI] [PMC free article] [PubMed] [Google Scholar]
- 10.Muehlbacher M, Spitzer GM, Liedl KR, Kornhuber J. Qualitative prediction of blood–brain barrier permeability on a large and refined dataset. J Comput Aided Mol Des. 2011;25(12):1095–106. doi: 10.1007/s10822-011-9478-1. [DOI] [PMC free article] [PubMed] [Google Scholar]
- 11.Vilar S, Chakrabarti M, Costanzi S. Prediction of passive blood–brain partitioning: straightforward and effective classification models based on in silico derived physicochemical descriptors. J Mol Graph Model. 2010;28(8):899–903. doi: 10.1016/j.jmgm.2010.03.010. [DOI] [PMC free article] [PubMed] [Google Scholar]
- 12.Hou TJ, Xu XJ. ADME evaluation in drug discovery. 3. Modeling blood–brain barrier partitioning using simple molecular descriptors. J Chem Inf Comput Sci. 2003;43(6):2137–52. doi: 10.1021/ci034134i. [DOI] [PubMed] [Google Scholar]
- 13.Abraham MH, Ibrahim A, Zhao Y, Acree WE. A data base for partition of volatile organic compounds and drugs from blood/plasma/serum to brain, and an LFER analysis of the data. J Pharm Sci. 2006;95(10):2091–100. doi: 10.1002/jps.20595. [DOI] [PubMed] [Google Scholar]
- 14.Mensch J, Jaroskova L, Sanderson W, Melis A, Mackie C, Verreck G, et al. Application of PAMPA-models to predict BBB permeability including efflux ratio, plasma protein binding and physicochemical parameters. Int J Pharm. 2010;395(1–2):182–97. [PubMed] [Google Scholar]
- 15.Ooms F, Weber P, Carrupt P-A, Testa B. A simple model to predict blood–brain barrier permeation from 3D molecular fields. Biochim Biophys Acta Mol Basis Dis. 2002;1587(2–3):118–25. doi: 10.1016/s0925-4439(02)00074-1. [DOI] [PubMed] [Google Scholar]
- 16.Breiman L. Mach Learn. 1. Vol. 45. Kluwer Academic Publishers; 2001. Oct 1, Random forests; pp. 5–32. [Google Scholar]
- 17.Vapnik V. The nature of statistical learning theory. Springer Science & Business Media; 2000. [Google Scholar]
- 18.Dalgaard P. Introductory Statistics with R. Springer Science & Business Media. 2008 [Google Scholar]
- 19.Zheng W, Tropsha A. Novel variable selection quantitative structure–property relationship approach based on the k-nearest-neighbor principle. J Chem Inf Model Am Chem Soc. 2000;40(1):185–94. doi: 10.1021/ci980033m. [DOI] [PubMed] [Google Scholar]
- 20.Walker T, Grulke CM, Pozefsky D, Tropsha A. Chembench: a cheminformatics workbench. Bioinformatics. 2010;26(23):3000–1. doi: 10.1093/bioinformatics/btq556. [DOI] [PMC free article] [PubMed] [Google Scholar]
- 21.Solimeo R, Zhang J, Kim M, Sedykh A, Zhu H. Predicting chemical ocular toxicity using a combinatorial QSAR approach. Chem Res Toxicol Am Chem Soc. 2012;25(12):2763–9. doi: 10.1021/tx300393v. [DOI] [PMC free article] [PubMed] [Google Scholar]
- 22.Zhang L, Zhu H, Oprea TI, Golbraikh A, Tropsha A. QSAR modeling of the blood–brain barrier permeability for diverse organic compounds. Pharm Res. 2008;25(8):1902–14. doi: 10.1007/s11095-008-9609-0. [DOI] [PubMed] [Google Scholar]
- 23.Kim MT, Sedykh A, Chakravarti SK, Saiakhov RD, Zhu H. Critical evaluation of human oral bioavailability for pharmaceutical drugs by using various cheminformatics approaches. Pharm Res. 2014;31(4):1002–14. doi: 10.1007/s11095-013-1222-1. [DOI] [PMC free article] [PubMed] [Google Scholar]
- 24.Tropsha A, Golbraikh A. Curr Pharm Des. 34. Vol. 13. Bentham Science Publishers; 2007. Dec 1, Predictive QSAR modeling workflow, model applicability domains, and virtual screening; pp. 3494–504. [DOI] [PubMed] [Google Scholar]
- 25.Golbraikh A, Shen M, Xiao Z, Xiao Y-D, Lee K-H, Tropsha A. J Comput Aided Mol Des. 2–4. Vol. 17. Kluwer Academic Publishers; 2003. Feb 1, Rational selection of training and test sets for the development of validated QSAR models; pp. 241–53. [DOI] [PubMed] [Google Scholar]
- 26.Walters HC, Craddock AL, Fusegawa H, Willingham MC, Dawson PA. Expression, transport properties, and chromosomal location of organic anion transporter subtype 3. Am J Physiol Gastrointest Liver Physiol. 2000;279(6):G1188–200. doi: 10.1152/ajpgi.2000.279.6.G1188. [DOI] [PubMed] [Google Scholar]
- 27.Hagenbuch B, Dawson P. The sodium bile salt cotransport family SLC10. Pflugers Arch. 2004;447(5):566–70. doi: 10.1007/s00424-003-1130-z. [DOI] [PubMed] [Google Scholar]
- 28.Kusuhara H, Sugiyama Y. Role of transporters in the tissue-selective distribution and elimination of drugs: transporters in the liver, small intestine, brain and kidney. J Control Release. 2002;78(1–3):43–54. doi: 10.1016/s0168-3659(01)00480-1. [DOI] [PubMed] [Google Scholar]
- 29.Gerloff T. The sister of P-glycoprotein represents the canalicular bile salt export pump of mammalian liver. J Biol Chem. 1998;273(16):10046–50. doi: 10.1074/jbc.273.16.10046. [DOI] [PubMed] [Google Scholar]
- 30.Tsuji A, Tamai I. Carrier-mediated or specialized transport of drugs across the blood–brain barrier. Adv Drug Deliv Rev. 1999;36(2–3):277–90. doi: 10.1016/s0169-409x(98)00084-2. [DOI] [PubMed] [Google Scholar]
- 31.Demeule M, Shedid D, Beaulieu E, Del Maestro RF, Moghrabi A, Ghosn PB, et al. Expression of multidrug-resistance P-glycoprotein (MDR1) in human brain tumors. Int J Cancer. 2001;93(1):62–6. doi: 10.1002/ijc.1306. [DOI] [PubMed] [Google Scholar]
- 32.Huai-Yun H, Secrest DT, Mark KS, Carney D, Brandquist C, Elmquist WF, et al. Expression of multidrug resistance-associated protein (MRP) in brain microvessel endothelial cells. Biochem Biophys Res Commun. 1998;243(3):816–20. doi: 10.1006/bbrc.1997.8132. [DOI] [PubMed] [Google Scholar]
- 33.Roberts LM, Black DS, Raman C, Woodford K, Zhou M, Haggerty JE, et al. Subcellular localization of transporters along the rat blood–brain barrier and blood-cerebral-spinal fluid barrier by in vivo biotinylation. Neuroscience. 2008;155(2):423–38. doi: 10.1016/j.neuroscience.2008.06.015. [DOI] [PubMed] [Google Scholar]
- 34.Mayer U, Wagenaar E, Beijnen JH, Smit JW, Meijer DKF, Asperen J, et al. Substantial excretion of digoxin via the intestinal mucosa and prevention of long-term digoxin accumulation in the brain by the mdrla P-glycoprotein. Br J Pharmacol. 1996;119(5):1038–44. doi: 10.1111/j.1476-5381.1996.tb15775.x. [DOI] [PMC free article] [PubMed] [Google Scholar]
- 35.Zhu H, Martin TM, Ye L, Sedykh A, Young DM, Tropsha A. Quantitative structure-activity relationship modeling of rat acute toxicity by oral exposure. Chem Res Toxicol Am Chem Soc. 2009;22(12):1913–21. doi: 10.1021/tx900189p. [DOI] [PMC free article] [PubMed] [Google Scholar]
- 36.Zhu H, Tropsha A, Fourches D, Varnek A, Papa E, Gramatica P, et al. Combinatorial QSAR modeling of chemical toxicants tested against Tetrahymena pyriformis. J Chem Inf Model. 2008;48(4):766–84. doi: 10.1021/ci700443v. [DOI] [PubMed] [Google Scholar]
- 37.Sedykh A, Zhu H, Tang H, Zhang L, Richard A, Rusyn I, et al. Use of in vitro HTS-derived concentration-response data as biological descriptors improves the accuracy of QSAR models of in vivo toxicity. Environ Health Perspect. 2011;119(3):364–70. doi: 10.1289/ehp.1002476. [DOI] [PMC free article] [PubMed] [Google Scholar]
- 38.Zhu H, Rusyn I, Richard A, Tropsha A. Use of cell viability assay data improves the prediction accuracy of conventional quantitative structure-activity relationship models of animal carcinogenicity. Environ Health Perspect. 2008;116(4):506–13. doi: 10.1289/ehp.10573. [DOI] [PMC free article] [PubMed] [Google Scholar]
- 39.Hammarlund-Udenaes M, Fridén M, Syvänen S, Gupta A. On the rate and extent of drug delivery to the brain. Pharm Res. 2008;25(8):1737–50. doi: 10.1007/s11095-007-9502-2. [DOI] [PMC free article] [PubMed] [Google Scholar]
- 40.Ohtsuki S, Tomi M, Hata T, Nagai Y, Hori S, Mori S, et al. Dominant expression of androgen receptors and their functional regulation of organic anion transporter 3 in rat brain capillary endothelial cells; comparison of gene expression between the blood–brain and -retinal barriers. J Cell Physiol. 2005;204(3):896–900. doi: 10.1002/jcp.20352. [DOI] [PubMed] [Google Scholar]
- 41.Sharma HS, Dey PK. Impairment of blood–brain barrier (BBB) in rat by immobilization stress: role of serotonin (5-HT) Indian J Physiol Pharmacol. 1981;25(2):111–22. [PubMed] [Google Scholar]
- 42.Banks W, Kastin A, Komaki G, Arimura A. Passage of pituitary adenylate cyclase activating polypeptide1-27 and pituitary adenylate cyclase activating polypeptide1-38 across the blood- brain barrier. J Pharmacol Exp Ther. 1993;267(2):690–6. [PubMed] [Google Scholar]
- 43.Cai C, Omwancha J, Hsieh C-L, Shemshedini L. Androgen induces expression of the multidrug resistance protein gene MRP4 in prostate cancer cells. Prostate Cancer Prostatic Dis. 2007;10(1):39–45. doi: 10.1038/sj.pcan.4500912. [DOI] [PubMed] [Google Scholar]
Associated Data
This section collects any data citations, data availability statements, or supplementary materials included in this article.