

Abstract
Purpose
Properly charged particles can be used for effective lung targeting of pharmaceutical aerosols. The objective of this study was to characterize the performance of a new induction charger that operates with a mesh nebulizer for the production of highly charged submicrometer aerosols to bypass the mouth-throat and deliver clinically relevant doses of medications to the lungs.
Methods
Variables of interest included combinations of model drug (i.e. albuterol sulfate) and charging excipient (NaCl) as well as strength of the charging field (1–5 kV/cm). Aerosol charge and size were measured using a modified electrical low pressure impactor system combined with high performance liquid chromatography.
Results
At the approximate mass median aerodynamic diameter (MMAD) of the aerosol (~ 0.4 μm), the induction charge on the particles was an order of magnitude above the field and diffusion charge limit. The nebulization rate was 439.3 ± 42.9 μl/min, which with a 0.1 % w/v solution delivered 419.5 ± 34.2 μg of medication per minute. A new correlation was developed to predict particle charge produced by the induction charger.
Conclusions
The combination of the aerosol induction charger and predictive correlations will allow for the practical generation and control of charged submicrometer aerosols for targeting deposition within the lungs.
Keywords: Charged particle generation, charged submicrometer aerosols, induction charging, pharmaceutical aerosols, respiratory drug delivery
INTRODUCTION
It is well known that aerosol charge affects the deposition of inhaled particles and droplets (1–3). Considering the generation of pharmaceutical aerosols, most inhalers and nebulizers produce an inherent charge on the particles or droplets that may affect deposition in the respiratory tract (4, 5) and may influence sizing when using cascade impaction (6). For example, electrospray devices produce highly charged droplets that require discharging, typically using a corona needle (7) or radioactive source (8), to avoid very high device and extrathoracic depositional losses. In contrast with charges produced during the aerosolization process, researchers have proposed adding charge to aerosols to control the deposition profile in the lungs (5, 9). Electrostatic charge on inhaled particles or droplets results in an attractive force in the direction of the airway walls (image force), and, depending on aerosol concentration, a mutual repulsion force among the charged elements (space charge force) [5]. Both of these effects act to increase the respiratory deposition of inhaled charged aerosols.
Increases in deposition due to electrical charge of spherical and fibrous particles have previously been demonstrated using animals, clinical studies in humans, in vitro studies with airway replicas and mathematical modeling (10–23) and have recently been reviewed by Wong et al (24) and previously by Cohen et al. (25). Bailey et al. were the first to suggest taking advantage of electrical charge to improve lung retention and to target the aerosols to different regions of the respiratory system by controlling the particle size and charge together with the breathing conditions (5, 9).
Previous studies have demonstrated the effect of charge on the deposition of micrometer (14, 18–20, 23, 26) and submicrometer particles (13, 16, 25) in human airways and on boundary surfaces (27–30). The study of Melandri et al. (13) reported the deposition of charged monodisperse aerosols with diameters of 1 μm or less in the airways of human subjects breathing normally. Aerosol charge was generated using a corona wire, and charge levels for positively charged aerosols at all diameters were below 150 elementary charge units. A quantifiable effect of charge on deposition was reported; however, the maximum difference in deposition efficiency between uncharged and positively charged aerosols was on the order of 15% with maximum lung deposition fractions of only 30%. As a result, at the charging level induced by the corona charger of Melandri et al. (13), a significant amount of the micrometer and submicrometer aerosol was exhaled. Full retention of an aerosol in this size range due to charge effects will clearly require much higher charge levels. Scheuch et al. (16) confirmed the findings of Melandri et al. (13) with additional in vivo experiments by showing that negatively charged particles with diameters of 0.5 μm deposit more effectively than uncharged particles, whereas for 1 μm particles no significant effect of charging was observed at the charge levels employed. McMurry and Rader (29) investigated wall deposition of charged aerosols in enclosed chambers and found that the effect of electrical forces were dominant for the removal of intermediate particles between 0.05 and 1 μm.
In order to see a considerable effect of electrostatic force on aerosol deposition, the charge level should typically be higher than what is normally achieved by commercial inhalers. Finlay (31) estimated that the number of elementary charges should be at least 30 to see a charge effect on a 1 μm particle in the alveolar region (31). This level of charge was found to be a good estimate based on the in vivo study of Melandri et al (13), where they noticed an effect of charge on particle deposition within the size range of 0.6–1 μm, where the number of elementary charges was approximately 30 and higher (13, 25).
There are different methods for charging particles to the high levels expected to cause a significant effect on lung deposition (24); however, the induction charging approach could be well suited to pharmaceutical aerosols compared with the other methods such as corona charging (32), which results in the production of ozone with potentially adverse health effects (33). Reischl et al. proposed a method for generating charged monodisperse particles by modifying a vibrating single orifice aerosol generator using an induction charging cap (34). This method has been used to study the penetration of monodisperse charged droplets, with a minimum size of 1 μm, through tubes of different lengths and diameters at various velocities (28), and the penetration of droplets with diameter sizes of 3–6 μm through the idealized extrathoracic airways of adults (19), children (20) and infants (23). However, a disadvantage of the single vibrating orifice system is typically low aerosol concentration (103 part/cm3) and mass output, which may prolong or prevent the administration of pharmaceutical aerosols.
The objective of this study is to characterize the performance of a new aerosol induction charger that operates with a mesh nebulizer for the production of pharmaceutical aerosols in terms of particle size distributions and charge magnitude. Variables of interest include different combinations of model drug (i.e. albuterol sulfate) and charging excipient (NaCl) as well as strength of the charging field (1–5 kV/cm). Aerosol size distributions and charge characteristics are measured using a modified electrical low pressure impactor (ELPI; Dekati, Finland) system combined with HPLC to quantify drug mass on individual ELPI stages. Finally, designing effective respiratory drug delivery strategies for lung deposition requires the ability to predict the charge on the submicrometer aerosol produced by the induction charger a priori. Measured charge levels are compared with existing correlations for induction charging and a new, more accurate, predictive correlation is proposed.
METHODS
Aerosol Induction Charger
The Aeroneb Lab vibrating mesh nebulizer (Aerogen Ltd, Ireland, with reported volume median diameter of 2.5–4 μm) was used with aqueous solutions of albuterol sulfate (AS) as the model drug with/without sodium chloride (NaCl) as the charging excipient. An aerosol induction charger system was designed as shown in Figure 1 to allow simultaneous dilution of the nebulized aerosol and induction charging. The induction charger was designed to position the counter electrode a short distance from the vibrating mesh to maximize the electrostatic field. The cross-section of the induction charger flow passage was also reduced in the vicinity of the field to maximize flow velocity and minimize depositional loss by electrostatic attraction in this area. Furthermore, a smooth or streamlined (35, 36) transition of cross-sectional areas between the 22 mm diameter inlet, narrow charger region, and 22 mm diameter outlet was used to minimize flow disruption and aerosol loss. A high-voltage power supply (CZE1000R, Spellman High Voltage Electronics Corporation, Hauppauge, NY, USA) was connected to the counter electrode (a metal disk with a diameter of 6.35 mm) and a ground wire was inserted into the formulation solution to produce the charging field. The outlet of the aerosol induction charger was connected to a streamlined wye (36) via 15 cm of standard 22 mm diameter ventilator tubing to split the flow into two streams, one directed into the Electrical Low Pressure Impactor (ELPI) connected to a vacuum pump for aerosol sampling, and the other to a low pressure filter and an additional vacuum pump (PulmoGuard II, Queset Medical, Brockton, MA, USA). Reducing the aerosol mass by splitting the flow before charge measurement was required to keep the current level within the measurement range of the ELPI electrometers (i.e. max 400,000 fA); a splitting ratio of 1:3 with 30 L/min to the ELPI and 60 L/min to the low pressure filter was deemed successful in keeping the current within the measurement range for each ELPI stage while providing a total airflow through the aerosol induction charger of 90 L/min.
Figure 1.
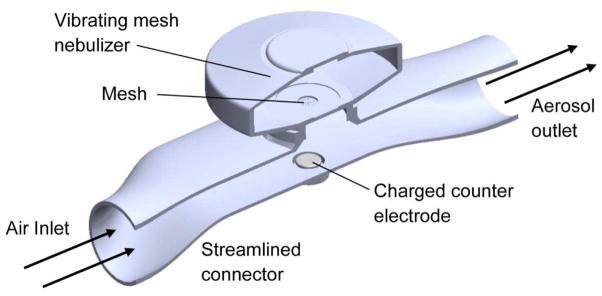
The induction charger device which connects the vibrating mesh nebulizer to the flow stream, positions the counter electrode below the mesh, and accelerates the airflow in the vicinity of the charging field.
Aerosol Charge and Size Measurement
Two concentrations of AS in deionized water (with zero conductivity) were considered, which were 0.05% and 0.1% w/v. Two concentrations of NaCl, 0.0005% (using the minimum weighable NaCl) and 0.01% w/v (resulting in maximum measurable current with the ELPI), were also considered with the 0.05% AS solution. Sodium chloride was included as an ionic charging excipient to evaluate its effect on charging at a constant concentration of AS. Initially, voltage levels of 0, 1, 3, and 5 kV were considered with the two drug-only solutions, but voltages of 0, 1, and 5 kV were used for the two solutions that included sodium chloride. A positive polarity was used on the counter electrode, which resulted in negative induced charge on the droplets. However, the absolute values of charge on the aerosol were used in data analysis and reported in this study. The gap distance between the counter electrode and vibrating mesh was approximately 1 cm in all cases. This gap affects the strength of the electric field since E=V/H, where H is the gap length (i.e. 1 cm). Hence a smaller gap distance would produce a stronger field and higher charging for a set level of voltage. Each stage of the ELPI was covered with aluminum foil and after each experiment these foils, the aerosol induction charger, connection tubing and the filter were washed with known amounts of deionized water to recover the total deposited AS. The mass of AS was then quantified in each sample using a previously developed method of high performance liquid chromatography (HPLC) (37).
Aerosol Charge Calculation
Electrometers connected to each ELPI stage were used to record the current on an individual stage basis. The current was then converted to charge by integrating with respect to time (t in seconds) as follows:
| [1] |
where Istage is the total current recorded for each stage of the ELPI and i is the number of recorded data points, which was based on the default sampling time of 1 second used by the ELPI. AS was the only component quantified with HPLC. Therefore, the total mass of deposited drug and excipient (solute; msolute), assuming co-deposition following drying of the droplets, was calculated based on the nominal mass fraction of the AS (mf AS) in the dried particles and the measured mass of AS (mAS) in the deposited particles as follows:
| [2] |
For calculating the mass of each particle, the volume and density of the multicomponent particle (drug and excipient) were needed. Based on the airflow rate of 90 LPM at a relative humidity of 40%, the lifetime of the droplet was calculated to be much smaller than the transit time to reach the ELPI, so it was reasonable to consider that the droplets were fully dried leaving behind solid particles of the solute. The particle volume was estimated based on the cut size of each ELPI stage (assuming spherical particles) and the density of a multicomponent particle with known mass fractions of AS and NaCl. The density of the multicomponent particle was calculated based on the multicomponent droplet density expression given by Longest and Hindle (38), assuming zero water content, as follows:
| [3] |
The number of particles on each stage was calculated by dividing the mass of particles on a stage by the mass of an individual particle, based on stage cutoff diameter. The number of elementary charges per particle (Qp) was calculated by dividing the total charge of each stage (qstage) by the number of particles and e (i.e. 1.6×10⁻¹⁹ C). The recording time for each experiment was 100 seconds with 20 seconds prior and after nebulization and 60 seconds of nebulization. The ELPI was zeroed before each experiment to minimize the potential effects of noise arising from ambient charged particles. While charge was measured for dried particle size, charging at the time of nebulization is a function of the solution conductivity. The conductivity of each solution was measured with a conductivity meter (ExStik EC400, Extech Instruments, Nashua, NH, USA).
Theory of Induction Charging and Predictive Correlations
The charge induced on the droplet is proportional to the charging voltage (electrical potential of the induction field) and the diameter of the droplet. Reischl et al. (34) proposed the following Equation for the number of elementary charges on the droplet (Qp) with respect to induction charging voltage (V), droplet diameter (D), droplet-orifice distance at the instant of separation (L), induction electrode-orifice plate distance (H), and the charge Q0 on the droplet produced by the spraying process (34):
| [4] |
| [5] |
In this expression, α is a correction factor to account for the nonuniformity of the electric field and was measured to be 0.8 in the induction charging setup of Reischl et al (34). The dielectric constant of free space (ε0) is 8.89×10⁻¹² F/m and e represents the charge of an electron (e=1.6×10⁻¹⁹ C).
The relation between the diameter of the droplet and the diameter of the residual solid particle after the droplet dries (Dp) is given as follows (34):
| [6] |
where K is the relative concentration of the solution, or volume fraction, defined as the ratio of volume of solute to total volume, which was calculated using the mass fraction of solute and the ratio of initial droplet density (estimated to be the same as water) to particle density (Eq. 3).
The measured values of elementary charges on the particles (Qp) were compared with the theory of Reischl et al. (34) before and after evaporation of the droplets. Reischl et al. used a Faraday cup to measure the total charge of 35 μm droplets generated using three solutions. However, the use of the ELPI in this study allowed the simultaneous measurement of elementary charges for a range of particle sizes. A new correlation was fitted to the Qp experimental data with respect to the experimental parameters (charging voltage, V, final particle aerodynamic diameter, da, and the conductivity of the solution, σ).
Statistical Analysis
Each experiment was repeated at least three times. One-way ANOVA, followed by post hoc Tukey’s HSD (Honestly Significant Difference) analysis was used for the comparison of the charge values using different solutions and charging voltages. All statistical tests were performed using JMP® Pro 10.0.2, (Cary, NC), with a p-value of <0.05 indicating significance.
RESULTS
Figure 2a shows a representative example of the measured current on the 12 ELPI stages vs. the time of nebulization (through 60 s) with a 0.05% w/v AS solution at 5 kV. It is observed that charging is steady during nebulization, which is advantageous considering previous studies that have reported charge decreasing with time due to particles depositing on the electrodes (13). In fact, attempts with other preliminary induction charger designs failed to maintain the charge level as particles covered the charging electrodes. Figures 2b and 2c provide the charge and mass distribution for the same experiment shown in Figure 2a. Only Stages 3–8, with the aerodynamic cut sizes of 0.1–0.96 μm and >1 μg mass on each stage, corresponding to a total of >80% of ELPI mass, were considered in the following analysis since the deposited mass on the other stages was low (≤ 1 μg) and close to the limit of quantification of the HPLC detector in a majority of the cases.
Figure 2.


An example of (a) current profiles vs. time on the ELPI electrometers, (b) total cumulative charge for each ELPI stage, and (c) collected mass on each stage, for a 60 second nebulization of 0.05% AS at a 5kV charging voltage.
The mass median aerodynamic diameters (MMAD) of the aerosols for all solution concentrations and voltage levels were similar, with a mean (± standard deviation) of 0.42 ± 0.05 μm. Although practically negligible, the MMAD increased by increasing the voltage to 5 kV with all four tested solutions (p<0.05). The mean ± standard deviation of the aerosol size geometric standard deviation (GSD) was 1.95 ± 0.16.
Figure 3 shows the number of elementary charges per particle vs. the charging voltage for Stage 6, which had the cut size closest to the MMAD of the charged aerosol (i.e. 0.39 μm). Increasing the charging voltage produced a linear increase of charge/particle for all the nebulized solutions, which is in accordance with the induction charging theory of Reischl et al. (34).
Figure 3.

Effect of charging voltage on the number of elementary units of charge acquired by each particle on Stage 6, with an aerodynamic cut size of 0.39 μm for different solutions. The coefficient of determination is equal to one (R2=1) for the four linear fits.
Figure 4 shows the number of elementary charges/particle (Qp) for particles with diameters of 0.1–1 μm (Stages 3–8) using the four nebulized solutions and 5 kV charging. As expected, increasing the particle size increased the Qp based on the correlation of Reischl et al (34). However, unlike the correlation of Reischl et al, which indicates a linear relation between the size of the particle and charge (Eqs. 4 and 5), our experimental data showed an approximate cubic polynomial correlation between the charge and the size of the particle (34). These cubic correlations for all of the solutions used in this study at 1 and 5 kV induction voltage are listed in Table 1.
Figure 4.

Number of elementary units of charge per particle (Qp) acquired for different aerodynamic diameters collected on Stages 3–8 of the ELPI at 5 kV using different nebulized solutions.
Table 1.
Cubic polynomial correlations fitted to the number of elementary units of charge acquired by each particle (Qp) collected on Stages 3–8 of the ELPI, with aerodynamic cut sizes of 0.095–0.96 μm, at 1 and 5 kV using different nebulized solutions of albuterol sulfate (AS) and sodium chloride (NaCl).
| Nebulized Solution | Least-Square Fit and R2 Charging Voltage of 1 kV | Least-Square Fit and R2 Charging Voltage of 5 kV |
|---|---|---|
| 0.05 % AS | Qp = 3219.1 dp 3.1, R2=0.97 | Qp=14042dp3.4, R2=0.99 |
| 0.05% AS-0.0005% NaCl | Qp = 3319.8 dp 3.1, R2=0.98 | Qp=11077dp3.3, R2=0.99 |
| 0.05% AS-0.01% NaCl | Qp = 3981.4 dp 3.1, R2=0.99 | Qp=10189dp3.1, R2=0.99 |
| 0.1 % AS | Qp = 4341.2 dp 2.9, R2=0.98 | Qp=6807.6dp3.0, R2=0.99 |
To evaluate the induced charge levels for the different nebulized solutions, the total charge collected on Stage 6 of the ELPI, collected charge to mass ratio on Stage 6 (i.e. specific charge, Q/m), and the charge/particle (Qp) at 5 kV are shown in Figure 5. No significant differences were found between the specific charge and charge/particle (i.e. Q/m and QP, respectively) values with all the nebulized solutions. The total charge with 0.1% AS was significantly higher than that of 0.05% AS (p<0.05). In general, a trend in increasing total charge is observed with increasing solute concentration on Stage 6, which was selected based on the highest deposition of drug mass.
Figure 5.

Total and specific charge on Stage 6 (cut size 0.39 μm), which had the maximum charge and mass, for the four nebulized solutions and charging with 5kV. The total charge for 0.1% was significantly different from 0.05% AS (* Tukey HSD, p<0.05). No other significant differences were observed.
In Table 2, the numbers of elementary units of induced charge per particle (Qp) for 0.05% AS-0.01% NaCl at 5 kV are compared with the estimated Qp that could be generated by diffusion and field charging (based on Eqs. 15.24 and 15.25 given by Hinds (32)). Assumptions have been made in the field and diffusion charging equations according to the typical values given by Hinds (32): the mean thermal speed of the ions at 293°K, ci=240 m/s; the concentration of ions at time t, Nit=1013 s/m3; permittivity of pure water, ε=80; field strength, E=5 kV/cm; and mobility of ions, Zi=0.00015 m2/V.s. The field strength is the same in both the induction charger and the correlations from Hinds (32). It is observed that the measured induced charge is higher than the estimated charge level by diffusion and field charging. For liquid droplets a Rayleigh limit is normally considered as the maximum charge limit before repulsion of electric charges within the droplet exceeds the binding force of surface tension (32). The Rayleigh limit is also calculated and given in Table 2 (using a surface tension of 0.073 N/m for water). As expected, the induced charge is less than the Rayleigh limit; however, the Rayleigh limit is only a factor of 3x higher than the induced charge at a size of 0.96 μm, which indicates a highly charged aerosol.
Table 2.
Comparison of number of elementary charges per particle (Qp) in the aerodynamic diameter range of 0.095–0.96 μm with an initial solution concentration of 0.05% AS-0.01% NaCl. The first three columns of Qp are based on analytical estimates for maximum diffusion charging, field charging, and the Rayleigh limit all calculated from Ref. [34]. The final column provides Qp based on ELPI measurements made in this study. In all cases the field strength was 5 kV/cm.
| Particle Diameter (μm) | Diffusion Charging (e) Eq. 15.24 Ref [34] |
Field Charging (e) Eq. 15.25 Ref [34] |
Rayleigh Limit (e) Eq. 15.29 Ref [34] |
Induced Charge/particle (e) 0.05%AS 0.01% NaCl, 5 kV |
|---|---|---|---|---|
| 0.095 | 2.6 | 2.0 | 1306.5 | 8.9 (1.3) |
| 0.158 | 4.9 | 5.5 | 2802.2 | 32.4 (6.5) |
| 0.266 | 9.5 | 15.7 | 6121.1 | 138.2 (34.2) |
| 0.388 | 15.1 | 33.3 | 10783.4 | 411.1 (129.3) |
| 0.621 | 26.7 | 85.4 | 21834.7 | 1820.1 (578.9) |
| 0.96 | 44.9 | 204.1 | 41967.9 | 14045.5 (4120.8) |
The numbers of induced elementary charges per particles with diameters of 0.095–0.96 μm are plotted vs. the induction voltage times the aerodynamic diameter (da) of the dried particles for all cases in Figure 6. These experimental values are compared with the predicted values based on the theory of Reischl et al. (34) using the diameters of the dried particles and the corresponding initial droplet diameters prior to evaporation. The corresponding initial droplet diameter for each final particle size was estimated using Eq. [6]. For each product of da and charging voltage, using the Reischl et al. theory with dried particle size (red circles) underestimates the measured charge. Similarly, calculating the corresponding initial droplet diameter with Eq. [6] and using this value in the Reischl et al. correlation (black diamonds) over predicts the measured charge. Based on the measured MMAD of the particle aerosol (0.42 μm) and known MMAD produced by the nebulizer before evaporation (based on our previous measurements (39): 4.77 ± 0.07 μm), it is assumed that the droplets are fully evaporated. Therefore, it appears that the existing theory does not fully capture the measured particle charge, but can be used to provide upper and lower bounds of charge produced by the new aerosol induction charger.
Figure 6.

Comparison of the measured induced number of elementary charges on the surface of the dried particles (blue squares) with the predicted values based on the theory of Reischl et al. applied to the diameter of dried particles (red circles) and initial droplet diameter prior to evaporation (black diamonds).
The mismatch between the Reischl et al. theory with the experimental data was also apparent in the correlation between Qp and the size of the charged particles (Figure 4 and Table 1). As seen in Figures 3 and 4, the correlation between Qp vs. induction voltage and vs. aerodynamic size was found to be linear and cubic, respectively. In contrast, the existing correlation for induction charging from Reischl et al. (34) predicts a linear relationship between charge and droplet diameter and does not include the effect of solution conductivity. It would be useful to develop a correlation to predict Qp as a function of induction voltage, conductivity, and the particle’s final aerodynamic size. Therefore, an expanded correlation was sought, starting with Eq. [7] as follows
| [7] |
The measured conductivities (σ) for 0.05% AS, 0.05% AS + 0.0005% NaCl, 0.1% AS, and 0.05% AS + 0.01% NaCl solutions were 158.8, 165.3, 313, and 369.3 μS/cm, respectively. The difference between the pure AS and AS+NaCl was in close agreement with known standards for NaCl (e.g. the conductivity of 0.01% NaCl is 210 μS/cm at 25° C).
Using a least square method, the a and b coefficients for use in Eq. (7) were found such that a=49985 and b=−0.5, where the coefficient of determination R2 was 0.93 (Figure 7). The Qp values due to nebulization charging without the electrical field were considered to be relatively small and therefore excluded from this correlation (i.e. V=0). The charging voltage (V) is in kV, the final aerodynamic size (da) is in μm, and the conductivity σ is in μS/cm. The equation in Figure 7 could also be used with field strength (E in kV/m) by substituting the charging voltage with field strength multiplied by the distance between the charging electrode and the vibrating mesh (i.e., point of closest ground potential).
Figure 7.

Correlation for induced elementary charges per particle in terms of charging voltage (V in kV), final aerodynamic diameter (da in μm) and conductivity (σ in μS/cm) compared with the experimental values.
In the proposed correlation (Eq. 7) the range of aerodynamic sizes was 0.1–1 μm, charging voltage 1–5 kV, and the range of conductivities of the four solutions was 159–370 μS/cm. In our experiments, the minimum size with more than 30 elementary charges per particle, the charge level that was suggested to cause effects on lung deposition (13, 25, 31), was 266 nm (on Stage 5) and even at 1 kV the number of charges on this size was 30 or more. For example, with a 0.05% AS + 0.01% NaCl solution and 5 kV, elementary charges per particle with a diameter of 0.96 μm was measured to be 14045 and calculated based on Eq. [7] to be 11506. This level of charge will clearly have a large effect on lung deposition compared to the suggested 30 elementary charges for a 1 μm diameter particle (31).
DISCUSSION
In this study, a new aerosol induction charger is developed and characterized for the production of highly charged submicrometer aerosols. Charge per particle was intensified by the combination of aerosol production followed by evaporation with charge values far exceeding what would be produced by induction charging alone. For all cases considered, charge on the final dried particles was significantly higher than the combination of field and diffusion charging limits that would be achieved for identically sized droplets (Table 2). At the approximate MMAD of the aerosol (0.42 μm), the measured induction charge on the particles was an order of magnitude above the combination of field and diffusion charging. As particle size increases beyond the MMAD (stages with larger cutoff sizes), induced charge per particle approached the Rayleigh limit. The Rayleigh limit was not however exceeded, which is typically associated with a bimodal aerosol as droplet breakup occurs due to electrostatic forces.
Sodium chloride was used as a charging excipient in this study. However, the charge per particle at 5 kV in Table 1 and Figures 3–5 show that although the addition of sodium chloride increased the total charge, the charge per particle decreased possibly due to the effect of sodium halide electrolytes (i.e. NaF, NaCl, NaBr or NaI) on the output of the vibrating mesh nebulizers (40). Najlah et al. (40) recently showed that the addition of sodium halide electrolytes to the solution increased the aerosol output and aerosol mass fraction less than 2.15 μm. Increased mass output from the nebulizer could potentially reduce the charging efficiency by a small amount. Nevertheless, the charges per particle in all cases were considered sufficiently high to target the aerosol dose within the lungs, based on previous findings (1, 13, 31). Specifically, Finlay (31) demonstrated that the ratio of a non-dimensional number (Inc, representing the importance of induced charge) to Stokes number (representing the importance of impaction) will significantly be greater than 1 within generation 12 (lower tracheobronchial region), if the number of elementary charges is at least 43 for a typical breathing pattern (with a mean flow of 18 L/min) and a common pharmaceutical aerosol size (3 μm in diameter). Similarly, it has been shown that if the number of elementary charges on a 1 μm aerosol is greater than 30 it will result in a significant effect of charge compared to sedimentation in the alveolar region (31). Therefore, delivering the aerosol to different regions, especially the alveolar region which is considered challenging, could be enhanced by controlling the size of the aerosol, number of elementary charges and the breathing rate.
The existing induction charge correlation described by Reischl et al. (34) was found to be insufficient to predict induction charge from the device tested in this study. The Reischl et al. (34) correlation is based on data from jet atomization and nebulization with a single vibrating orifice. As described in Eqs. 4 and 5, charge is proportional to droplet diameter and possibly diameter squared if it is assumed that droplet detachment length is proportional to diameter. However, results of this study indicate that the charging trend increases as a polynomial proportional to d 3. This influence of droplet diameter cannot be explained simply by the inclusion of evaporation in the current study because the final particle size is proportional to the size of the initial droplet (Eqs. 4 and 5). A potential explanation is that with vibrating mesh technology in a high strength electric field, the detachment length of the droplet is proportional to d 2. The combination of charge and drying in the experiments means that two physical phenomena are captured by the charging correlation. However, this was considered practical as the generation of submicrometer particles for effective lung targeting at high concentrations requires both induction charging and evaporation of the aerosol. Furthermore, the new correlation includes the effect of solution concentration, within specified ranges, on droplet charge. The resulting correlation can now be directly applied to determine charge on aerosols produced by the induction charger device operated with a pharmaceutical mesh nebulizer. Both electrical field strength and solution concentration can be used to control charge level.
The use of charged aerosols to target the lung deposition of pharmaceutical aerosols has previously been limited by the lack of a practical device that can produce correctly charged submicrometer particles at high number concentrations that provide adequate drug mass. For example, aerosol from electrospray systems are so highly charged that deionization is required to reduce device and extrathoracic deposition. Use of a Corona needle for deionization of electrospray aerosols (8) is known to produce ozone. Mesh nebulizers provided a convenient method for producing high concentrations of pharmaceutical aerosols with well-defined size characteristics. Evaporation of aerosols generated from mesh nebulizers was previously shown to provide a practical source of a submicrometer aerosol for respiratory drug delivery (41, 42). Because evaporation and submicrometer aerosol formation occurs after nebulization, drug delivery rates are not reduced with the use of the smaller aerosol size. The newly developed aerosol induction charger can be safely implemented to provide a source of charged submicrometer aerosols without the production of ozone. While high field strength values are used near the mesh, the current in the system is zero. Furthermore, the charged counter electrode can be covered with a plastic that negligibly affects the field strength making patient contact with the high voltage source impossible provided that the device is not disassembled. In the current system, evaporation of the aerosol and production of the submicrometer size requires the use of high airflow rates (~60–90 LPM). However the unit can be combined with a previously developed mixer-heater that can fully evaporate the aerosol at flow rates as low as 10 LPM (41). The hygroscopic growth of the charged submicrometer size particles within the lungs needs to be considered in clinical applications of the proposed targeted drug delivery technique.
The current experimental setup to measure aerosol charge is different from how the device may be used in practice. In the experimental setup, 90 LPM of air was used to dry the aerosol droplets into particles and flow division with a wye connector was necessary to achieve a flow rate of 30 LPM for the ELPI and to avoid overloading the electrometers with electrostatic charge. Under these conditions, depositional loss in the induction charger was only 3–8% of the nominal (nebulized) dose with the highest deposition occurring with the 1% w/v NaCl concentration and 5 kV charging. Losses in the tubing were on the order of 10%, but are not relevant to a potential clinical application where flow division will not be used. It is envisioned that the device will be implemented for direct inhalation of charged aerosols or inline in mechanical ventilation systems to improve aerosol delivery efficiency and target deposition within lung regions. At reduced flow rates consistent with oral inhalation or mechanical ventilation, liquid output rate of the nebulizer can be modified to achieve sufficient aerosol drying and produce submicrometer particles. Alternatively, new mixer-heater add-on devices can be used with mesh nebulizers to produce submicrometer aerosols (41). Modifications of the charger device may also be necessary to provide low device depositional losses at reduced flow rates. However, it is expected that these modifications will not influence the aerosol charge correlations developed in this study.
In conclusion, the newly developed aerosol induction charger was characterized for different voltages and solute concentrations. Charges on specific submicrometer particle sizes were determined using individual stages of a modified ELPI device. The combination of induction charging and evaporation of the droplets produced a highly charged submicrometer aerosol that may be ideal for targeting lung delivery. The newly developed correlation for predicting particle charge with a mesh nebulizer includes solution concentration and indicates that charge per particle is proportional to d 3, which is different from findings with previous induction charging systems. Both the new charger device and predictive correlation can be applied to potentially develop effective respiratory drug delivery strategies capable of targeting deposition to specific regions of the lungs.
Acknowledgments
Research reported in this publication was supported by the Eunice Kennedy Shriver National Institute of Child Health & Human Development of the National Institutes of Health under Award Number R21HD073728. The content is solely the responsibility of the authors and does not necessarily represent the official views of the National Institutes of Health.
ABBREVIATIONS
- AS
albuterol sulfate
- ci
thermal speed of the ions (240 m/s at 293 °K)
- D
droplet diameter
- Dp
the diameter of residual solid particle in Reischl’s correlation (Eq. 6)
- da
aerodynamic diameter
- E
electric field
- e
charge of an electron or elementary charge unit (e= 1.6 × 10⁻¹⁹ C)
- ELPI
Electrical Low Pressure Impactor
- GSD
geometric standard deviation
- H
induction electrode to orifice plate gap distance
- HPLC
high performance liquid chromatography
- i
the number of recorded ELPI data points (1–60 given the default 1 second sampling time used by the ELPI and 60 seconds nebulization)
- Ii
the current measured at time i for each stage
- Ii+1
the current measured at time i+1 for each stage
- Istage
total current recorded for each stage
- K
relative concentration of solution in Reischl’s correlation (ratio of volume of solute to total volume)
- L
droplet to orifice distance at the instant of droplet separation
- mAS
measured mass of AS on each impactor stage
- mfAS
nominal mass fraction of albuterol sulfate
- mf NaCl
mass fraction of sodium chloride
- MMAD
mass median aerodynamic diameter
- msolute
total mass of deposited solute (i.e. drug and excipient)
- Ni
the concentration of ions
- Q
number of elementary charges on the droplet
- Q/m
specific charge (charge to mass ratio of the ELPI’s stage)
- Q0
number of elementary charges on the droplet by spraying process
- Qp
number of elementary charges per particle
- qstage
total charge on each impactor stage
- ti
the time of data point number i
- ti+1
the time of data point number i+1
- V
charging voltage
- Zi
mobility of ions
- ρparticle
density of the multicomponent particle
- ρAS
density of albuterol sulfate (1.350 g/cm3)
- ρNaCl
density of sodium chloride (2.165 g/cm3)
- α
correction factor to account for the nonuniformity of the electric field
- β
induction charging coefficient in Reischl’s correlation (elementary charges per charging voltage, Eq. 5)
- ε
relative permittivity (dielectric constant)
- σ
conductivity of solution (μS/cm)
References
- 1.Melandri C, Prodi V, Tarroni G, Formignani M, De Zaiacomo T, Bompane GF, Maestri G. On the deposition of unipolarly charged particles in the human respiratory tract. Inhaled particles. 1975;4(Pt 1):193–201. [PubMed] [Google Scholar]
- 2.Prodi V, Mularoni A. Electrostatic lung deposition experiments with humans and animals. The Annals of occupational hygiene. 1985;29(2):229–240. doi: 10.1093/annhyg/29.2.229. [DOI] [PubMed] [Google Scholar]
- 3.Vincent JH, Johnston WB, Jones AD, Johnston AM. Static electrification of airborne asbestos: a study of its causes, assessment and effects on deposition in the lungs of rats. American Industrial Hygiene Association journal. 1981;42(10):711–721. doi: 10.1080/15298668191420585. [DOI] [PubMed] [Google Scholar]
- 4.Byron PR, Peart J, Staniforth JN. Aerosol electrostatics. I: Properties of fine powders before and after aerosolization by dry powder inhalers. Pharmaceutical research. 1997;14(6):698–705. doi: 10.1023/a:1012181818244. [DOI] [PubMed] [Google Scholar]
- 5.Bailey AG, Hashish AH, Williams TJ. Drug delivery by inhalation of charged particles. Journal of Electrostatics. 1998;44(1–2):3–10. [Google Scholar]
- 6.Vinchurkar S, Longest PW, Peart J. CFD simulations of the Andersen cascade impactor: Model development and effects of aerosol charge. Journal of Aerosol Science. 2009;40(9):807–822. [Google Scholar]
- 7.Ijsebaert JC, Geerse KB, Marijnissen JC, Lammers JW, Zanen P. Electro-hydrodynamic atomization of drug solutions for inhalation purposes. Journal of applied physiology (Bethesda, Md: 1985) 2001;91(6):2735–2741. doi: 10.1152/jappl.2001.91.6.2735. [DOI] [PubMed] [Google Scholar]
- 8.Fu H, Patel AC, Holtzman MJ, Chen D-R. A New Electrospray Aerosol Generator with High Particle Transmission Efficiency. Aerosol Science and Technology. 2011;45(10):1176–1183. doi: 10.1080/02786826.2011.582899. [DOI] [PMC free article] [PubMed] [Google Scholar]
- 9.Bailey AG. The inhalation and deposition of charged particles within the human lung. Journal of Electrostatics. 1997;42(1–2):25–32. [Google Scholar]
- 10.Wilson IB. The deposition of charged particles in tubes, with reference to the retention of therapeutic aerosols in the human lung. Journal of Colloid Science. 1947;2(2):271–276. [Google Scholar]
- 11.Yu CP. Theories of electrostatic lung deposition of inhaled aerosols. The Annals of occupational hygiene. 1985;29(2):219–227. doi: 10.1093/annhyg/29.2.219. [DOI] [PubMed] [Google Scholar]
- 12.Ferin J, Mercer TT, Leach LJ. The effect of aerosol charge on the deposition and clearance of TiO2 particles in rats. Environmental Research. 1983;31(1):148–151. doi: 10.1016/0013-9351(83)90071-3. [DOI] [PubMed] [Google Scholar]
- 13.Melandri C, Tarroni G, Prodi V, De Zaiacomo T, Formignani M, Lombardi CC. Deposition of charged particles in the human airways. Journal of Aerosol Science. 1983;14(5):657–669. [Google Scholar]
- 14.Ali M, Reddy RN, Mazumder MK. Electrostatic charge effect on respirable aerosol particle deposition in a cadaver based throat cast replica. Journal of Electrostatics. 2008;66(7–8):401–406. [Google Scholar]
- 15.Majid H, Madl P, Hofmann W, Alam K. Implementation of Charged Particles Deposition in Stochastic Lung Model and Calculation of Enhanced Deposition. Aerosol Science and Technology. 2011;46(5):547–554. [Google Scholar]
- 16.Scheuch G, Gebhart J, Roth C. Uptake of electrical charges in the human respiratory tract during exposure to air loaded with negative ions. Journal of Aerosol Science. 1990;21(Supplement 1 0):S439–S442. [Google Scholar]
- 17.Yu CP, Chandra K. Precipitation of submicron charged particles in human lung airways. Bltn Mathcal Biology. 1977;39(4):471–478. doi: 10.1007/BF02462925. [DOI] [PubMed] [Google Scholar]
- 18.Chan TL, Yu CP. Charge effects on particle deposition in the human tracheobronchial tree. The Annals of occupational hygiene. 1982;26(1–4):65–75. [PubMed] [Google Scholar]
- 19.Azhdarzadeh M, Olfert JS, Vehring R, Finlay WH. Effect of electrostatic charge on oral-extrathoracic deposition for uniformly charged monodisperse aerosols. Journal of Aerosol Science. 2014;68(0):38–45. doi: 10.1089/jamp.2013.1118. [DOI] [PubMed] [Google Scholar]
- 20.Azhdarzadeh M, Olfert JS, Vehring R, Finlay WH. Effect of Induced Charge on Deposition of Uniformly Charged Particles in a Pediatric Oral-Extrathoracic Airway. Aerosol Science and Technology. 2014;48(5):508–514. [Google Scholar]
- 21.Xi JX, Si XHA, Gaide R. Electrophoretic Particle Guidance Significantly Enhances Olfactory Drug Delivery: A Feasibility Study. Plos One. 2014;9(1) doi: 10.1371/journal.pone.0086593. [DOI] [PMC free article] [PubMed] [Google Scholar]
- 22.Xi J, Si X, Longest W. Electrostatic charge effects on pharmaceutical aerosol deposition in human nasal-laryngeal airways. Pharmaceutics. 2014;6(1):26–35. doi: 10.3390/pharmaceutics6010026. [DOI] [PMC free article] [PubMed] [Google Scholar]
- 23.Azhdarzadeh M, Olfert JS, Vehring R, Finlay WH. Effect of Electrostatic Charge on Deposition of Uniformly Charged Monodisperse Particles in the Nasal Extrathoracic Airways of an Infant. Journal of aerosol medicine and pulmonary drug delivery. 2014 doi: 10.1089/jamp.2013.1118. [DOI] [PubMed] [Google Scholar]
- 24.Wong J, Chan HK, Kwok PC. Electrostatics in pharmaceutical aerosols for inhalation. Therapeutic delivery. 2013;4(8):981–1002. doi: 10.4155/tde.13.70. [DOI] [PubMed] [Google Scholar]
- 25.Cohen B, Xiong J, Li W. The Influence of Charge on the Deposition Behavior of Aerosol Particles with Emphasis on Singly Charged Nanometer Sized Particles. In: Marijnissen JCM, Gradoñ L, editors. Aerosol Inhalation: Recent Research Frontiers. Springer Netherlands; 1996. pp. 153–164. [Google Scholar]
- 26.Ali M, Mazumder MK, Martonen TB. Measurements of electrodynamic effects on the deposition of MDI and DPI aerosols in a replica cast of human oral-pharyngeal-laryngeal airways. Journal of aerosol medicine and pulmonary drug delivery. 2009;22(1):35–44. doi: 10.1089/jamp.2007.0637. [DOI] [PubMed] [Google Scholar]
- 27.Li A, Ahmadi G. Aerosol Particle Deposition with Electrostatic Attraction in a Turbulent Channel Flow. Journal of Colloid and Interface Science. 1993;158(2):476–482. [Google Scholar]
- 28.Chang K-N, Chen Y-K, Huang S-H, Chen C-W, Lai C-Y, Chen C-C. Penetration of charged particles through metallic tubes. Journal of Aerosol Science. 2012;48(0):10–17. [Google Scholar]
- 29.McMurry PH, Rader DJ. Aerosol Wall Losses in Electrically Charged Chambers. Aerosol Science and Technology. 1985;4(3):249–268. doi: 10.1021/es00142a006. [DOI] [PubMed] [Google Scholar]
- 30.Cohen BS, Xiong JQ, Asgharian B, Ayres L. Deposition of inhaled charged ultrafine particles in a simple tracheal model. Journal of Aerosol Science. 1995;26(7):1149–1160. [Google Scholar]
- 31.Finlay WH. 3 - Motion of a single aerosol particle in a fluid. In: Finlay WH, editor. The Mechanics of Inhaled Pharmaceutical Aerosols. London: Academic Press; 2001. pp. 17–45. [Google Scholar]
- 32.Hinds WC. Aerosol Technology Properties, Behavior, and Measurement of Airborne Particles. New York: New York: Wiley; 1999. [Google Scholar]
- 33.Chen J, Davidson J. Ozone Production in the Positive DC Corona Discharge: Model and Comparison to Experiments. Plasma Chemistry and Plasma Processing. 2002;22(4):495–522. [Google Scholar]
- 34.Reischl G, John W, Devor W. Uniform electrical charging of monodisperse aerosols. Journal of Aerosol Science. 1977;8(1):55–65. [Google Scholar]
- 35.Longest PW, Golshahi L, Hindle M. Improving pharmaceutical aerosol delivery during noninvasive ventilation: effects of streamlined components. Annals of biomedical engineering. 2013;41(6):1217–1232. doi: 10.1007/s10439-013-0759-9. [DOI] [PMC free article] [PubMed] [Google Scholar]
- 36.Longest PW, Azimi M, Golshahi L, Hindle M. Improving aerosol drug delivery during invasive mechanical ventilation with redesigned components. Respiratory care. 2014;59(5):686–698. doi: 10.4187/respcare.02782. [DOI] [PubMed] [Google Scholar]
- 37.Delvadia R, Hindle M, Longest PW, Byron PR. In vitro tests for aerosol deposition II: IVIVCs for different dry powder inhalers in normal adults. Journal of aerosol medicine and pulmonary drug delivery. 2013;26(3):138–144. doi: 10.1089/jamp.2012.0975. [DOI] [PubMed] [Google Scholar]
- 38.Worth Longest P, Hindle M. Numerical Model to Characterize the Size Increase of Combination Drug and Hygroscopic Excipient Nanoparticle Aerosols. Aerosol Science and Technology. 2011;45(7):884–899. doi: 10.1080/02786826.2011.566592. [DOI] [PMC free article] [PubMed] [Google Scholar]
- 39.Golshahi L, Tian G, Azimi M, Son YJ, Walenga R, Longest PW, Hindle M. The use of condensational growth methods for efficient drug delivery to the lungs during noninvasive ventilation high flow therapy. Pharmaceutical research. 2013;30(11):2917–2930. doi: 10.1007/s11095-013-1123-3. [DOI] [PMC free article] [PubMed] [Google Scholar]
- 40.Najlah M, Vali A, Taylor M, Arafat BT, Ahmed W, Phoenix DA, Taylor KMG, Elhissi A. A study of the effects of sodium halides on the performance of air-jet and vibrating-mesh nebulizers. International Journal of Pharmaceutics. 2013;456(2):520–527. doi: 10.1016/j.ijpharm.2013.08.023. [DOI] [PubMed] [Google Scholar]
- 41.Longest PW, Walenga RL, Son YJ, Hindle M. High-efficiency generation and delivery of aerosols through nasal cannula during noninvasive ventilation. Journal of aerosol medicine and pulmonary drug delivery. 2013;26(5):266–279. doi: 10.1089/jamp.2012.1006. [DOI] [PMC free article] [PubMed] [Google Scholar]
- 42.Longest PW, Spence BM, Holbrook LT, Mossi KM, Son YJ, Hindle M. Production of Inhalable Submicrometer Aerosols from Conventional Mesh Nebulizers for Improved Respiratory Drug Delivery. J Aerosol Sci. 2012;51:66–80. doi: 10.1016/j.jaerosci.2012.04.002. [DOI] [PMC free article] [PubMed] [Google Scholar]