Abstract
Peptide-receptor radionuclide therapy (PRRT) is a systemically administrated molecular targeted radiation therapy for treatment of neuroendocrine tumors. Fifteen years of clinical use show that renal toxicity, due to glomerular filtration of the peptides followed by local generation of highly reactive free radicals, is the main side-effect that limits the maximum activity that can be administrated for efficient therapy. α1-microglobulin (A1M) is an endogenous radical scavenger shown to prevent radiation-induced in vitro cell damage and protect non-irradiated surrounding cells. An important feature of A1M is that, following distribution to the blood, it is equilibrated to the extravascular compartments and filtrated in the kidneys. Aiming at developing renal protection against toxic side-effects of PRRT, we have characterized the pharmacokinetics and biodistribution of intravenously (i.v.) injected 125I- and non-labelled recombinant human A1M and the 111In- and fluorescence-labelled somatostatin analogue octreotide. Both molecules were predominantly localized to the kidneys, displaying a prevailing distribution in the cortex. A maximum of 76% of the injected A1M and 46% of the injected octreotide were present per gram kidney tissue at 10 to 20 minutes, respectively, after i.v. injection. Immunohistochemistry and fluorescence microscopy revealed a dominating co-existence of the two substances in proximal tubules, with a cellular co-localization in the epithelial cells. Importantly, analysis of kidney extracts displayed an intact, full-length A1M at least up to 60 minutes post-injection (p.i.). In summary, the results show a highly similar pharmacokinetics and biodistribution of A1M and octreotide, thus enabling the use of A1M to protect the kidneys tissue during PRRT.
Keywords: A1M, radioprotection, octreotide, prrt, oxidative stress, antioxidation, kidney, glomerulus, tubule
Introduction
For the past 15 years peptide receptor radionuclide therapy (PRRT) has been used to successfully treat metastatic neuroendocrine tumors [1]. Somatostatin-analogous peptides such as octreotide, labelled with therapeutic radionuclides, are used to treat somatostatin receptor-positive tumors [2]. However, renal toxicity and chronic kidney insufficiency are typical side effects of PRRT. Despite protective measures such as infusion of positively charged amino acids, a delayed loss of renal function has been observed in patients undergoing PRRT due to proximal tubular reabsorption and retention in the interstitium [1,3,4]. It has been observed that patients treated with 177Lu-DOTATATE or 90Y-DOTATOC suffered a creatinine clearance loss of 3.8% and 7.3%, respectively, per year [5].
Radiobiological mechanisms following radionuclide therapy (RNT) include direct effects, such as unrepairable DNA damage leading to cell death (necrosis and apoptosis) in the targeted tissues, but also various forms of secondary effects, such as free radical generation and subsequent oxidative stress. Radiation-induced free radicals are generated as a result of ionization of water molecules, DNA, proteins, membranes and other molecules. Radicals may also be formed by components released from irradiated dead cells, for example mitochondrial enzymes of the respiratory chain producing superoxide radicals. Free radicals and reactive oxygen species (ROS) are highly reactive and can react with proteins, DNA and other molecular components to cause oxidation of human cells and tissues, thus causing unwanted molecular modifications, loss of function and cell death. As a result, a “bystander effect” can be observed, i.e. a biological response in which non-irradiated cells and tissues suffer indirect damage. The “bystander effect” is induced by propagation of stress factors from the directly radiation-exposed cells and manifests as cell death, genomic instability and changes in gene expression [6-9]. Free radicals and ROS have been suggested as important mediators of the “bystander effect” [10-12].
The human organism uses antioxidants and free radical scavengers in order to protect itself against free radicals, ROS and oxidants by preventing harmful oxidation reactions [6]. Important human antioxidants include the enzyme superoxide dismutase (SOD), the hydrogen peroxide-degrading enzymes catalase and glutathione peroxidase, and the heme-degrading enzyme heme oxygenase-1 (HO-1). In a series of recent papers, the 26 kDa plasma and tissue protein, α1-microglobulin (A1M), has been shown to be important in protecting against oxidative tissue damage by functioning both as a scavenger of radicals and heme as well as a reductase and inhibitor of oxidation [13-17]. Several papers demonstrate that A1M protects cell cultures and organ explants against oxidative damage [18-20], partly by accumulating in mitochondria and protecting mitochondrial function [21]. Indeed, infusion of recombinant human A1M has been successfully employed for in vivo treatment of the oxidative stress-related diseases preeclampsia [22] and hemoglobin-induced glomerular injuries [23] in animal models. Of particular interest related to this study, A1M also suppressed the cell death, apoptosis, and up-regulation of stress-response genes in the “bystander” cells of α particle-irradiated cell cultures [24,25].
In a recent study, it was shown that i.v. administrated 125I-labelled A1M displayed a quick turnover (T1/2 in blood = 2.5 min), and was predominantly localized to the kidneys within a few minutes [26]. Based on that localization and the shown protective properties of A1M against radiation-induced tissue damage, we propose A1M-infusion as a strategy to improve somatostatin analogue-based PRRT by reducing kidney damage side-effects. A prerequisite for such an A1M-based co-treatment method is a high degree of co-localization of therapeutic A1M and the somatostatin analogue. Therefore, in this study we correlated the pharmacokinetics and biodistribution of i.v. injected A1M, 125I- and non-labelled, with that of the somatostatin analogue octreotide, 111In- and fluorescence-labelled. The molecular co-distribution was investigated in vivo on the histological and cellular levels.
Materials and methods
Recombinant human A1M
A1M was expressed in E.coli, purified and re-folded as described by Kwasek et al [27] but with an additional ion-exchange chromatography step. This was performed by applying A1M to a column of DEAE-Sephadex A-50 (GE Healthcare, Uppsala, Sweden) equilibrated with 20 mM Tris-HCl, pH 8.0. A1M was eluted with a linear salt gradient (from 20 mM Tris-HCl, pH 8.0 to 20 mM Tris-HCl + 0.2 M NaCl) at a flow rate of 1 mL/min. A1M-containing fractions, according to absorbance at 280 nm, were pooled and concentrated.
125I-labelling of A1M
Radiolabelling of A1M with 125I was done using the chloramine T method [28]. Briefly, A1M and 125I (Perkin-Elmer, NEZ033005MC) were mixed in 0.5 M sodium phosphate, pH 7.5 at final concentrations of 1 mg/mL and 10 mCi/mL, respectively. Chloramine T was added to 0.4 mg/mL and allowed to react on ice for 2 min, and the reaction was stopped by adding NaHSO3 to 0.8 mg/mL. Protein-bound iodine was separated from free iodide by gel-chromatography on a Sephadex G-25 column (PD10, GE Healthcare, Buckinghamshire, UK). A specific activity of around 50-200 kBq/µg protein was obtained.
Octreotide
The somatostatin analogue peptide octreotide was purchased from Mallinckrodt Pharmaceuticals (Mallinckrodt, St Louis, MO, USA) and labeled with 111In according to instructions from the provider. For use in fluorescence experiment, octreotide was purchased pre-labelled with HiLyte Fluor 647 (AnaSpec, Seraing, Belgium). These compounds are referred to as 111In-octreotide and octreotide-647, respectively in this article.
Animal studies
All animal experiments were conducted in compliance with the national legislation on laboratory animals’ protection and with the approval of the Ethics Committee for Animal Research (Lund, Sweden). Male and female NMRI normal and nude Balb/C mice of 6-8 weeks of age (Taconic, Ry, Denmark) were used in this study.
SPECT imaging
Animals were anaesthetized using 2 to 3% isoflurane gas (Baxter; Deerfield, IL, USA) and kept sedated during imaging in the NanoSPECT/CT (Bioscan, Washington DC, USA). Animals were injected i.v. with approximately 5 MBq of 125I-A1M (approximately 1 mg/kg) and 5 MBq of 111In-octreotide (approximately 0.0.02 mg/kg) and imaged 20 minutes p.i. with the NSP-106 multi-pinhole mouse collimator. For 125I-imaging, energy windows of 20% were centered over the 35 keV photo peak and for 111In-imaging, over the 175 and 241 photo peaks. SPECT data were reconstructed using HiSPECT software (SciVis; Goettingen, Germany). CT imaging was performed before each whole-body SPECT. Image analysis was performed using the VivoQuant post processing software (inviCRO, Boston, MA, USA). After SPECT imaging at 1 hour, animals were euthanized and kidneys were resected and embedded in Tissue-Tek® O.C.T™ compound (Sakura Finetek; Alphen aan den Rijn, The Netherlands) and frozen on dry ice. The frozen samples were cryosectioned with a thickness of 10 μm for autoradiography analysis.
Digital autoradiography
Digital autoradiography was performed using the Biomolex 700 imaging system (Biomolex AS, Norway). Two groups of normal mice (n=2) were i.v. injected with 125I-A1M (0.5 MBq, 0.17 mg/kg) or 111In-octreotide (0.5 MBq, 4·10-4 mg/kg). Kidneys were frozen in embedding media (O.C.T., Tissue Tek, PA, USA), using dry ice, and sectioned in a cryostat (Leica Microsystems AB, Sweden) in 50 µm thick sections and imaged in the Biomolex system. Images were reconstructed as described previously using in house software [29].
Biodistribution
Biodistribution studies were conducted to determine the pharmacokinetics and biodistribution of 125I-A1M and 111In-octreotide. 125I-A1M (100 kBq, 0.03 mg/kg) and 111In-octreotide (100 kBq, 0.002 mg/kg) were administrated i.v. through tail vein injection to NMRI mice (n=3 per injected molecule and time point). Animals were terminated at 10, 20, 40, 60 minutes p.i. (both A1M and octreotide studies), 4 and 24 hours p.i. (octreotide study) and blood and organs were sampled, weighed and measured in a NaI (TI) well counter (Wallac Wizard 1480 Wizard, Perkin Elmer). Results were corrected for background and radioactive decay. Organ-specific uptake values were calculated as percent injected activity per gram of tissue (% IA/g).
Western blot
SDS-PAGE analysis was performed on kidney tissue and serum from animals that had been injected i.v. with non-labeled A1M (5 mg/kg). Animals were terminated at 10, 20 and 60 minutes p.i., blood and kidneys were sampled and kidneys were washed and placed in 1 mL PBS. Following mechanical tissue homogenization, tissue was centrifuged at 10,000× g for 10 minutes and the supernatant was transferred to a new tube and used for further analysis as described below. Serum was obtained from the blood samples by centrifugation at 1,000× g for 10 minutes. SDS-PAGE gels (4-20% Mini-Protean TGX Stain-Free, Bio-Rad, Delaware, USA) were run under reducing conditions and the separated proteins were transferred to polyvinylidene difluoride (PVDF) membranes (Immobilon-P, Millipore, Bedford, MA, USA) using Trans-Blot Turbo transfer system (Bio-Rad). PVDF membranes were subsequently blocked and incubated overnight with the IgG-fraction of rabbit polyclonal anti-A1M antiserum (K: 322, 5 µg/ml) as described previously [30], followed by incubation with Alexa Fluor 647-coupled goat anti-rabbit IgG (diluted 3000×; Molecular Probes). The membranes were developed using a ChemiDoc MP Imaging system (Bio-Rad).
Kidney-sample preparation and immunolabeling of A1M
Following simultaneous i.v. injection of 5 mg/kg A1M (non-conjugated) and 3.33 mg/kg octreotide-647 animals were sacrificed at 10, 20, 40, 60 minutes and 4 hours p.i. All time-points were evaluated. Kidneys from 20 minutes and 4 hours p.i. were used for the detailed analyses at the cellular level, including laser confocal scanning microscopy (LCSM) and quantitative image analyses. All experiments were performed and evaluated on both wild-type and nude mice. The analyses show the same labeling pattern in both strains. Therefore, data obtained from the wild-type strain are presented here. Following euthanization, kidneys were removed, directly frozen and embedded in Tissue Tec (Sakura Finetek). The tissue blocks were sectioned in a cryostat (Microm, HM 500O M, Walldorf, GmbH), and sections (10 µm) were collected on SuperFrost plus slides (Merck, Darmstadt, Germany). Serial sectioning was performed, collecting 3-4 sections per slide, of which adjacent slides were used for either chromogen immunohistochemistry (IHC) or immunofluorescence (IF) labeling. Sections were post-fixed in 4% paraformaldehyde (PFA, Sigma, St. Louis, MO, USA, dissolved in PBS, 0.1 M, pH 7.4) for 15 minutes, and rinsed in PBS2 ×5 minutes.
For single labeling of A1M, i.e. immunohistochemistry using chromogen visualization, sections were incubated with 0.03% hydrogen peroxide (H2O2, Merck, Darmstadt, Germany) for 5 minutes. Sections for chromogen or fluorescence visualization were incubated in PBS containing 1% bovine serum albumin (BSA, Sigma, St. Louis, MO, USA) for 30 minutes. Sections were then incubated with rabbit anti-human A1M (K: 322, IgG), diluted 1:7500 (in PBS containing 1% BSA, 0.02% Triton X-100 (Sigma)) for 16 hours at 4°C.
For chromogen visualization of A1M, sections were incubated with goat anti-rabbit IgG conjugated with horseradish peroxidase (HRP, Dako, Glostrup, Denmark) for 20 minutes at RT. The immunoreaction was performed via incubation in a diaminobenzidine (DAB) solution containing 0.03% H2O2, for 10 minutes at RT. Sections were rinsed in PBS (2×10 minutes) and counterstained with hematoxylin (Mayers, Histolab, Gothenburg, Sweden) followed by dehydration in a graded alcohol series and immersion in 100% Xylene. Sections were mounted and cover slipped in Pertex (Mayers, Histolab).
For immunofluorescence (IF) labeling of A1M, used for simultaneous detection of octreotide-647, sections were incubated with rabbit anti-human A1M (K: 322, IgG), as described above, followed by secondary goat ant-rabbit IgG conjugated with Alexa Fluor 488 (AF488, Invitrogen, Molecular probes, USA), diluted 1:150 in PBS containing 1% BSA. Incubations were performed for 45 minutes at RT, followed by incubation in 4’,6-diamidino-2-phenylindole (DAPI, nuclear labeling, Invitrogen, USA) for 15 minutes at RT. A subset of sections were also incubated with phalloidin (binding to F-actin) conjugated with the fluorophore Texas Red for 1 hour at RT to morphologically delineate tubular histology. Sections were rinsed in PBS and were mounted and cover-slipped in anti-fade solution (Prolong Gold, Invitrogen, USA).
Optical detection of A1M and octreotide-647 in kidney sections
Chromogen single labeled A1M was visualized and digitally documented in a bright-field microscope (Leica DMRE). Digital images were collected with a Leica digital camera (DFC 500). Images used for illustrations were corrected for color balance, brightness and contrast.
For simultaneous visualization of IF-labeled A1M (A1M-AF488) and octreotide-647 at histological and cellular levels a Zeiss confocal laser scanning microscope (CLSM, LSM 510 META, Dept. Biology, Lund University) was used. Sections were inspected via scanning of emission from the used fluorophores, i.e. Alexa Fluor 488 (A1M), HiLyte Fluor 647 (octreotide), Texas Red (F-actin) and DAPI (cell nuclei).
The digital image data from confocal microscopy, one or several optical section (Z-stacks), were collected through regions of the cortex, medulla and collecting ducts. The image documentation was used for calculations of the individual presence and co-existence of A1M-AF488 and octreotide-647 fluorescence. For documentation three kidney areas from each section were selected as representative regions (x/y stage position marked and stored by the acquisition software ZEN 2009). Scanning (at 1024×1024 pixel frame size) was performed with a 20×/0.8 Plan Apochromat objective (providing 1.8 µm thick optical section with about 400 nm x/y optical resolution), and with a 63×/1.4 oil immersion Plan Apochromat objective (providing 0.9 µm thick optical sections with about 250 nm x/y optical resolution). The choices of optical sections and scan depths were determined from the center position of the majority of nuclei (DAPI labeling) in the scanned field. Sequential scanning was performed by channels displaying AF488, HiLyte Fluor 647, DAPI and Texas Red fluorescence. For each channel the renal profile with the highest fluorescence intensities was selected as a reference, from which the acquisition settings (laser power, PMT detector gain, digital offset) were optimized and used for all scanned areas. Image illustrations presented here are chosen from the individual optical sections containing areas/structures used for the quantitative measurements.
Quantitative image analysis of octreotide and A1M in kidney sections
CLSM images of octreotide-647 fluorescence and A1M-AF488 IF were used for the quantitative analysis, and the detailed distribution in renal structures (from cortex, medulla and collecting ducts) and within ductular epithelial cells was investigated. Three areas per CLSM image and between 10 and 20 images per animal were analyzed. The analysis protocol was developed to use as a macro-script with ImageJ software (Version 1.49 g, Rasband, W.S. ImageJ, NIH, USA). Briefly, the CLSM images were displayed with “Stack to Images”, presenting composites of all channels merged together (for AF488, HL647, DAPI and Texas Red). The selection of sample areas was made from the morphology of tubular structures and depicted by nuclear and/or phalloidin labelling. Individual regions for measurement were delimited using the Lasso function. The green (A1M-AF488) and red (octreotide-647) channels were then used as input images and the ratio of separate green or red pixels or their co-localization was investigated using the “co-localization” plug-in.
Statistical analysis
Statistical analysis of co-existence was performed using Origin 9.0 software (Microcal, Northampton, MA, USA). The histogram in Figures 8 and 9 displays representative data obtained from 3 kidneys at each time-point and were plotted as mean ± SEM. All other statistical work was performed using the Excel software (Microsoft, WA, USA).
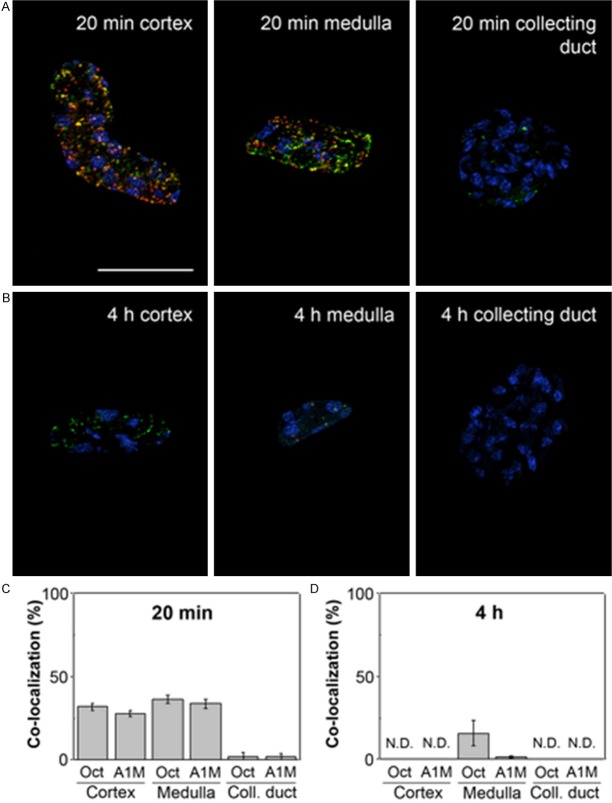
Figure 8.
Tubular localization of A1M and octreotide-A647 at different p.i. times. A1M and octreotide-A647 conjugate were injected i.v. and animals were terminated at 20 minutes (A, C) and 4 hours (B, D) following injection. The percentage of co-localized A1M (green) and octreotide-A647 (red) was calculated in selected tubular profiles in the cortex, medulla and collecting ducts, in confocal microscopic images (20×/0.8 objective). Cell nuclei were visualized using DAPI (blue). Representative profiles (A, B) show different degrees of co-localization (yellow), and the co-localization data from all investigated samples are presented as mean ± SEM of representative areas (C, D). Scale bar represents 50 µm.
Figure 9.
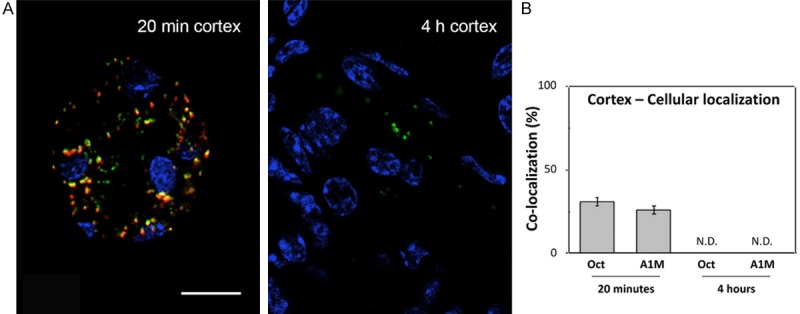
Cellular co-localization of A1M and octreotide-A647 in cortex at high magnification. A1M and octreotide-A647 conjugate were injected i.v. and animals were terminated at 20 minutes and 4 hours p.i. The percentage of co-localized A1M (green) and octreotide-A647 (red) was calculated in selected tubular profiles in the cortex, in high-resolution confocal microscopic images (63×/1.4 objective). Cell nuclei were visualized using DAPI (blue). Representative profiles (A) show different degrees of intracellular co-localization (yellow), and the co-localization data from all investigated samples are presented as mean ± SEM of representative areas (B). Scale bar represents 20 µm.
Results
SPECT/CT image analysis
A qualitative SPECT/CT analysis was performed for both 111In-Octreotide and 125I-A1M which clearly visualizes the activity uptake in the kidneys (Figure 1). The SPECT/CT images demonstrate a high uptake in the kidneys for both molecules. A visibly higher concentration of both 125I-A1M and 111In-Octreotide was observed in the kidney cortex. A slight uptake of 125I in the thyroid can be seen as well, most likely related to free iodide. Activity pooled in the bladder has been suppressed digitally after image re-construction for 111In-Octroetide to better demonstrate the distribution and uptake in kidney.
Figure 1.
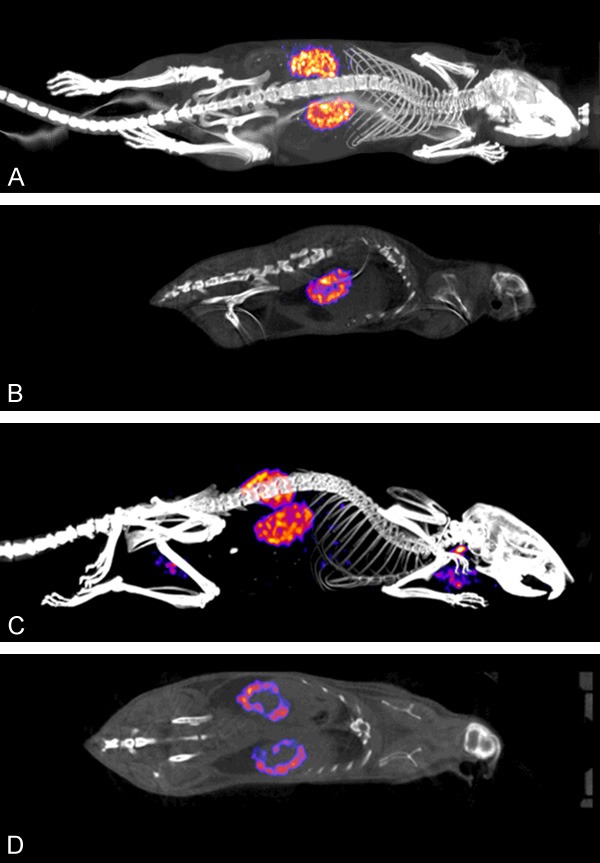
SPECT/CT images of normal NMRI mice injected with 5 MBq 111In-octreotide (A and B) and 5 MBq 125I-A1M (C and D) and imaged for 40 minutes. Three-dimensional re-constructed whole body views (A and C) and planar sections through kidneys (B and D) are shown. Kidneys show high uptake and an accumulation can be seen in the kidney cortex for both molecules. For 125I-A1M, a slight uptake in the thyroids can be observed.
Biodistribution
Figure 2 shows in vivo biodistribution of 125I-A1M at 10, 20, 40 and 60 minutes p.i. (Figure 2A) and of 111In-Octreotide at 10, 20, 40 and 60 min p.i. as well as 4 and 24 h p.i. (Figure 2B). Comparative uptake (% IA/g) of both molecules in the kidneys over time is also illustrated (Figure 2C). High uptake in the kidneys was observed for both 111In-Octreotide and 125I-A1M, with a maximum of 46% and 75% of the injected activity, respectively, at 10 to 20 minutes p.i., suggesting that the uptake of A1M is somewhat faster than the uptake of 111In-Octreotide. Size distribution of injected non-labelled A1M was investigated in serum and solubilized kidneys by SDS-PAGE and Western blot. As shown in Figure 3, A1M migrated as a homogeneous band with an apparent molecular mass around 25 kDa both in kidney tissue and serum at all times, and a minor, faint band around 50 kDa. The strong band most likely represents monomeric A1M with a theoretical molecular mass of 22.6 kDa and the latter the dimeric form. Highest amounts were seen at 10 minutes, supporting the kinetics of 125I-labelled A1M shown in Figure 2C.
Figure 2.
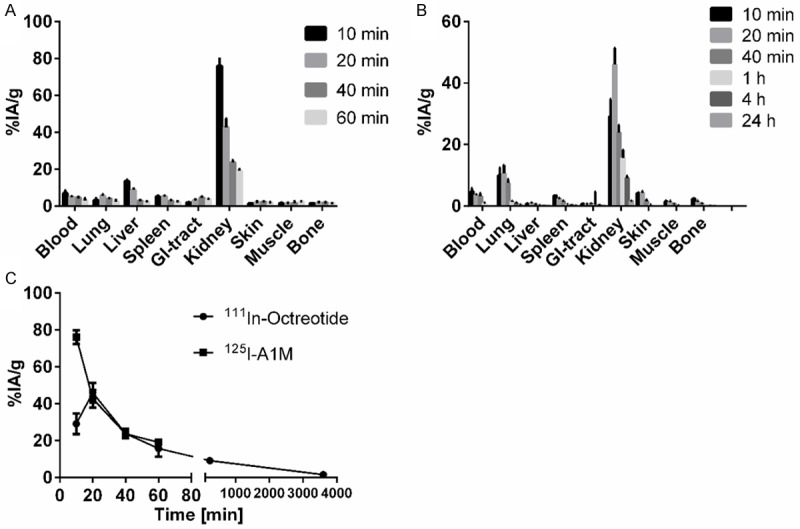
Biodistribution of 125I-A1M (A) and 111In-octreotide (B) in normal NMRI mice. (C) shows uptake over time for both molecules in the kidneys. Data are presented as % IA/g from 4 animals ± SEM.
Figure 3.
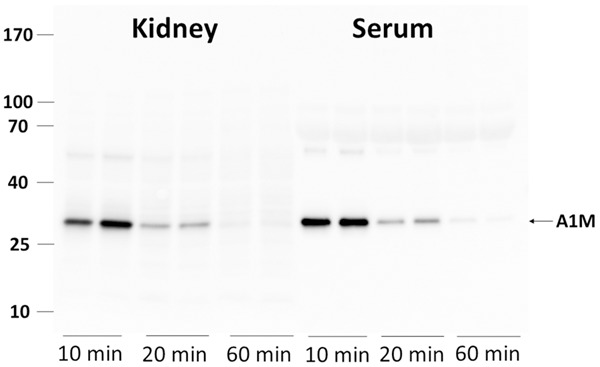
Presence of full-length A1M in normal NMRI mice in kidneys and serum at 10, 20 and 60 minutes p.i. Animals were injected i.v. with 150 μg A1M and blood and kidneys collected at the indicated time-points. The blood was allowed to coagulate and serum separated by centrifugation. One kidney was homogenized in 1 ml PBS and centrifugated. One μl serum and 6 μl supernatant from the kidney homogenate were applied to SDS-PAGE, transferred to PVDF-membranes and blotted with anti-A1M. Each lane represents a separate mouse.
Digital autoradiography
Digital autoradiography results displayed in Figure 4 clearly illustrates the localization of both molecules in the kidney cortex, mirroring the SPECT/CT results. It can be observed that the images are similar at 20 and 60 minutes p.i., indicating that the localization of the peptide and protein is completed after 20 minutes. No obvious further sub-compartmentalization can be observed in these images; notable is that activity distribution is not completely homogenous in the cortex.
Figure 4.
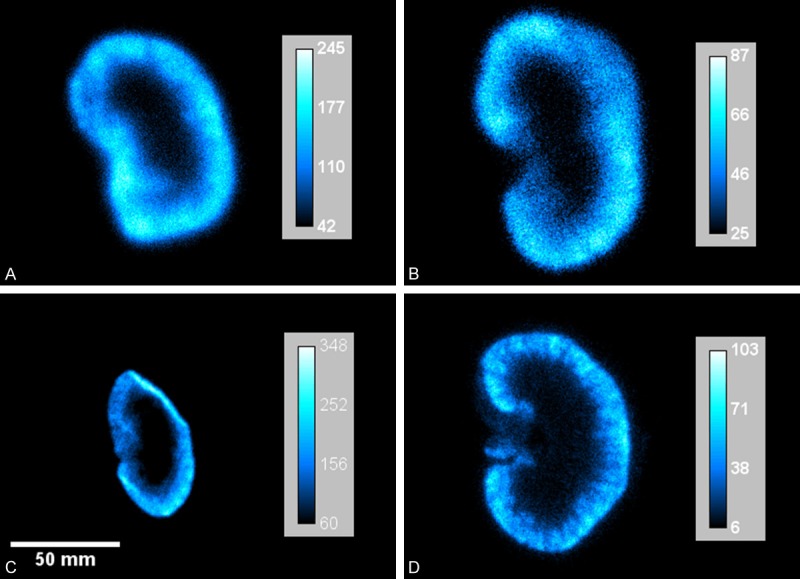
Digital autoradiography images of uptake of 111In-octreotide and 125I-A1M in kidneys of normal mice. A. 125I-A1M, 20 minutes p.i.; B. 125I-A1M, 1 hour p.i.; C. 111In-octreotide, 20 minutes p.i.; D. 111In-octreotide, 1 hour p.i. All images show localized uptake in the kidney cortex for both molecules. Note that the scale of each image has been adjusted to optimally illustrate the relative distribution of the radionuclides in each kidney section.
Fluorescence microscopy
A1M immunoreactivity was predominantly distributed in the cortex, with a gradually decreasing immunoreactivity towards the medulla and collecting ducts, at all investigated time points p.i. Similarly the intensities of A1M immunoreactive labeling were highest in the cortex, weaker in the medulla and weakest in the collecting ducts. The distribution of A1M immunoreactivity in selected areas of the kidneys 20 minutes p.i. is shown in Figures 5 and 6 (left panel). Strong labeling was present in a subset of tubular structures, morphologically depicted to compromise proximal tubules and subsets of glomeruli. Fluorescence double labeling of A1M and octreotide-A647 demonstrated their tubular co-existence, as well as their high degree of intracellular co-localization (Figures 6, 7, 8 and 9). In the medulla and cortex 20 minutes p.i., there was a strong labeling of both molecules, including high degree of tubular co-existence and cellular co-localization (Figure 7). There was a significant decrease in fluorescence detection of both molecules at 4 hours p.i., being relatively low in the cortex and medulla and absent in the collecting ducts (Figure 6). The quantitative analysis of the tubular localization of both molecules (performed from CLSM images 20 minutes and 4 hours p.i.) showed a significantly high cellular co-localization 20 minutes p.i. (Figure 8). The intracellular co-localization of A1M and octreotide-A647 was demonstrated by comparisons of intensities for individual pixels in a designated profile (Figure 9).
Figure 5.
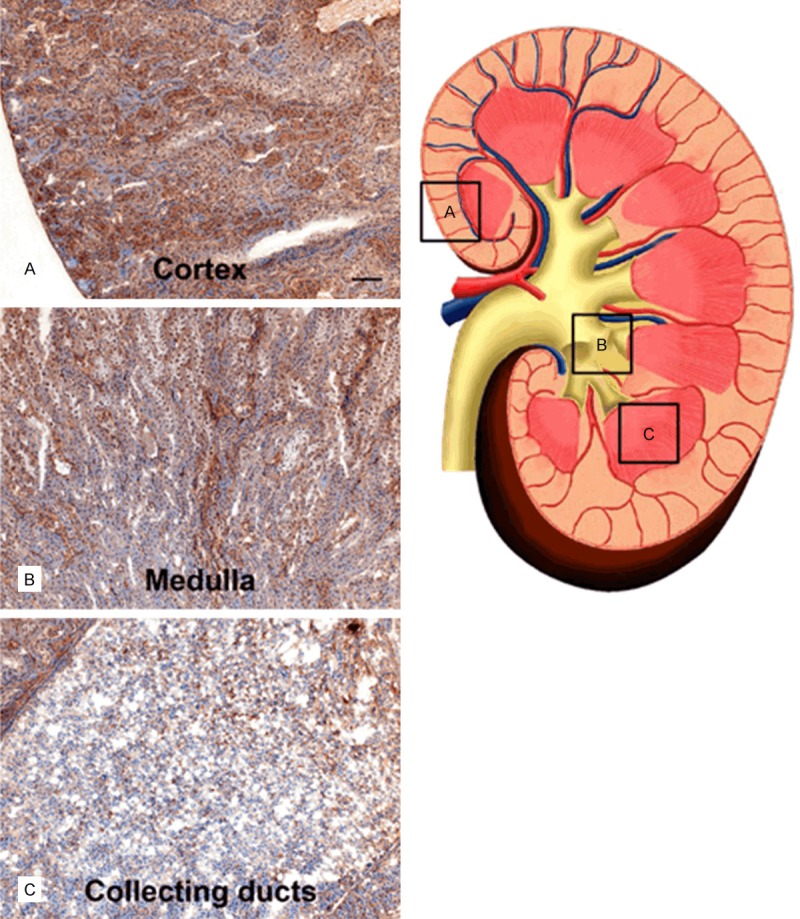
Distribution of A1M immunoreactivity in the kidney 20 min after i.v. injection. A1M immunoreactivity was detected with the K: 322 anti-A1M antibody, using IHC. The left panel shows representative areas with A1M-immunoreactivity in the cortex (A), medulla (B), and collecting ducts (C), the location of these areas is indicated with (A-C) and highlighted with boxes in the schematic drawing in the right panel. Scale bar represents 100 µm in (A-C).
Figure 6.
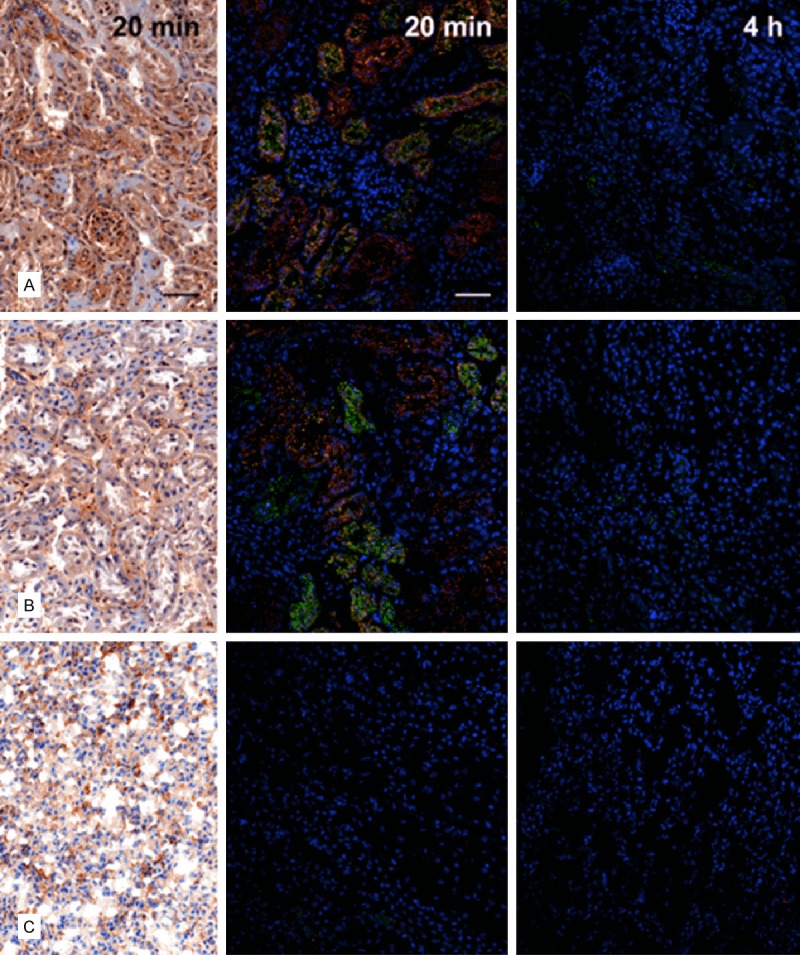
Distribution of A1M immunoreactivity and octreotide-A647 in the kidney 20 minutes and 4 hours after i.v. injection. A1M immunoreactivity was detected with the K: 322 anti-A1M antibody, using IHC (left column; bright-field microscopy) or IF (middle and right columns; confocal microscopy) in cortex (A), medulla (B), and collecting ducts (C). Distribution of A1M IF (green) and octreotide-A647 (red), and their tubular co-localization (yellow), was investigated at 20 minutes (middle) and 4 hours (right) p.i. Cell nuclei were visualized using DAPI (blue). Scale bar represents 50 µm.
Figure 7.
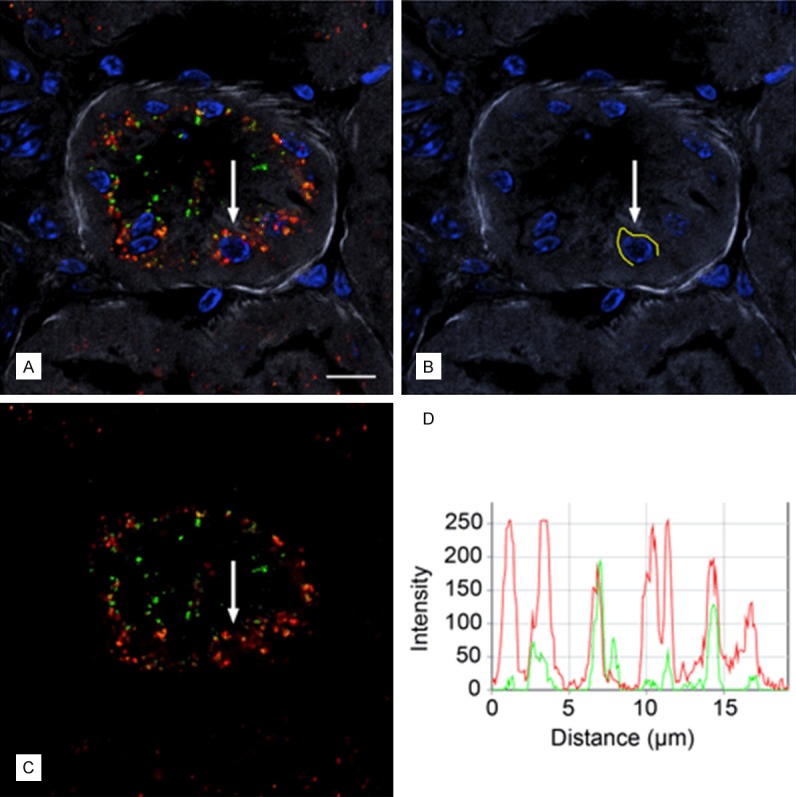
Cellular co-localization of A1M IF and octreotide-A647 following i.v. injections. A1M and octreotide-A647 conjugate were injected i.v. and animals were terminated at 20 minutes following injection. High-resolution (63×/1.4 objective) confocal microscopic image shows the intracellular distribution of A1M IF (green) and octreotide-A647 fluorescence (red). Cell nuclei were stained with DAPI (blue), and phalloidin-Texas Red labeling (grey) was used to delineate tubular profiles. Resolution of punctuate fluorescence in one cell (A; arrow) was shown by measuring fluorescence intensities along a profile in the cytoplasm just outside the nucleus (B; yellow line), giving the intensities along the profile in the red and green channels (C) as an intensity profile (D) with 8 bits (256 intensity levels) per channel. Scale bar represents 10 µm.
Discussion
Infusion of A1M could potentially reduce the renal side effects observed during PRRT with improved patient outcome. However, in order to design and conduct an adequate pre-clinical study, it is of great importance to understand and characterize the pharmacokinetics and biodistribution of A1M compared with the somatostatin analogues used in radionuclide therapy of neuroendocrine tumors. In the present study, the degree of co-localization of A1M and the somatostatin analogue octreotide was thoroughly investigated on organ, tissue and cellular levels using several imaging techniques.
The biodistribution and pharmacokinetic results showed a high uptake in the kidneys with a maximum uptake at 10 to 20 minutes p.i. for both A1M and octreotide, with overlapping kinetics during the clearance phase (Figure 2). Mirroring the biodistribution results, SPECT imaging shows high uptake in the kidneys for both molecules. A higher concentration of both octreotide and A1M can be observed in the kidney cortex as compared to the medulla, indicating co-localization in these regions already after 20 minutes. This suggested that the A1M infusion should be done at the same time, or shortly after the octreotide injections. The rapid clearance of A1M from the kidneys also indicates that repeated infusions of A1M may be needed in order to obtain optimal protection of the kidneys.
A noticeable difference in contrast and resolution can be observed between the 125I-A1M (4A and B) and 111In-octreotide (4C and D) autoradiography images. This is due to the different emission spectra from the two radionuclides. Apart from its low-energy conversion electrons (30.6 keV), 125I also emits low energy x-ray photons at 27.5 and 27.2 keV. These photons largely contributes to the noise in the image and the proximity in energy to the conversion electron makes them difficult to exclude from the final image [29].
Several previous IHC investigations have reported a localization of endogeneous A1M in kidney tissues [31,32] with a predominant distribution to the proximal tubules. In this study, injected recombinant A1M was localized primarily to the proximal tubules, supporting that the protein follows the natural route of endogeneous A1M. Here, intracellular localization of the injected A1M in the proximal tubular cells was demonstrated, and a subset of glomeruli were shown to contain A1M. This has not previously been reported. The protein is expected to be filtrated in the glomeruli and the lack of detection in previous studies may therefore be due to a lower steady state concentration of endogeneous A1M as compared to the injected bolus amounts of recombinant A1M used here.
A prerequisite for a protective action of A1M is of course that the protein is not degraded immediately after its distribution to in the kidneys. Our study show (Figure 3) that the majority of A1M found in the kidneys display an intact, full-length A1M at least up to 60 minutes p.i. A natural route of A1M in the kidneys, similar to most small plasma proteins, is glomerular filtration from blood to the primary urine, followed by reabsorption and lysosomal degradation in the proximal tubular epithelium [33,34]. Our results suggest however that although a large part is expected to be degraded in the proximal tubular cells, a significant amount of A1M may escape degradation and is left intact and functional during the first 10-60 min.
It has previously been shown that alpha-particle-induced damage to cell cultures is inhibited by A1M [24,25]. Protection was seen on both directly irradiated cells and non-irradiated bystander cells, and the effect was stronger on the latter. Thus, the levels of oxidation markers, up-regulation of antioxidation and stress-response genes, and apoptosis of the bystander cells were reduced by addition of A1M, in many cases even down to below the levels of non-irradiated cells [24,25]. It is likely that several mechanisms of A1M are involved in the protection of irradiated and bystander cells. 1) A1M is a potent scavenger of free radicals [15-18] and may therefore counteract the propagation of radical- and ROS-mediated damage on DNA, proteins and membranes induced by exposure to the ionizing irradiation [10-12]. 2) A1M has been shown to target mitochondria in damaged cells and protect the mitochondrial functions during apoptotis, nectrosis and oxidative stress [21]. 3) A1M is a reductase [14] shown to have repair functions, i.e. oxidative lesions on cells and extracellular matrix were shown to be reduced by treatment with A1M [19]. Thus, these protective mechanisms of A1M may be engaged to inhibit the irradiation-induced, oxidative stress-related, kidney damage during PRRT.
In this study, we used 111In-octreotide instead of clinically administered radiopharmaceuticals such as 177Lu-DOTATATE and 90Y-DOTATOC to study co-localization. Being somatostatin analogues, their pharmacokinetics are to be similar, but a potential discrepancy in distribution and uptake over time can be considered. Further, we have not yet demonstrated the renal protective properties of A1M, as co-localization of the two molecules alone does not guarantee such an effect. As a next step in the investigation of A1M as a radioprotector of the kidneys, further studies need to be performed including small animal dosimetry and method development to estimate acute and long-term renal damage. Several parameters relating to functional glomerular and tubular damage will be assessed to demonstrate the effects of A1M infusion and its protective properties.
Conclusion
In this study we have characterized the pharmacokinetics and biodistribution of A1M and the somatostatin analogue octreotide on both a macroscopic and microscopic level. Maximum uptake of both molecules occurs after 10-20 minutes and SPECT imaging showed a co-localization of the two substances in the kidney cortex. On a cellular level, IHC and fluorescence microscopy revealed co-existence of both molecules in the proximal tubuli and co-localization in the epithelial cells. The highly comparable pharmacokinetics and biodistribution of A1M and octreotide and the scavenging properties of A1M suggests that A1M is an attractive candidate as a potential mean to protect kidney tissue during PRRT.
Acknowledgements
We wish to thank Maria E Johansson for excellent technical help. Lund University Bioimaging Center (LBIC) is gratefully acknowledged for providing experimental resources. We would also like to thank Anders Örbom for his help in reconstructing digital autoradiography images. This study was performed with generous support from Government funding of clinical research within the NHS (National Health Service), Lund University, Sweden (ALF), the Swedish Medical Research Council (VR), the Royal Physiographic Society in Lund, the Foundation of Greta and Johan Kock, the Foundation of Alfred Österlund, the Crafoord Foundation, and A1M Pharma AB.
Disclosure of conflict of interest
None.
Abbreviations
- A1M
α1-microglobulin
- CLSM
confocal laser scanning microscope
- CT
Computed Tomography
- IA
Injected Activity
- IF
Immunoflourescence
- IHC
Immunohistochemistry
- GFR
Glomerular Filtration Rate
- LCSM
Laser Confocal Scanning Microscopy
- p.i.
Post Injection
- PRRT
Peptide Receptor Radionuclide Therapy
- RNT
Radionuclide Therapy
- ROS
Reactive Oxygen Species
- SPECT
Single Photon Emission Computed Tomography
References
- 1.Bodei L, Mueller-Brand J, Baum RP, Pavel ME, Horsch D, O’Dorisio MS, O’Dorisio TM, Howe JR, Cremonesi M, Kwekkeboom DJ, Zaknun JJ. The joint IAEA, EANM, and SNMMI practical guidance on peptide receptor radionuclide therapy (PRRNT) in neuroendocrine tumours. Eur J Nucl Med Mol Imaging. 2013;40:800–816. doi: 10.1007/s00259-012-2330-6. [DOI] [PMC free article] [PubMed] [Google Scholar]
- 2.Krenning EP, Bakker WH, Breeman WA, Koper JW, Kooij PP, Ausema L, Lameris JS, Reubi JC, Lamberts SW. Localisation of endocrine-related tumours with radioiodinated analogue of somatostatin. Lancet. 1989;1:242–244. doi: 10.1016/s0140-6736(89)91258-0. [DOI] [PubMed] [Google Scholar]
- 3.Svensson J, Berg G, Wangberg B, Larsson M, Forssell-Aronsson E, Bernhardt P. Renal function affects absorbed dose to the kidneys and haematological toxicity during Lu-DOTATATE treatment. Eur J Nucl Med Mol Imaging. 2015;42:947–55. doi: 10.1007/s00259-015-3001-1. [DOI] [PMC free article] [PubMed] [Google Scholar]
- 4.Bodei L, Cremonesi M, Ferrari M, Pacifici M, Grana CM, Bartolomei M, Baio SM, Sansovini M, Paganelli G. Long-term evaluation of renal toxicity after peptide receptor radionuclide therapy with 90Y-DOTATOC and 177Lu-DOTATATE: the role of associated risk factors. Eur J Nucl Med Mol Imaging. 2008;35:1847–1856. doi: 10.1007/s00259-008-0778-1. [DOI] [PubMed] [Google Scholar]
- 5.de Jong M, Krenning E. New advances in peptide receptor radionuclide therapy. J Nucl Med. 2002;43:617–620. [PubMed] [Google Scholar]
- 6.Halliwell B, Gutteridge JM. The definition and measurement of antioxidants in biological systems. Free Radic Biol Med. 1995;18:125–126. doi: 10.1016/0891-5849(95)91457-3. [DOI] [PubMed] [Google Scholar]
- 7.Prise KM, Folkard M, Michael BD. A review of the bystander effect and its implications for low-dose exposure. Radiat Prot Dosimetry. 2003;104:347–355. doi: 10.1093/oxfordjournals.rpd.a006198. [DOI] [PubMed] [Google Scholar]
- 8.Mothersill C, Seymour C. Radiation-induced bystander effects: past history and future directions. Radiat Res. 2001;155:759–767. doi: 10.1667/0033-7587(2001)155[0759:ribeph]2.0.co;2. [DOI] [PubMed] [Google Scholar]
- 9.Little JB, Azzam EI, de Toledo SM, Nagasawa H. Bystander effects: intercellular transmission of radiation damage signals. Radiat Prot Dosimetry. 2002;99:159–162. doi: 10.1093/oxfordjournals.rpd.a006751. [DOI] [PubMed] [Google Scholar]
- 10.Azzam EI, de Toledo SM, Little JB. Oxidative metabolism, gap junctions and the ionizing radiation-induced bystander effect. Oncogene. 2003;22:7050–7057. doi: 10.1038/sj.onc.1206961. [DOI] [PubMed] [Google Scholar]
- 11.Lyng FM, Seymour CB, Mothersill C. Production of a signal by irradiated cells which leads to a response in unirradiated cells characteristic of initiation of apoptosis. Br J Cancer. 2000;83:1223–1230. doi: 10.1054/bjoc.2000.1433. [DOI] [PMC free article] [PubMed] [Google Scholar]
- 12.Lyng FM, Seymour CB, Mothersill C. Initiation of apoptosis in cells exposed to medium from the progeny of irradiated cells: a possible mechanism for bystander-induced genomic instability? Radiat Res. 2002;157:365–370. doi: 10.1667/0033-7587(2002)157[0365:ioaice]2.0.co;2. [DOI] [PubMed] [Google Scholar]
- 13.Allhorn M, Berggard T, Nordberg J, Olsson ML, Akerstrom B. Processing of the lipocalin alpha(1)-microglobulin by hemoglobin induces heme-binding and heme-degradation properties. Blood. 2002;99:1894–1901. doi: 10.1182/blood.v99.6.1894. [DOI] [PubMed] [Google Scholar]
- 14.Allhorn M, Klapyta A, Akerstrom B. Redox properties of the lipocalin alpha1-microglobulin: reduction of cytochrome c, hemoglobin, and free iron. Free Radic Biol Med. 2005;38:557–567. doi: 10.1016/j.freeradbiomed.2004.12.013. [DOI] [PubMed] [Google Scholar]
- 15.Akerstrom B, Maghzal GJ, Winterbourn CC, Kettle AJ. The lipocalin alpha1-microglobulin has radical scavenging activity. J Biol Chem. 2007;282:31493–31503. doi: 10.1074/jbc.M702624200. [DOI] [PubMed] [Google Scholar]
- 16.Olsson MG, Allhorn M, Bulow L, Hansson SR, Ley D, Olsson ML, Schmidtchen A, Akerstrom B. Pathological conditions involving extracellular hemoglobin: molecular mechanisms, clinical significance, and novel therapeutic opportunities for alpha(1)-microglobulin. Antioxid Redox Signal. 2012;17:813–846. doi: 10.1089/ars.2011.4282. [DOI] [PubMed] [Google Scholar]
- 17.Akerstrom B, Gram M. A1M, an extravascular tissue cleaning and housekeeping protein. Free Radic Biol Med. 2014;74:274–282. doi: 10.1016/j.freeradbiomed.2014.06.025. [DOI] [PubMed] [Google Scholar]
- 18.Olsson MG, Olofsson T, Tapper H, Akerstrom B. The lipocalin alpha1-microglobulin protects erythroid K562 cells against oxidative damage induced by heme and reactive oxygen species. Free Radic Res. 2008;42:725–736. doi: 10.1080/10715760802337265. [DOI] [PubMed] [Google Scholar]
- 19.May K, Rosenlof L, Olsson MG, Centlow M, Morgelin M, Larsson I, Cederlund M, Rutardottir S, Siegmund W, Schneider H, Akerstrom B, Hansson SR. Perfusion of human placenta with hemoglobin introduces preeclampsia-like injuries that are prevented by alpha1-microglobulin. Placenta. 2011;32:323–332. doi: 10.1016/j.placenta.2011.01.017. [DOI] [PubMed] [Google Scholar]
- 20.Olsson MG, Allhorn M, Larsson J, Cederlund M, Lundqvist K, Schmidtchen A, Sorensen OE, Morgelin M, Akerstrom B. Up-regulation of A1M/alpha1-microglobulin in skin by heme and reactive oxygen species gives protection from oxidative damage. PLoS One. 2011;6:e27505. doi: 10.1371/journal.pone.0027505. [DOI] [PMC free article] [PubMed] [Google Scholar]
- 21.Olsson MG, Rosenlof LW, Kotarsky H, Olofsson T, Leanderson T, Morgelin M, Fellman V, Akerstrom B. The radical-binding lipocalin A1M binds to a Complex I subunit and protects mitochondrial structure and function. Antioxid Redox Signal. 2013;18:2017–2028. doi: 10.1089/ars.2012.4658. [DOI] [PubMed] [Google Scholar]
- 22.Wester-Rosenlof L, Casslen V, Axelsson J, Edstrom-Hagerwall A, Gram M, Holmqvist M, Johansson ME, Larsson I, Ley D, Marsal K, Morgelin M, Rippe B, Rutardottir S, Shohani B, Akerstrom B, Hansson SR. A1M/alpha1-microglobulin protects from heme-induced placental and renal damage in a pregnant sheep model of preeclampsia. PLoS One. 2014;9:e86353. doi: 10.1371/journal.pone.0086353. [DOI] [PMC free article] [PubMed] [Google Scholar]
- 23.Sverrisson K, Axelsson J, Rippe A, Gram M, Akerstrom B, Hansson SR, Rippe B. Extracellular fetal hemoglobin induces increases in glomerular permeability: inhibition with alpha1-microglobulin and tempol. Am J Physiol Renal Physiol. 2014;306:F442–448. doi: 10.1152/ajprenal.00502.2013. [DOI] [PubMed] [Google Scholar]
- 24.Olsson MG, Nilsson EJ, Rutardottir S, Paczesny J, Pallon J, Akerstrom B. Bystander cell death and stress response is inhibited by the radical scavenger alpha(1)-microglobulin in irradiated cell cultures. Radiat Res. 2010;174:590–600. doi: 10.1667/RR2213.1. [DOI] [PubMed] [Google Scholar]
- 25.Rutardottir S, Nilsson EJ, Pallon J, Gram M, Akerstrom B. The cysteine 34 residue of A1M/alpha1-microglobulin is essential for protection of irradiated cell cultures and reduction of carbonyl groups. Free Radic Res. 2013;47:541–550. doi: 10.3109/10715762.2013.801555. [DOI] [PubMed] [Google Scholar]
- 26.Larsson J, Wingardh K, Berggard T, Davies JR, Logdberg L, Strand SE, Akerstrom B. Distribution of iodine 125-labeled alpha1-microglobulin in rats after intravenous injection. J Lab Clin Med. 2001;137:165–175. doi: 10.1067/mlc.2001.112957. [DOI] [PubMed] [Google Scholar]
- 27.Kwasek A, Osmark P, Allhorn M, Lindqvist A, Akerstrom B, Wasylewski Z. Production of recombinant human alpha1-microglobulin and mutant forms involved in chromophore formation. Protein Expr Purif. 2007;53:145–152. doi: 10.1016/j.pep.2006.10.023. [DOI] [PubMed] [Google Scholar]
- 28.Bailey G. The Chloramine T method for radiolabeling protein. In: Walker JM, Totowa NJ, editors. The Protein Protocols Handbook. Humana Press; 2002. pp. 963–965. [Google Scholar]
- 29.Orbom A, Ahlstedt J, Seren T, Auterinen I, Kotiluoto P, Hauge H, Ostlund K, Olafsen T, Wu AM, Dahlbom M, Strand SE. Characterization of a double-sided silicon strip detector autoradiography system. Med Phys. 2015;42:575. doi: 10.1118/1.4905049. [DOI] [PubMed] [Google Scholar]
- 30.Wester L, Johansson MU, Akerstrom B. Physicochemical and biochemical characterization of human alpha 1-microglobulin expressed in baculovirus-infected insect cells. Protein Expr Purif. 1997;11:95–103. doi: 10.1006/prep.1997.0760. [DOI] [PubMed] [Google Scholar]
- 31.Bouic P, Vincent C, Revillard JP. Localization of alpha 1-microglobulin (HC protein) in normal human tissues: an immunohistochemical study using monoclonal antibodies. Histochem J. 1984;16:1311–1324. doi: 10.1007/BF01003728. [DOI] [PubMed] [Google Scholar]
- 32.Logdberg LE, Akerstrom B, Badve S. Tissue distribution of the lipocalin alpha-1 microglobulin in the developing human fetus. J Histochem Cytochem. 2000;48:1545–1552. doi: 10.1177/002215540004801111. [DOI] [PubMed] [Google Scholar]
- 33.Strober W, Waldmann TA. The role of the kidney in the metabolism of plasma proteins. Nephron. 1974;13:35–66. doi: 10.1159/000180368. [DOI] [PubMed] [Google Scholar]
- 34.Nordberg J, Allhorn M, Winqvist I, Akerstrom B, Olsson ML. Quantitative and qualitative evaluation of plasma and urine alpha1-microglobulin in healthy donors and patients with different haemolytic disorders and haemochromatosis. Clin Chim Acta. 2007;386:31–37. doi: 10.1016/j.cca.2007.07.017. [DOI] [PubMed] [Google Scholar]


