

Abstract
Angiogenesis is essential to tumor progression, and the precise imaging of the angiogenic marker vascular endothelial growth factor receptor 2 (VEGFR-2) may provide an accurate evaluation for angiogenesis during a therapeutic response. With the use of molecular magnetic resonance imaging (mMRI), an in vitro cell assay indicated significantly decreased T1 relaxation values when tumor endothelial cells (TEC), which positively expressed VEGFR-2 (Western blot), were in the presence of the VEGFR-2 probe compared to TEC alone (P < 0.001). For in vivo mMRI evaluations, we assessed VEGFR-2 levels in untreated and OKN-007-treated GL261 mouse gliomas. Regarding treatment response, OKN-007 was also able to significantly decrease tumor volumes (P < 0.01) and increase survival (P < 0.001) in treated animals. Regarding in vivo detection of VEGFR-2, OKN-007 was found to significantly decrease the amount of VEGFR-2 probe (P < 0.05) compared to an untreated control group. Fluorescence imaging for the VEGFR-2 probe indicated that there was colocalization with the endothelial marker CD31 in an untreated tumor bearing mouse and decreased levels for an OKN-007-treated animal. Immuno-fluorescence imaging for VEGFR-2 indicated that OKN-007 treatment significantly decreased VEGFR-2 levels (P < 0.0001) when compared to untreated tumors. Immuno-electron microscopy was used with gold-labeled anti-biotin to detect the anti-VEGFR-2 probe within the plasma membrane of GL261 tumor endothelial cells. This is the first attempt at detecting in vivo levels of VEGFR-2 in a mouse GL261 glioma model and assessing the anti-angiogenic capability of an anticancer nitrone. The results indicate that OKN-007 treatment substantially decreased VEGFR-2 levels in a GL261 glioma model, and can be considered as an anti-angiogenic therapy in human gliomas.
Keywords: Molecular magnetic resonance imaging, glioma, VEGFR-2, angiogenesis, in vivo, GL261
Introduction
Angiogenesis, the formation of new blood vessels from preexisting vasculature, is a hallmark of cancer which plays pivotal roles in tumor development and metastasis [1-3]. Physiological angiogenesis is tightly regulated by pro-endothelial and anti-endothelial growth factors (i.e. endogenous inhibitors) and occurs by a series of complex and interrelated steps [2,4,5]. One of the most potent proangiogenic agents is the well-characterized vascular endothelial growth factor (VEGF) [5]. VEGF acts on vascular endothelial cells through compatible receptor tyrosine kinases VEGF receptor (VEGFR)-1, -2, and -3 [5]. VEGFR-1 is required for the recruitment of haematopoietic stem cells and the migration of monocytes and macrophages, VEGFR-2 regulates vascular endothelial function, and VEGFR-3 regulates lymphatic endothelial cell function [5]. In addition, VEGFR1 and VEGFR2 are highly expressed in different types of cancers such as gliomas [6]. Non-invasive and quantitative imaging of tumor angiogenesis is critical for lesion detection, patient stratification, and monitoring the therapeutic response of cancer patients, including brain tumors [7,8].
Of the many different types of gliomas, glioblastoma (GBM) is the most common, accounting for about 40% of all primary brain tumors [9]. GBM is also one of the most vascular [10] and deadly cancers, with a very low 5-year survival rate of 6% [11]. A number of studies have shown that overexpression of VEGF and/or VEGFRs correlated with poor prognosis in multiple cancer types, including gliomas [12]. Furthermore, it has been also reported that intra-tumoral levels of VEGF and VEGFRs correlate with the histological grade of gliomas [13]. Knowing the dynamic distribution of VEGFRs, especially VEGFR-2, will lead to better understanding of the mechanisms underlying tumor angiogenesis, as well as provide a better tool for cancer diagnosis and treatment [14-15]. Currently, anti-angiogenic agents are routinely used for the treatment of patients with gliomas [16]. However, despite advances in pharmacological and surgical therapy, gliomas remain an incurable disease [16], highlighting the need for new treatment approaches.
OKN-007 (2, 4-disulfophenyl-PBN; or disodium 4-[(tert-butyl-imino) methyl] benzene-1,3-disulfonate N-oxide or disufenton; also previously known as NXY-059) is a very effective compound against in vivo adult glioma models [17-19], and it is currently undergoing clinical trial assessment as a new investigational drug for recurrent adult GBMs. OKN-007 is a small molecule that can traverse the blood-brain barrier and has also anti-inflammatory, antioxidant, pro-apoptotic [20,21], and anti-angiogenic properties [18,19].
Recently, our group used molecular magnetic resonance imaging (mMRI) to evaluate the heterogeneous expression of VEGFR-2 in C6 and RG2 rat glioma models, using a specific VEGFR-2 contrast agent [22]. The study indicated that the C6 gliomas have more VEGFR-2 occurring in the relatively large vessels within the tumor periphery, whereas the RG2 glioma may have increased VEGFR-2 in the microcapillaries within the tumor interior [22].
In this study, we wanted to assess the anti-angiogenic potential of the anti-cancer agent, OKN-007, using VEGFR-2 targeted mMRI in a mouse GL261 glioma model. Fluorescence imaging to confirm that the VEGFR-2 probe is associated with endothelial cells and that OKN-007 directly affects VEGFR-2 levels, as well as in vitro binding affinity assessment of the VEGFR-2 probe for tumor endothelial cells (TEC), was also conducted.
Materials and methods
Synthesis of anti-VEGFR-2 MRI contrast agent
The contrast agent, biotin-BSA (bovine serum albumin)-Gd-DTPA, was prepared as previously described by our group [23], based on the modification of the method developed by Dafni et al. [24]. The estimated molecular weight for the biotin-albumin-Gd-DTPA moiety is ~80 kDa. It is estimated that there are 1.3 biotin and 23 Gd-DTPA groups bound to each BSA molecule. Briefly, anti-VEGFR-2 mAb (Santa Cruz Biotech, Inc., CA, USA) was conjugated to the albumin moiety through a sulfo-NHS (N-succinimidyl-S-acetylthioacetate)-EDC (N-succinimidyl 3-(2-pyridyldithio)-propionate) link according to the protocol of Hermanson [25]. Each animal was injected with 200 μl anti-VEGFR-2-BSA-Gd-DTPA-biotin (VEGFR-2 probe) [22,26,27] intravenously via the tail vein with an amount estimated to be 200 μg anti-VEGFR-2 and 100 mg biotin-BSA-Gd-DTPA per injection. The estimated molecular weight of the VEGFR-2 probe is 232 kDa (see Figure 1A). To verify the molecular weight of the VEGFR-2 probe, electrophoresis was done. Briefly, the probe was mixed 1:1 with sample buffer, and boiled for 2 min. The sample was then pipetted into a gel (TGX gradient 4-15% gel from Bio-Rad), and the gel was run at 100 V constant for 90 min. The protein bands were visualized using Coomassie Brilliant Blue. For the immuno-electron microscopy study, an IgG contrast agent was used for a non-specific isotype control [22,27].
Figure 1.
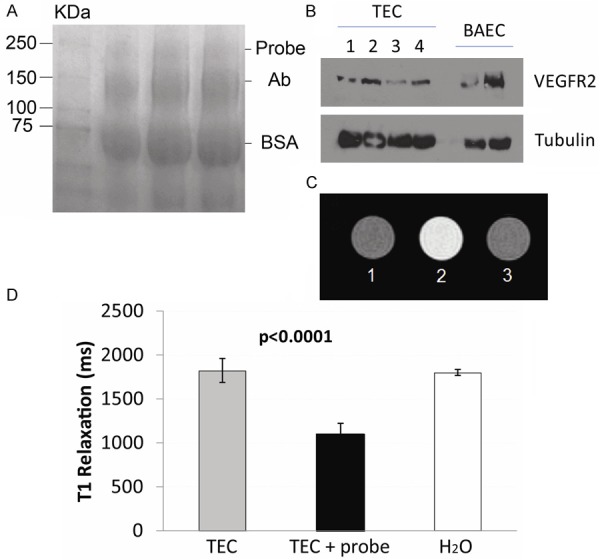
Characterization of the VEGFR-2 probe. A. Electrophoresis gel showing a band at ~232 kDa for the anti-VEGFR-2 probe (Probe), as well as bands for the anti-vEGFR-2 antibody (Ab) and BSA at 150 and 66 kDa, respectively. B. Western blot for expression of VEGFR-2 in tumor endothelial cells (TEC) or bovine aortic endothelial cells (BAEC; positive control). C. Representative T1-weighted MR images of vials containing: (1) TEC alone (TEC), (2) TEC with the VEGFR-2 probe (TEC + probe), or (3) water alone. D. T1 relaxation values (ms) from TEC with or without the VEGFR-2 probe. There was a significant decrease in T1 values for TEC with the VEGFR-2 probe (P < 0.0001) compared to cells alone.
In vitro assessment of the anti-VEGFR-2 probe
Tumor endothelial cells (TEC) were isolated according to a protocol described by Miltenyi Biotech (Miltenyi Biotech Inc., San Diego, CA). Briefly, Lewis lung Carcinoma (LLC) tumors (~1 cm diameter) were isolated from s.c graft tumors from C57BL6 mice. Isolated tumor tissue was enzymatically digested (mixture of collagenases, DNAses and Dispases) for 1 hour, followed by depletion of CD45+ cells using CD45 microbeads (Miltenyi Biotech Inc.). In order to separate tumor endothelial cells, the cells were further passed through anti-CD31 microbeads (Miltenyi Biotech Inc.), and CD31 positive cells were eluted and cultured in endothelial medium (Lonza Group Ltd., Allendale, NJ). Cultured TEC cells were confirmed using an endothelial specific marker, vWF (Abcam, Cambridge, MA), and VEGFR2 (Cell Signaling Technology, Danvers, MA) expression was confirmed with fluorescence staining and Western blot assessments. Mouse GL261 cells were grown in flasks in complete growth medium (DMEM Media with 10% fetal bovine serum (FBS), Invitrogen, Grand Island, NY, USA) to confluency. Two to three hours before treatment, the growth medium was replaced with serum-free medium.
For analysis of VEGFR2 expression, tumor endothelial cells (TEC) or bovine aortic EC were lysed with a lysis buffer (50 mm Tris-HCl, pH 6.8, 5% β-mercaptoethanol, 2% SDS, and protease inhibitors). After addition of 4× SDS sample buffer and incubation at 95°C for 5 min, samples were subjected to SDS-polyacrylamide gel electrophoresis and transferred to Amersham Protran 0.45 μm NC membrane (GE Healthcare Life Sciences). The membranes were then probed with anti-VEGFR2 antibody (Cell Signaling Technology) visualized by SuperSignal West Pico Chemiluminescent Substrate (Thermo Scientific) as described previously [28].
For in vitro MRI assessment of the anti-VEGFR-2 probe, vials were prepared containing TEC (106) alone, TEC with the anti-VEGFR-2 probe, or water (no cells). In the samples that contained the probe, 2 µg of the anti-VEGFR-2 probe (based on antibody calculation), and cells were incubated for 45 min. Following incubation, cells were collected, washed with PBS, centrifuged (500 rpm), and the pellet was resuspended in PBS for MR imaging. Each measurement was repeated 6 times per treatment group. MRI signal intensities were obtained using RARE sequence (Rapid Aquisition with Relaxation Enhancement) [repetition time (TR) 1300 ms, echo time (TE) 9.0 ms, refocusing flip angle 180°, 256 × 256 matrix, 4 signal averages per acquisition, 3.50 × 3.50 cm2 field of view (FOV), 1 mm slice thickness]. T1 values were obtained using a RARE-variable TR (TR 200, 400, 800, 1200, 1600 and 2000 ms; TE 15 ms; 256 × 256 matrix; 2 signal averages per acquisition; 3.50 × 3.50 cm2 FOV; slice thickness 1.0 mm). T1 relaxation times were calculated using Paravision (5.0) software.
Intracerebral glioma cell implantation
All animal studies were conducted with the approval of the Oklahoma Medical Research Foundation Institutional Animal Care and Use Committee. As a model for orthotopic intracranial brain tumors, a GL261 mouse glioma model was used (n = 17). GL261 mouse glioma cells were implanted intracerebrally in C57BL6/J mice. The heads of anesthetized mice were immobilized (stereotaxic unit; Kopf Instruments, Tujunga, CA), and with aseptic techniques, a 1 mm burr hole was drilled in the skull 1 mm anterior and 2 mm lateral to the bregma on the left side. A 20 μL gas-tight Hamilton syringe was used to inject 2 × 10⁴ GL261 cells (in 10 μL of PBS) into the left frontal lobe at a depth of 1.5 mm relative to the dural surface in a stereotaxic unit. The cell lines were maintained and expanded immediately prior to inoculation. Following injection, the skin was closed with surgical sutures.
OKN-007 treatment
OKN-007 (2, 4-disulfophenyl-N-tert-butyl nitrone, Ryss Laboratories, Union City, CA) was administered to the mice in their drinking water at a concentration of 150 mg/kg/day (0.20% w/v for a 20 g mouse). The treatment started at 13-15 days after glioma cell implantation, when the tumor volumes were between 10 and 15 mm3. The treatment was administered continuously until the end of the study. Mice receiving normal drinking water were used as UT controls. The amount of OKN-007 consumed by each mouse, which were housed in separate cages, was determined by weighing water bottles each day. No significant deviation was observed in the volume of liquid uptake of compound in these mice. The average intake of OKN-007 was approximately 140-150 mg/kg/day. Mortality was recorded daily along the study period to calculate the percentage survival of all animals.
In vivo magnetic resonance techniques
Morphological imaging
Nude mice were anesthetized and positioned in a stereotaxic cradle. A 30-cm horizontal bore Bruker Biospin magnet operating at 7 Tesla (T; Bruker BioSpin GmbH, Karlsruhe, Germany), was used with a S116 gradient set to perform all MRI experiments. A mouse head coil was used for signal detection and a 72 mm quadrature volume coil for transmission. Multiple-slice, multiple echo (MSME) imaging (FOV = 2.50 × 2.50 cm2, TR = 2000 ms, TE = 17.5 or 58.2 ms, matrix = 192, averages = 2, slices = 16, slice thickness = 1 mm) was used to calculate tumor volumes and to inspect tumor morphology. Starting ten days after the GL261 tumor cells inoculation, each mouse brain was imaged in vivo every 2-3 days until the end of the study. Tumor volumes were measured independently by at least three individuals for each dataset.
Molecular MRI
Molecular MRI was performed when the tumor volumes were close to their maximum tumor volumes (120-180 mm3). A variable-TR RARE sequence (rapid acquisition with refocused echoes, with multiple TRs of 200, 400, 800, 1200 and 1600 ms, TE of 15 ms, FOV of 3.5 × 3.5 cm2, matrix size of 256 × 256 and a spatial resolution of 0.137 mm) was used to obtain T1-weighted images before and after administration of probe or control contrast agents.
Calculation of relative probe concentration
Relative probe (contrast agent) concentrations were calculated to assess the levels of VEGFR-2 in each animal. A contrast difference image was created from the pre- and (120 minutes) postcontrast datasets for the slice of interest, by computing the difference in signal intensity between the post-contrast and the pre-contrast image on a pixel basis. From a difference image, ten regions of interest (ROI) of equal size (0.05 cm2) were drawn within areas with the highest T1 relaxation in the tumor parenchyma and contralateral side of the brain for each animal after the VEGFR-2 probe injection at the TR 800 ms. The values obtained from the ROIs in the tumor regions were normalized to the corresponding contralateral sides. The T1 relaxation value of the specified ROIs was computed from all the pixels in the ROI by the following equation [29] (processed by ParaVision 4.0, Bruker): S (TR) = S0 (1 - e-TR/T1), where TR is the repetition time, S0 is the signal intensity (integer machine units) at TR 》 T1 and TE = 0, and T1 is the constant of the longitudinal relaxation time. An overlay of the contrast difference image and T1-weighted image was generated using the 3D Analysis Software for Life Sciences Amira® (Fei, Hillsboro, Oregon).
Fluorescence staining
The whole brain of each mouse from each treatment group was removed and fixed in 4% paraformaledhyde solution in phosphate buffered saline, then embedded in Optimal Cutting Temperature (OCT) compound and frozen in liquid nitrogen. Frozen tissue blocks were sectioned at 10 μm, mounted on positive-charged slides, and air-dried for 30 minutes. The tissue samples were permeabilized with 0.01% saponin in PBS (PBS/SAP) (10 minutes at 20°C) and incubated in a mixture of 3% bovine serum albumin and 5% normal donkey serum (host animal of the conjugated detection antibody) in PBS/SAP (1 hour at 20°C). Saponin was kept in all incubation buffers throughout the staining procedure, to ensure a proper penetration of the antibodies. Saponin exclusively removes cholesterol molecules from lipid-containing structures, leaving stable holes large enough for penetration of antibodies.
Next, the tissue sections were incubated with anti-CD31 antibody (BD Pharmingen Purified Rat anti-mouse CD31, catalog number: 550274) overnight at 4°C. The samples were washed 3 × 10 minutes in PBS/SAP, and incubated for 1 hour at 20°C with combinations of appropriate detection antibodies conjugated with fluorescein isothiocyanate and Cy3 diluted 1:100 in 1% bovine serum albumin in PBS/SAP. After washing as above, the sections were mounted between glass slides and coverslips using Vectashield hardset mounting medium (Vector Laboratories, Burlingame, CA) containing TO-PRO-3 iodine (Molecular Probes, Eugene, OR) as nuclear counterstain.
As negative controls for polyclonal antibody staining, the primary antibodies were replaced with equivalent amounts of mouse nonimmune serum. Specimens were examined by epifluorescence confocal imaging using a Nikon C1 confocal laser-scanning unit equipped with a three-laser launcher (488, 543, and 633 nm emission lines) installed on an Eclipse TE200-U inverted microscope (Nikon, Melville, NY). Images were taken with a ×20 plan achromat objective (NA 0.46). Image collection parameters (neutral density filters, pinhole, and detector gains) were kept constant during image acquisition, to make reliable semiquantitative comparisons between the linear and branched regions of the arteries.
The measurement of fluorescence intensity was done as previously described [30]. In brief, 10 images (12-bit, 4095 gray levels/pixel) were collected for each experimental condition, and the mean fluorescence intensity (MFI) of the whole image or 15 to 20 regions of interest (ROIs) per image was integrated using the EZ-C1 software (Nikon). Image collection parameters (neutral density filters, pinhole, and detector gains) were kept constant during image acquisition to make reliable comparisons between specimens. Unpaired t-test statistical analysis of the data was done using Prism 6.0b (GraphPad Software).
Gold labeling immunoelectron microscopy
Brain tissue was obtained from GL261 glioma bearing mice that were administered either VEGFR-2 probe or a non-specific IgG contrast agent with gadolinium (Gd)-DTPA (diethylene triamine penta acetic acid)-albumin construct. Tissues were removed and cut to size of about 2 cm and 3-5 mm thick then fixed in 4% paraformaldehyde + 0.1% glutaraldehyde in 0.1 M phosphate buffer (PB) for 1 hour at room temperature or at 4°C, washed thoroughly with thoroughly with PB (pH 7.3). Tissue was trimmed further to 1-2 mm pieces. Osmication was omitted for labelling procedure. Dehydration was in an ethanol series (50%, 70%, 80%, at 15 min each). Tissue was placed in 2:1 LR White resin (Electron Microscopy Sciences, PA) to 70% ethanol for 1 hour to avoid tissue shrinkage, and then further infiltrated in 100% LR White for 1 hour, overnight, and then two changes for 30 minutes. Tissue was added to gelatin capsules and LR White polymerized at 50°C for 24 hours. Gold-silver sections were placed on nickel grids coated with formvar or colloidin. Sections on grids were protein blocked in Aurion goat gold conjugate (Electron Microscopy Sciences, PA) for 30 minutes, washed in PBS-0.2% bovine serum albumin 3x for 5 minutes at pH 7.4 (Electron Microscopy Sciences, PA). Aurion ultra small gold conjugate-goat anti-Biotin (Electron Microscopy Sciences, PA) in PBS-0.2% BSA-c was applied at 1:100 for overnight at 4°C or for 4 hours at room temperature. Grids were washed in PBS-0.2% BSA-c (pH 7.4), 6x for 5 minutes; in PBS, 3x for 5 minutes; in distilled water 5x for 2 minutes. Silver enhancement was done by placing grids on a droplet of Aurion R-Gent SE-EM enhancement mixture (Electron Microscopy Sciences, PA) for 90 minutes, and then washed in distilled water. Controls involved sections with no secondary antibody (anti-Biotin) and no silver enhancement. Sections were stained with uranyl acetate for 15 minutes followed by lead citrate for 3 minutes. Sections were viewed with a Zeiss T109 electron microscope operated at 80 kV and equipped with a Gatan digital camera and micrograph acquisition software.
Statistical analysis
Statistical analyses were performed using the GraphPad Prism 6 (GraphPad Prism 6 Software, San Diego, CA, USA). Tumor volumes and the VEGRF-2 levels were reported as the mean ± standard deviation. Student t-tests (independent-samples, two-tailed t-test) were used to assess the differences between means of untreated and OKN-007 treated GL261 glioma mice. For statistical analysis, Kaplan-Meier survival curves and Log-rank (mantel-cox) test were used to compare the survival times among the untreated and OKN-007 treated groups. All p values < 0.05 were considered statistically significant.
Results
An in vitro assay was conducted to assess if TEC, which express VEGFR-2, can specifically bind the VEGFR-2 probe. First of all it was determined that TEC do express VEGFR-2, as determined by a Western blot (Figure 1B). Next, in vitro MRI assessment of the anti-VEGFR-2 probe in TEC indicated that the VEGFR-2 probe significantly decreased T1 relaxation values in cells with the probe (P < 0.001) compared to cells alone (Figure 1C, 1D). This result verified that the VEGFR-2 probe had a specific binding specificity for VEGFR-2.
Once it was established that the VEGFR-2 probe could be used to detect VEGFR-2, in vivo mMRI was used with the VEGFR-2 targeting probe to assess the anti-angiogenic effect of OKN-007 in a mouse GL261 glioma model. Initially we established if there was a therapeutic effect of OKN-007 in GL261 glioma-bearing mice. Starting ten days after GL261 tumor cell implantation, all animals from each group (untreated vs. OKN-007 treated) were imaged every 2-3 days until the end of the study. The tumor volumes of the OKN-007-treated animals were significantly smaller (p = 0.0054; 32.95 ± 7.130, n = 4) than the untreated group (103.0 ± 16.96, n = 7) at 21 days following cell injection (Figure 2A-C). Additionally, OKN-007-treated mice were found to survive significantly longer (P = 0.0005; median survival = 30 days; n = 7), compared with untreated animals (median survival = 22 days; n = 10) (Figure 2D). These results indicate that OKN-007 had an anti-cancer effect in GL261 tumors.
Figure 2.
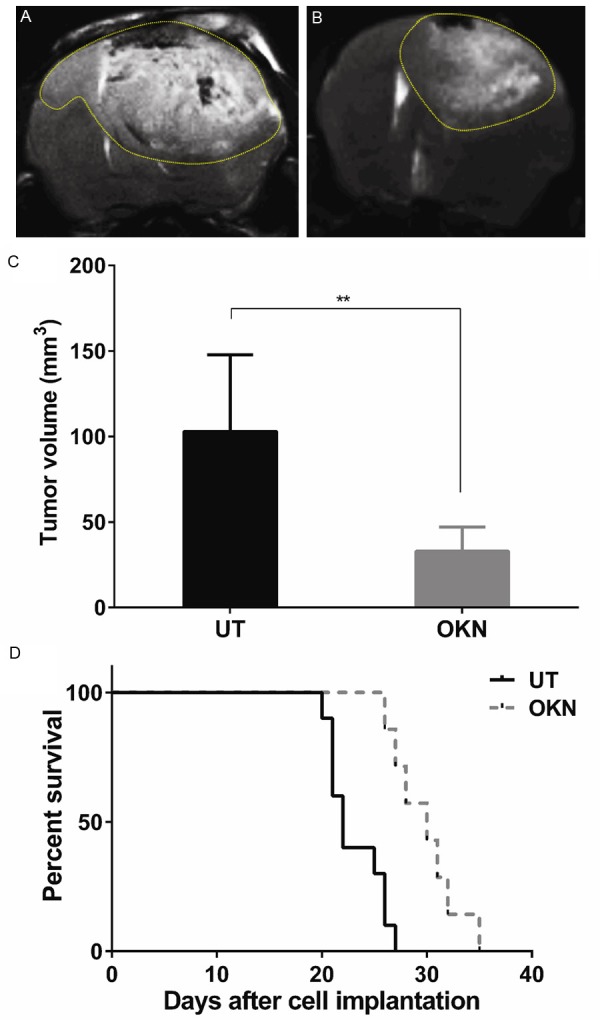
Effect of OKN-007 on tumor volumes and survival for GL261 tumor bearing mice. Representative T2-weighted MR images of UT (A) and OKN-007 (B) treated GL261 gliomas. (C) The OKN-007-treated animals demonstrated significantly smaller tumors (P = 0.0054) when compared with UT animals. (D) The OKN-007-treated animals demonstrated significantly longer survival times (P = 0.0005, median survival = 30) when compared with UT animals (median survival = 22). Values are represented as means ± SD. Asterisks indicate statistically significant differences (**P < 0.01).
In vivo VEGFR-2 targeted mMR images were then obtained to assess the effect of OKN-007 on VEGFR-2 levels. Representative examples of images obtained in GL261 glioma-bearing mice are shown in Figure 3. T2-weighted and T1-weighted morphological images obtained before injection of the VEGFR-2 probe are shown in Figure 3A and 3B respectively. A difference image, which is the subtraction between the T1 images of pre- and 2 hrs after injection of the contrast agent, shows increased anti-VEGFR-2 probe accumulation in Figure 3C, along with representative ROIs in the tumor and contralateral (normal) brain regions. Quantitatively, there were differences in the levels of the VEGFR-2 probe detected in the two different treatment groups, as shown in Figure 4. OKN-007 was found to significantly decrease (P = 0.04137) the levels of the VEGFR-2 probe detected in the treated group (2.54 ± 2.02) compared to the untreated animals (10.12 ± 2.25) (Figure 4C). These results showed that OKN-007 was able to decrease the detection of the VEGFR-2 probe in vivo in GL261 tumors.
Figure 3.
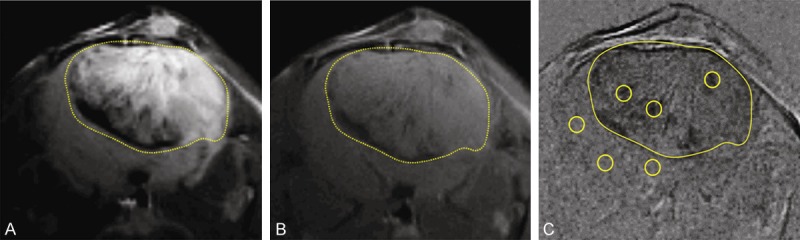
Morphological MR images obtained before and 2 hrs after injection of anti-VEGFR-2 probe (contrast agent) in a F98 rat glioma moldel. Representative T2-weighted (A) and T1-weighted image (B) before injection of the VEGFR-2 probe. (C) Representative difference image, which is the subtraction between the T1 images of pre- and 2 hrs after injection of the contrast agent. The dark regions in the tumor depict areas of increased uptake of the anti-VEGFR-2 probe. Representative ROIs in the tumor and contralateral side of the brain are illustrated as circles in each region. The tumor is delineated by a dashed line in each panel.
Figure 4.
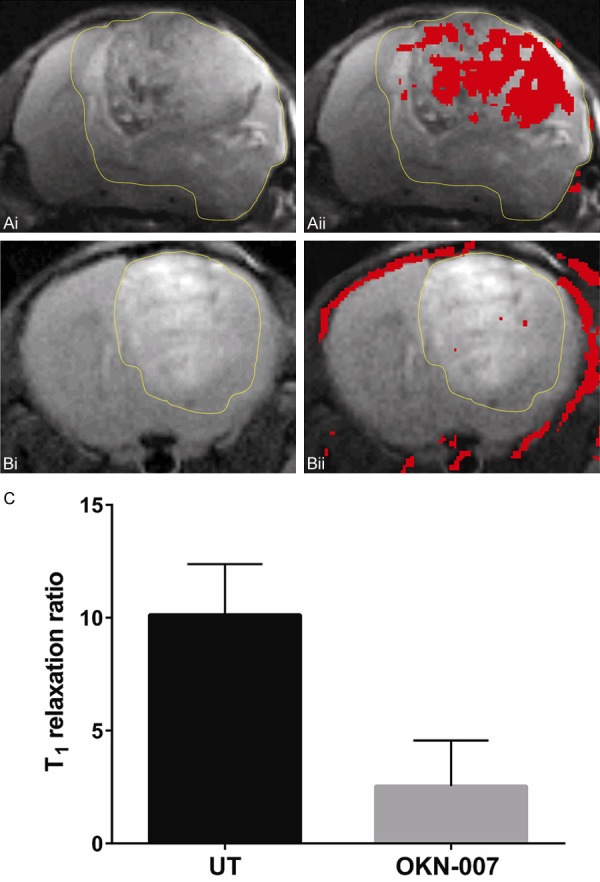
mMRI detection of VEGFR-2 in a GL261 mouse glioma model. Representative MR images from: (A) Untreated and (B) OKN-007 treated GL261 mouse gliomas. (Ai, Bi) T2-weighted images of GL261 glioma. (Aii, Bii) T2-weighted images overlayed with a difference T1-weighted image (red), which was the subtraction between the 2 hr post-contrast and the pre-contrast images after injection of either the anti-VEGFR-2 probe contrast agent. Overlays of the contrast difference images and the T2-weighted images were generated using the 3D Analysis Software for Life Sciences Amira®. (C) OKN-007 was found to significantly decrease (P = 0.4137) (2.54 ± 2.02) the levels of VEGFR-2 in the treated group compared to the untreated animals (10.12 ± 2.25). Values are represented as means ± SD. Asterisks indicate statistically significant differences (*P < 0.05). UT: untreated animals.
It was then important to verify in ex vivo GL261 tumor samples that the VEGFR-2 probe was present using fluorescence imaging. The fluorescence agent Cy3 (red) attached to streptavidin was used to target the biotin moiety of the anti-VEGFR-2 probe in ex vivo excised tumor tissue from a GL261 glioma-bearing mice administered the anti-VEGFR-2 probe in vivo. It was also necessary to demonstrate that the VEGFR-2 probe is associated with endothelial cells. The fluorescence images detecting the VEGFR-2 probe were superimposed with immunofluorescence images for CD-31 (endothelial marker). Co-localization (represented as yellow-orange regions) of the anti-VEGFR-2 probe (red) with CD31 (green) in some areas of glioma tissue from GL261 glioma-bearing mice administered the anti-VEGFR-2 probe was observed (Figure 5), and found to be less for OKN-007-treated samples (Figure 5B) compared to untreated tumors (Figure 5A). Ex vivo VEGFR-2 levels in untreated and OKN-007-treated GL261 tumor samples were also assessed to verify that OKN-007 actually did affect VEGFR-2 directly. Immunofluorescence imaging for VEGFR-2 indicated that the untreated GL261 gliomas had high levels of VEGFR-2, which were significantly higher than GL261 gliomas treated with OKN-007 (P < 0.0001) (Figure 5C-E). These results verified that: (1) the VEGFR-2 probe was higher in untreated GL261 gliomas compared to those treated with OKN-007, (2) the VEGFR-2 probe colocalized with endothelial cells, and (3) VEGFR-2 levels in OKN-007-treated tumors were lower than those detected in untreated tumors.
Figure 5.

Ex vivo detection of the anti-VEGFR-2 probe, colocalization with endothelial cell marker CD31, and detection of VEGFR-2 in untreated and OKN-007-treated GL261 mouse gliomas. Fluorescence images of the anti-VEGFR-2 probe (red) and the endothelial marker CD31 (green) in untreated (Ai-Aiii: 3 separate samples in the mid-tumor regions) and OKN-007-treated (Bi-Biii: 3 separate samples in the mid-tumor regions) GL261 tumor-bearing animals. Note colocalization (yellow-orange) of the anti-VEGFR-2 probe with some endothelial cells in the untreated group. Representative VEGFR-2 immunofluorescence images in untreated (C) and OKN-007-treated (D) GL261 tumor-bearing animals (mid-tumor regions). (E) Mean fluorescence quantification of VEGFR-2 levels from untreated (Tumor) (n = 4, 15-20 ROIs for each) and OKN-007-treated (Tumor + OK007) (n = 4, 15-20 ROIs for each) tissue samples from GL261 tumor-bearing animals. Scale bars for (Ai), (C and D) are 50 µm. Image scaling for images (Aii), (Aiii), (Bi-Biii) are the same as image (Ai).
Electron microscopy was used to detect the possible subcellular location of the VEGFR-2 probe in GL261 glioma cells. Ex vivo immunoelectron microscopy of GL261 mouse glioma tissues after post-embedding incubation with gold-labeled anti-biotin antibody was performed to determine the sub-cellular localization of the anti-VEGFR-2 probe (Figure 6). The gold-labeled anti-biotin was found to be distributed within the endothelial cell and glioma cell plasma membrane/cytoplasm, as well as the nuclei of the GL261 tumor cells in mice administered the anti-VEGFR-2 in vivo (Figure 6A). A control was found to have post-embedding immunogold labeling only in the endothelial cell nucleus (Figure 6B). These results indicate that the VEGFR-2 probe is internalized into the cell membrane/cytoplasm.
Figure 6.
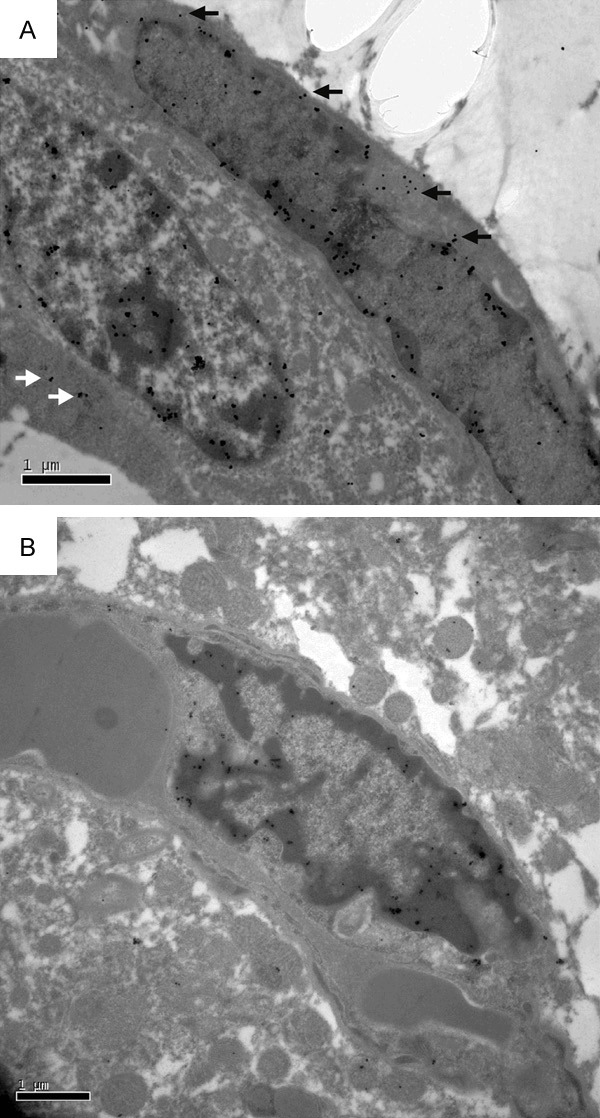
Electron immunomicroscopy detection of the anti-VEGFR-2 probe in the endothelial plasma membrane/cytoplasm and cell nuclei within GL261 rat gliomas. A. Electron immunomicroscopy of a GL261 glioma-bearing mouse administered the anti-VEGFR2 probe. The biotin moiety of the anti-VEGFR-2 probe was targeted with gold-anti-biotin. Note uptake of the gold-anti-biotin in the endothelial plasma membrane/cytoplasm (black arrows) and the glioma cell plasma membrane/cytoplasm (white arrows). Also note increased gold-anti-biotin in the endothelial and glioma cell nuclei. B. GL261 glioma-bearing mouse administered the non-specific IgG-albumin-Gd-DTPA-biotin probe (Control). Note some uptake of the gold-anti-biotin in the endothelial cell nucleus. Scale bar = 1 µm. Magnification = 20,000×.
Discussion
Angiogenesis, the formation of new blood vessels, is a critical step during tumorigenesis and represents a pathological hallmark of cancer [1], and plays a crucial role in glioma development and growth [31]. Briefly, the start of the angiogenesis process requires some angiogenic exogenous stimulus, such as hypoxia, current metabolic requirements, and tumour growth. More than 25 different growth factors and cytokines related to the induction of angiogenesis have been reported [32]. The production of these proangiogenic factors is a result of genetic alterations or is induced by hypoxia. Intratumour hypoxia occurs at the time when there is an imbalance between oxygen supply and demand, due to irregular and chaotic blood flow [33]. Furthermore, when a solid tumor, such as a brain tumor, grows larger than a critical size (1-2 mm in diameter), it must recruit new blood vessels to supply the required oxygen and nutrition levels necessary for its survival and proliferation [16,34]. This process comprises the formation of new blood vessels from preexisting ones, and is a crucial step in the progression of cancer from a small and localized neoplasm to a highly aggressive tumor [16]. Additional details about the angiogenesis process in gliomas can be found in a number of outstanding review articles [16,31,35-37]. Gliomas are highly vascularized tumors [37]. Furthermore, the formation of abnormal tumor vasculature and glioma cell invasion along white matter tracts are proposed to be the major causes of the therapeutic resistance of these tumors [16]. Thus, inhibition of angiogenesis has emerged as a promising strategy for the treatment of brain cancers.
In this study, we demonstrated through conventional and molecular MRI that OKN-007 inhibited the tumor levels of VEGFR-2, tumor growth, and increased survival time in treated GL261 mouse gliomas when compared to the untreated group. Our group has already established that OKN-007 is an effective anti-cancer agent in rodent pre-clinical models for adult GBMs, including F98 [18], U87 [18], and C6 [17,19] glioma models. Furthermore, in an orthotopic rat F98 glioma model and a human U87 xenograft model in athymic rats, OKN-007 significantly increased the survival of treated versus untreated rats [19]. Similarly to our previous studies, OKN-007 was also able to decrease the tumor volumes in the GL261 mouse glioma model. In the present study, the tumor volumes of OKN-007-treated GL261 gliomas were significantly smaller (P = 0.0054) when compared to the untreated group (Figure 2C). MRI is an ideal method for accurately measuring tumor volumes, as it was previously demonstrated that there is a very high correlation when measuring pre-clinical intracranial tumor volumes with MRI compared to histology [38].
The survival time of GL261-tumor bearing mice was also significantly increased after OKN-007 therapy, as we also have previously reported in other adult glioma models [18,19]. The OKN-007-treated group (n = 7) had a median survival of 30 days, which was significantly longer (P = 0.0005) than the median survival of 22 days for the untreated group (n = 10) (Figure 2D). OKN-007 was able to increase the survival time by 8 days in the treated group compared to the untreated animals. Considering that one mouse month is equivalent to ~2.6 human years, based on a 4-year maximum life span [39], OKN-007 could potentially increase survival time in adult GBM patients by ~7-8 months.
There are a number of excellent recent reviews on the use of molecular MRI applications to assess angiogenesis [40-42]. Recently, our group reported the in vivo characterization and distribution of VEGFR-2 in C6 [22,27] and RG2 [22] glioma models using molecular magnetic resonance imaging (mMRI) and an anti-VEGFR-2 gadolinium-based contrast agent. MRI signal enhancement of the VEGFR-2 probe in the RG2 tumor interior was more than twice that for the C6 tumor interior, suggesting more VEGFR-2 from microvessels inside the RG2 tumor [22]. However, compared to C6 gliomas, RG2 gliomas have a relatively more homogeneous pattern for VEGFR-2 levels in the tumor overall [22]. In the C6 glioma, distinctively higher levels of VEGFR-2 were found in peri-tumor and peri-necrotic regions compared to tumor interior regions [27]. Other groups that have used mMRI probes for VEGFR-2 have used aptamer-modified magnetic nanoprobes [43], and a low molecular weight peptoid-(Gd)8-dendron [44]. There are several other MRI methods that can be used to assess vascular alterations, such as perfusion imaging or microvascular MRI [40,45], and hyperpolarized 13C spectroscopy [46], however these methods do not directly target VEGFR-2.
It was also previously demonstrated that OKN-007 is an effective anti-angiogenic compound in vivo, by directly decreasing microvessel density (CD-31) and HIF-1α levels in both F98 and U87 glioma models [18], and ex vivo by directly decreasing the levels of VEGFR-2 in C6 rat gliomas, as measured by Western blots [19]. In the present study we confirmed using the mMRI technique, that OKN-007 was also able to decrease the levels of VEGFR-2 in a preclinical GL261 mouse glioma model (Figure 4).
Specifically, we combined mMRI with a Gd-DTPA-albumin-based contrast agent for signal detection with the specificity of an antibody for VEGFR-2 (anti-VEGFR2 probe), to detect in vivo VEGFR-2 levels in untreated and OKN-007 treated adult GL261 mouse gliomas. To calculate the T1 relaxation ratio, we normalized the T1 relaxation values from the tumor area to the contralateral side of the brain for each of the animal datasets. We used the contralateral side of the brain to normalize the T1 relaxation values of the tumor region as we detected no significant difference (P = 0.1824) in the T1 relaxation values in the two treatment groups within the contralateral brain tissue, 120 minutes after the administration of the anti-VEGFR-2 probe.
We have already demonstrated with immunofluorescence that the anti-VEGFR-2 probe binds to the VEGFR-2 present on both endothelial and tumor cells, via the co-localization of the anti-VEGFR-2 probe with VEGFR-2 expression in a rat C6 glioma model [27]. Co-localization of the anti-VEGFR-2 probe with the endothelial marker, laminin, was also very high in C6 gliomas [27]. In the present study for the mouse GL261 glioma model, fluorescence staining for the biotin moiety of the VEGFR-2 probe at 2 hours post administration of the probe confirmed the distribution of the VEGFR-2 probe similarly to our previous study [27]. Furthermore, the probe also showed co-localization with the endothelial marker CD31 (Figure 5A) indicating that it does target endothelial cells. In addition, in vitro assessment of the binding specificity of the VEGFR-2 probe was shown in TEC (Figure 1C, 1D), with a significant increase in binding to TEC with the probe (P < 0.0001) compared to cells alone. Immunofluorescence imaging for VEGFR-2 levels indicated that OKN-007 was able to specifically decrease the levels of VEGFR-2 (Figure 5C, 5E).
Here we also used immunoelectron microscopy to demonstrate the presence of the anti-VEGFR-2 probe in the cell membrane/cytoplasm and cell nuclei of the endothelial cells and GL261 glioma tumor cells (Figure 6A). During this technique, anti-biotin-gold was used to bind specifically to the biotin group of the anti-VEGFR-2 probe. The IgG contrast agent, which also has a biotin moiety, was not detected at very high levels with the anti-biotin-gold in the plasma membrane/cytoplasm of endothelial or glioma cells. Likewise the level of nuclear staining was less for the IgG contrast agent administered sample in the endothelial and glioma cells (Figure 6B). However, more nuclear staining was found in the endothelial and glioma cells administered the anti-VEGFR-2 probe. Due to the size of the anti-VEGFR-2 probe, we do not think that this probe could be taken up by the cell nuclei. There are possible other reasons that could account for nuclear staining for biotin. It may be possible that the nuclear positive gold-staining could be caused by non-specific staining as a result of secondary labelling of biotin in newly replicated DNA [47,48]; endogenous biotin, which has widely been taken up in the cell nuclei [49]; or biotin could have come from biodegradation of the anti-VEGFR-2 probe. It may also be possible there is unspecific binding, however to rule this out, experiments were conducted without a secondary antibody (silver enhancement was applied), which indicated no labeling or gold particles observed (results not shown). As the control IgG contrast agent sample had little staining for biotin, we surmise that the biotin detected in the cell nuclei from the glioma sample administered the anti-VEGFR-2 probe may be from biodegradation of the probe which had accumulated in the glioma cells of untreated tumors.
Figure 7 depicts the possible anti-angiogenic mechanism of action of OKN-007 in glioma models. We already know from previous studies that OKN-007 decreases the levels of VEGFR-2 [19] and HIF-1α [18] in rat gliomas, and that nitrones such as PBN (α-phenyl-tert-butyl nitrone) decrease NF-κB in a mouse endotoxemia model [50]. There is also evidence that OKN-007 effectively traps free radicals in vitro [51]. Consequently, based on the possible mechanisms-of-action reported for nitrones, and the data reported in this study, OKN-007 can be considered as an effective agent that can inhibit tumor angiogenesis.
Figure 7.
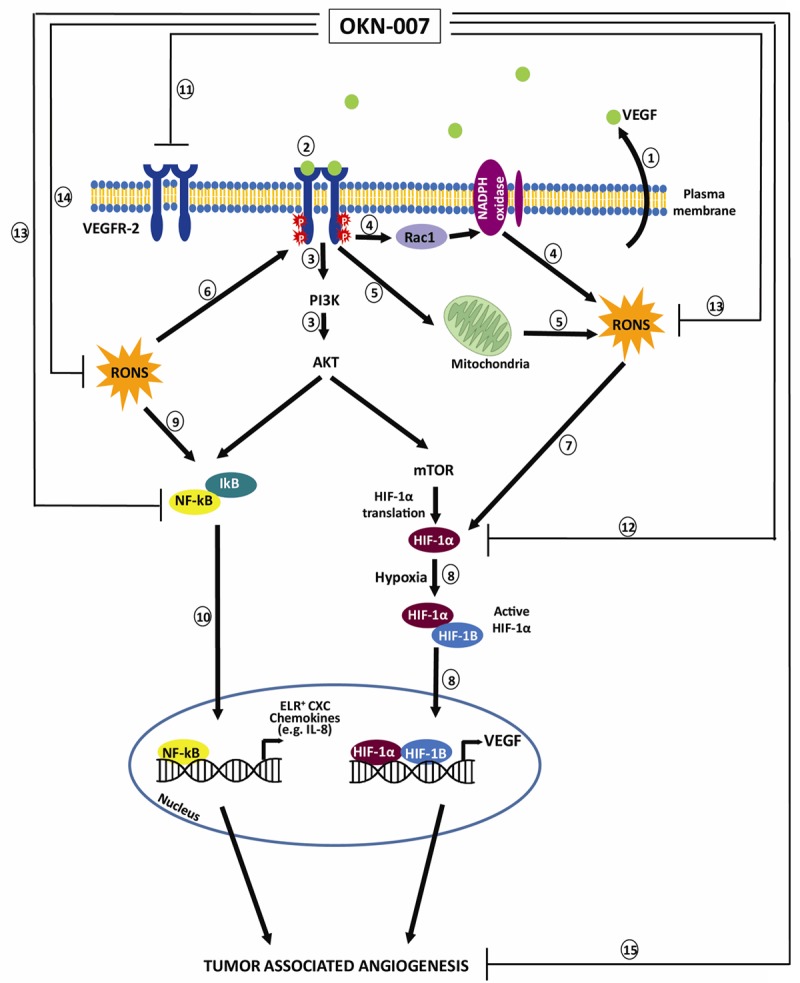
Schematic representation of possible anti-angiogenic mechanisms of action for the anti-cancer agent OKN-007. (1) VEGF is ubiquitously expressed in almost all tumors. Glioma cells have been demonstrated to secrete VEGF, which leads to increased angiogenesis [52]. (2) VEGF exerts its action through binding to VEGFR-2, leading to autophosphorylation of tyrosine residues in the cytoplasmic domain of VEGFR-2 and driving downstream pathway such as PI3K/AKT and MAPK to promote endothelial cells proliferation and migration (3). VEGF also stimulates reactive oxygen and nitrogen species (RONS) production via Rac1-mediated NADPH oxidase activation (4) [53] and also increases mitochondria-derived hydrogen peroxide (H2O2) (5) [54]. (6) RONS, in turn, potentiate VEGFR phosphorylation [52]. RONS can also upregulate VEGF secretion and VEGFR expression through induction of transcription factors HIF-1α (hypoxia-inducible factor-1α) (7) [54-56]. (8) Under hypoxic conditions, the active HIF-1α recognizes and binds to cis elements in the promoter of genes that mediate angiogenesis, such as the gene encoding VEGF [57]. (9) NF-κB (nuclear factor of kappa light polypeptide gene enhancer in B-cell) is normally under strict regulation by its sequestration in the cytoplasm in association with a heterotrimeric complex of NF-κB with the inhibitor of kB (IkB) [57]. (10) Generation of reactive oxygen and nitrogen species (RONS) and activation of PI3 kinase-AKT pathway can converge and activate NF-κB. NF-κB also activates several genes that mediate angiogenesis, such ELR+ CXC chemokines [57]. OKN-007 decreases levels of VEGFR-2 [19] (11) and HIF-1α [18] (12) in rat gliomas, and nitrones such as PBN (α-phenyl-tert-butyl nitrone) decrease NF-κB (13) in a mouse endotoxemia model [50]. There is also evidence that OKN-007 effectively traps free radicals (14) in vitro [44]. Consequently, based on the possible mechanisms-of-action and our data reported in this study, OKN-007 is an effective agent that can inhibit tumor angiogenesis (15). The schematic is a modification of combined schemes obtained from Oxidative Medicine and Cellular Longevity, Article ID 374963, Zhou Y et al. (2013) [Copyright (2013) with permission from Hindawi Publishing Corporation] [58], and from Nature Medicine, 11 (9): 925-7, Strieter RM. (2005) [Copyright (2005) with permission from Nature Publishing Group] [57].
Conclusion
This is the first attempt at detecting in vivo levels of VEGFR-2 in a mouse GL261 glioma model and assessing the anti-angiogenic capability of an anticancer nitrone. Our study confirmed that in vivo VEGFR-2 levels can be monitored and can be used to assess the efficacy of an anti-angiogenic therapy.
This method can potentially be applied towards other types of cancers for the in vivo assessment of VEGFR-2 levels, and assess various anti-angiogenic agents. The results indicate that OKN-007 treatment substantially decreased VEGFR-2 levels in a GL261 glioma model, and can be considered as an anti-angiogenic therapy in human gliomas.
Acknowledgements
We gratefully acknowledge the Peggy and Charles Stephenson Cancer Center at the University of Oklahoma, Oklahoma City, OK, for use of their Histology and Immunohistochemistry Core for cryosectioning, and funding by an Institutional Development Award (IDeA) from the National Institute of General Medical Sciences of the National Institutes of Health under grant number P20 GM103639 (R.A.T.). This work was also supported by the Oklahoma Medical Research Foundation (R.A.T.).
Disclosure of conflict of interest
None.
Abbreviations
- BSA
bovine serum albumin
- DTPA
diethylene triamine penta acetic acid
- FOV
field of view
- GBM
glioblastoma
- Gd
gadolinium
- HIF-1α
hypoxia-inducible factor-1α
- IkB
inhibitor of kB
- mMRI
molecular magnetic resonance imaging
- MSME
Multiple-slice multiple echo imaging
- NF-κB
nuclear factor of kappa light polypeptide gene enhancer in B-cells
- PBN
α-phenyl-tert-butyl nitrone
- OCT
optimal cutting temperature
- OKN-007
(2, 4-disulfophenyl-PBN; or disodium 4-[(tert-butyl-imino) methyl] benzene-1,3-disulfonate N-oxide or disufenton; also previously known as NXY-059)
- RARE
rapid acquisition with refocused echoes
- ROI
region of interest
- RONS
reactive oxygen and nitrogen species
- Sap
saponin
- TE
echo time
- TEC
tumor endothelial cells
- TR
relaxation time
- UT
untreated
- VEGF
vascular endothelial growth factor
- VEGFR
vascular endothelial growth factor receptor
References
- 1.Hanahan D, Weinberg RA. Hallmarks of cancer: the next generation. Cell. 2011;144:646–74. doi: 10.1016/j.cell.2011.02.013. [DOI] [PubMed] [Google Scholar]
- 2.Bergers G, Benjamin LE. Tumorigenesis and the angiogenic switch. Nat Rev Cancer. 2003;3:401–10. doi: 10.1038/nrc1093. [DOI] [PubMed] [Google Scholar]
- 3.Folkman J. Angiogenesis in cancer, vascular, rheumatoid and other disease. Nat Med. 1995;1:27–31. doi: 10.1038/nm0195-27. [DOI] [PubMed] [Google Scholar]
- 4.Gasparini G, Longo R, Toi M, Ferrara N. Angiogenic inhibitors: a new therapeutic strategy in oncology. Nat Clin Pract Oncol. 2005;2:562–77. doi: 10.1038/ncponc0342. [DOI] [PubMed] [Google Scholar]
- 5.Hoeben A, Landuyt B, Highley MS, Wildiers H, Van Oosterom AT, De Bruijn EA. Vascular endothelial growth factor and angiogenesis. Pharmacol Rev. 2004;56:549–80. doi: 10.1124/pr.56.4.3. [DOI] [PubMed] [Google Scholar]
- 6.Plate KH, Breier G, Weich HA, Risau W. Vascular endothelial growth factor is a potential tumour angiogenesis factor in human gliomas in vivo. Nature. 1992;359:845–8. doi: 10.1038/359845a0. [DOI] [PubMed] [Google Scholar]
- 7.Price SJ, Gillard JH. Imaging biomarkers of brain tumour margin and tumour invasion. Br J Radiol. 2011;84 Spec No 2:S159–67. doi: 10.1259/bjr/26838774. [DOI] [PMC free article] [PubMed] [Google Scholar]
- 8.Gagner JP, Law M, Fischer I, Newcomb EW, Zagzag D. Angiogenesis in gliomas: imaging and experimental therapeutics. Brain Pathol. 2005;15:342–363. doi: 10.1111/j.1750-3639.2005.tb00119.x. [DOI] [PMC free article] [PubMed] [Google Scholar]
- 9.CBTRUS Statistical Report: Primary Brain and Central Nervous System Tumors Diagnosed in the United States in 2004-2008. Central Brain Tumor Registry of the United States (CBTRUS) 2012
- 10.Behin A, Hoang-Xuan K, Carpentier AF, Delattre JY. Primary brain tumours in adults. Lancet. 2003;361:323–331. doi: 10.1016/S0140-6736(03)12328-8. [DOI] [PubMed] [Google Scholar]
- 11.Johnson DR, Ma DJ, Buckner JC, Hammack JE. Conditional probability of long-term survival in glioblastoma. Cancer. 2012;118:5608–13. doi: 10.1002/cncr.27590. [DOI] [PubMed] [Google Scholar]
- 12.Jain RK, di Tomaso E, Duda DG, Loeffler JS, Sorensen AG, Batchelor TT. Angiogenesis in brain tumours. Nat Rev Neurosci. 2007;8:610–622. doi: 10.1038/nrn2175. [DOI] [PubMed] [Google Scholar]
- 13.Samoto K, Ikezaki K, Ono M, Shono T, Kohno K, Kuwano M, Fukui M. Expression of vascular endothelial growth factor and its possible relation with neovascularization in human brain tumors. Cancer Res. 1995;55:1189–93. [PubMed] [Google Scholar]
- 14.Cai W, Chen X. Multimodality molecular imaging of tumor angiogenesis. J Nucl Med. 2008;49(Suppl 2):113S–128S. doi: 10.2967/jnumed.107.045922. [DOI] [PubMed] [Google Scholar]
- 15.Cai W, Chen X. Multimodality imaging of vascular endothelial growth factor and vascular endothelial growth factor receptor expression. Front Biosci. 2007;12:4267–4279. doi: 10.2741/2386. [DOI] [PubMed] [Google Scholar]
- 16.Cea V, Sala C, Verpelli C. Antiangiogenic therapy for glioma. J Signal Transduct. 2012;2012:483040. doi: 10.1155/2012/483040. [DOI] [PMC free article] [PubMed] [Google Scholar]
- 17.He T, Doblas S, Saunders D, Casteel R, Lerner M, Ritchey JW, Snider T, Floyd RA, Towner RA. Effects of PBN and OKN007 in rodent glioma models assessed by 1H MR spectroscopy. Free Radic Biol Med. 2011;51:490–502. doi: 10.1016/j.freeradbiomed.2011.04.037. [DOI] [PubMed] [Google Scholar]
- 18.Towner RA, Gillespie DL, Schwager A, Saunders DG, Smith N, Njoku CE, Krysiak RS 3rd, Larabee C, Iqbal H, Floyd RA, Bourne DW, Abdullah O, Hsu EW, Jensen RL. Regression of glioma tumor growth in F98 and U87 rat glioma models by the Nitrone OKN-007. Neuro Oncol. 2013;15:330–40. doi: 10.1093/neuonc/nos337. [DOI] [PMC free article] [PubMed] [Google Scholar]
- 19.Garteiser P, Doblas S, Watanabe Y, Saunders D, Hoyle J, Lerner M, He T, Floyd RA, Towner RA. Multiparametric assessment of the anti-glioma properties of OKN007 by magnetic resonance imaging. J Magn Reson Imaging. 2010;31:796–806. doi: 10.1002/jmri.22106. [DOI] [PubMed] [Google Scholar]
- 20.Floyd RA, Kopke RD, Choi CH, Foster SB, Doblas S, Towner RA. Nitrones as therapeutics. Free Radic Biol Med. 2008;45:1361–74. doi: 10.1016/j.freeradbiomed.2008.08.017. [DOI] [PMC free article] [PubMed] [Google Scholar]
- 21.Floyd RA, Chandru HK, He T, Towner R. Anticancer activity of nitrones and observations on mechanism of action. Anticancer Agents Med Chem. 2011;11:373–379. doi: 10.2174/187152011795677517. [DOI] [PMC free article] [PubMed] [Google Scholar]
- 22.He T, Smith N, Saunders D, Pittman BP, Lerner M, Lightfoot S, Silasi-Mansat R, Lupu F, Towner RA. Molecular MRI differentiation of VEGF receptor-2 levels in C6 and RG2 glioma models. Am J Nucl Med Mol Imaging. 2013;3:300–11. [PMC free article] [PubMed] [Google Scholar]
- 23.Towner RA, Smith N, Asano Y, He T, Doblas S, Saunders D, Silasi-Mansat R, Lupu F, Seeney CE. Molecular magnetic resonance imaging approaches used to aid in the understanding of angiogenesis in vivo: implications for tissue engineering. Tissue Eng Part A. 2010;16:357–64. doi: 10.1089/ten.tea.2009.0233. [DOI] [PMC free article] [PubMed] [Google Scholar]
- 24.Dafni H, Landsman L, Schechter B, Kohen F, Neeman M. MRI and fluorescence microscopy of the acute vascular response to VEGF165: vasodilation, hyper-permeability and lymphatic uptake, followed by rapid inactivation of the growth factor. NMR Biomed. 2002;15:120–31. doi: 10.1002/nbm.724. [DOI] [PubMed] [Google Scholar]
- 25.Hermanson GT. Bioconjugate Techniques. San Diego: Academic; 1996. [Google Scholar]
- 26.Chen F, Zhang Y, Cai W. Molecular MRI of VEGFR-2 reveals intra-tumor and inter-tumor heterogeneity. Am J Nucl Med Mol Imaging. 2013;3:312–6. [PMC free article] [PubMed] [Google Scholar]
- 27.He T, Smith N, Saunders D, Doblas S, Watanabe Y, Hoyle J, Silasi-Mansat R, Lupu F, Lerner M, Brackett DJ, Towner RA. Molecular MRI assessment of vascular endothelial growth factor receptor-2 in rat C6 gliomas. J Cell Mol Med. 2011;15:837–49. doi: 10.1111/j.1582-4934.2010.01091.x. [DOI] [PMC free article] [PubMed] [Google Scholar]
- 28.Pasula S, Cai X, Dong Y, Messa M, McManus J, Chang B, Liu X, Zhu H, Mansat RS, Yoon SJ, Hahn S, Keeling J, Saunders D, Ko G, Knight J, Newton G, Luscinskas F, Sun X, Towner R, Lupu F, Xia L, Cremona O, De Camilli P, Min W, Chen H. Endothelial epsin deficiency decreases tumor growth by enhancing VEGF signaling. J Clin Invest. 2012;122:4424–38. doi: 10.1172/JCI64537. [DOI] [PMC free article] [PubMed] [Google Scholar]
- 29.Haacke EM. Magnetic Resonance Imaging: Physical Principles and Sequence Design. New York, NY: Wiley-Liss; 1999. [Google Scholar]
- 30.Lupu C, Westmuckett AD, Peer G, Ivanciu L, Zhu H, Taylor FB Jr, Lupu F. Tissue factor-dependent coagulation is preferentially upregulated within arterial branching areas in a baboon model of Escherichia coli sepsis. Am J Pathol. 2005;167:1161–1172. doi: 10.1016/S0002-9440(10)61204-7. [DOI] [PMC free article] [PubMed] [Google Scholar]
- 31.Bello L, Giussani C, Carrabba G, Pluderi M, Costa F, Bikfalvi A. Angiogenesis and invasion in gliomas. Cancer Treat Res. 2004;117:263–84. doi: 10.1007/978-1-4419-8871-3_16. [DOI] [PubMed] [Google Scholar]
- 32.Wong ML, Prawira A, Kaye AH, Hovens CM. Tumour angiogenesis: its mechanism and therapeutic implications inmalignant gliomas. J Clin Neurosci. 2009;16:1119–30. doi: 10.1016/j.jocn.2009.02.009. [DOI] [PubMed] [Google Scholar]
- 33.Jensen RL. Hypoxia in the tumorigenesis of gliomas and as a potential target for therapeutic measures. Neurosurg Focus. 2006;20:E24. doi: 10.3171/foc.2006.20.4.16. [DOI] [PubMed] [Google Scholar]
- 34.Zetter BR. Angiogenesis and tumor metastasis. Annu Rev Med. 1998;49:407–424. doi: 10.1146/annurev.med.49.1.407. [DOI] [PubMed] [Google Scholar]
- 35.Bulnes S, Bengoetxea H, Ortuzar N, Argandoña EG, Garcia-Blanco A, Rico-Barrio I, Lafuente JV. Angiogenic signalling pathways altered in gliomas: selection mechanisms for more aggressive neoplastic subpopulations with invasive phenotype. J Signal Transduct. 2012;2012:597915. doi: 10.1155/2012/597915. [DOI] [PMC free article] [PubMed] [Google Scholar]
- 36.Jain RK, di Tomaso E, Duda DG, Loeffler JS, Sorensen AG, Batchelor TT. Angiogenesis in brain tumours. Nat Rev Neurosci. 2007;8:610–22. doi: 10.1038/nrn2175. [DOI] [PubMed] [Google Scholar]
- 37.Plate KH, Breier G, Weich HA, Mennel HD, Risau W. Vascular endothelial growth factor and glioma angiogenesis: coordinate induction of VEGF receptors, distribution of VEGF protein and possible in vivo regulatorymechanisms. Int J Cancer. 1994;59:520–9. doi: 10.1002/ijc.2910590415. [DOI] [PubMed] [Google Scholar]
- 38.Prabhu SS, Broaddus WC, Oveissi C, Berr SS, Gillies GT. Determination of intracranial tumor volumes in a rodent brain using magnetic resonance imaging, Evans blue and histology: a comparative study. IEEE Trans Biomed Eng. 2000;47:259–265. doi: 10.1109/10.821776. [DOI] [PubMed] [Google Scholar]
- 39.Miller RA, Harper JM, Dysko RC, Durkee SJ, Austad SN. Longer life spans and delayed maturation in wild-derived mice. Exp Biol Med (Maywood) 2002;227:500–8. doi: 10.1177/153537020222700715. [DOI] [PubMed] [Google Scholar]
- 40.Serres S, O’Brien ER, Sibson NR. Imaging angiogenesis, inflammation, and metastasis in the tumor microenvironment with magnetic resonance imaging. Adv Exp Med Biol. 2014;772:263–83. doi: 10.1007/978-1-4614-5915-6_12. [DOI] [PubMed] [Google Scholar]
- 41.Iagaru A, Gambhir SS. Imaging tumor angiogenesis: the road to clinical utility. AJR Am J Roentgenol. 2013;201:W183–91. doi: 10.2214/AJR.12.8568. [DOI] [PubMed] [Google Scholar]
- 42.Liu Y, Yang Y, Zhang C. A concise review of magnetic resonance molecular imaging of tumor angiogenesis by targeting integrin αvβ3 with magnetic probes. Int J Nanomedicine. 2013;8:1083–93. doi: 10.2147/IJN.S39880. [DOI] [PMC free article] [PubMed] [Google Scholar]
- 43.Kim B, Yang J, Hwang M, Choi J, Kim HO, Jang E, Lee JH, Ryu SH, Suh JS, Huh YM, Haam S. Aptamer-modified magnetic nanoprobe for molecular MR imaging of VEGFR2 on angiogenic vasculature. Nanoscale Res Lett. 2013;8:399. doi: 10.1186/1556-276X-8-399. [DOI] [PMC free article] [PubMed] [Google Scholar]
- 44.De León-Rodriguez LM, Lubag A, Udugamasooriya DG, Proneth B, Brekken RA, Sun X, Kodadek T, Dean Sherry A. MRI detection of VEGFR2 in vivo using a low molecular weight peptoid-(Gd)8-dendron for targeting. J Am Chem Soc. 2010;132:12829–31. doi: 10.1021/ja105563a. [DOI] [PMC free article] [PubMed] [Google Scholar]
- 45.Troprès I, Pannetier N, Grand S, Lemasson B, Moisan A, Péoch’h M, Rémy C, Barbier EL. Imaging the microvessel caliber and density: principles and applications of microvascular MRI. Magn Reson Med. 2014 doi: 10.1002/mrm.25396. [Epub ahead of print] [DOI] [PubMed] [Google Scholar]
- 46.Bohndiek SE, Kettunen MI, Hu DE, Brindle KM. Hyperpolarized (13)C spectroscopy detects early changes in tumor vasculature and metabolism after VEGF neutralization. Cancer Res. 2012;72:854–64. doi: 10.1158/0008-5472.CAN-11-2795. [DOI] [PMC free article] [PubMed] [Google Scholar]
- 47.Zempleni J. Uptake, localization, and noncarboxylase roles of biotin. Annu Rev Nutr. 2005;25:175–96. doi: 10.1146/annurev.nutr.25.121304.131724. [DOI] [PubMed] [Google Scholar]
- 48.Hiriyanna KT, Varkey J, Beer M, Benbow RM. Electron microscopic visualization of sites of nascent DNA synthesis by streptavidin-gold binding to biotinylated nucleotides incorporated in vivo. J Cell Biol. 1988;107:33–44. doi: 10.1083/jcb.107.1.33. [DOI] [PMC free article] [PubMed] [Google Scholar]
- 49.Nikiel B, Chekan M, Jarzab M, Lange D. Endogenous avidin biotin activity (EABA) in thyroid pathology: immunohistochemical study. Thyroid Res. 2009;2:5. doi: 10.1186/1756-6614-2-5. [DOI] [PMC free article] [PubMed] [Google Scholar]
- 50.Pogrebniak HW, Merino MJ, Hahn SM, Mitchell JB, Pass HI. Spin trap salvage from endotoxemia: The role of cytokine down-regulation. Surgery. 1992;112:130–139. [PubMed] [Google Scholar]
- 51.Williams HE, Claybourn M, Green AR. Investigating the free radical trapping ability of NXY-059, S-PBN and PBN. Free Radic Res. 2007;41:1047–52. doi: 10.1080/10715760701557161. [DOI] [PubMed] [Google Scholar]
- 52.Yoshino Y, Aoyagi M, Tamaki M, Duan L, Morimoto T, Ohno K. Activation of p38 MAPK and/or JNK contributes to increased levels of VEGF secretion in human malignant glioma cells. Int J Oncol. 2006;29:981–7. [PubMed] [Google Scholar]
- 53.Ushio-Fukai M, Tang Y, Fukai T, Dikalov SI, Ma Y, Fujimoto M, Quinn MT, Pagano PJ, Johnson C, Alexander RW. Novel role of gp91(phox)-containing NAD(P)H oxidase in vascular endothelial growth factor-induced signaling and angiogenesis. Circ Res. 2002;91:1160–7. doi: 10.1161/01.res.0000046227.65158.f8. [DOI] [PubMed] [Google Scholar]
- 54.Wang Y, Zang QS, Liu Z, Wu Q, Maass D, Dulan G, Shaul PW, Melito L, Frantz DE, Kilgore JA, Williams NS, Terada LS, Nwariaku FE. Regulation of VEGF-induced endothelial cell migration by mitochondrial reactive oxygen species. Am J Physiol Cell Physiol. 2011;301:C695–704. doi: 10.1152/ajpcell.00322.2010. [DOI] [PMC free article] [PubMed] [Google Scholar]
- 55.Arbiser JL, Petros J, Klafter R, Govindajaran B, McLaughlin ER, Brown LF, Cohen C, Moses M, Kilroy S, Arnold RS, Lambeth JD. Reactive oxygen generated by Nox1 triggers the angiogenic switch. Proc Natl Acad Sci U S A. 2002;99:715–20. doi: 10.1073/pnas.022630199. [DOI] [PMC free article] [PubMed] [Google Scholar]
- 56.Xia C, Meng Q, Liu LZ, Rojanasakul Y, Wang XR, Jiang BH. Reactive oxygen species regulate angiogenesis and tumor growththrough vascular endothelial growth factor. Cancer Res. 2007;67:10823–30. doi: 10.1158/0008-5472.CAN-07-0783. [DOI] [PubMed] [Google Scholar]
- 57.Strieter RM. Masters of angiogenesis. Nat Med. 2005;11:925–7. doi: 10.1038/nm0905-925. [DOI] [PubMed] [Google Scholar]
- 58.Zhou Y, Yan H, Guo M, Zhu J, Xiao Q, Zhang L. Reactive oxygen species in vascular formation and development. Oxid Med Cell Longev. 2013;2013:374963. doi: 10.1155/2013/374963. [DOI] [PMC free article] [PubMed] [Google Scholar]