Abstract
Surgery is the most effective method to cure patients with solid tumors. New techniques in near-infrared (NIR) cancer imaging are being used to identify surgical margins and residual tumor cells in the wound. Our goal was to determine the optimal time and dose for imaging solid tumors using Indocyanine Green. Syngeneic murine flank tumor models were used to test NIR imaging of ICG at various doses ranging from 0 to 10 mg/kg. Imaging was performed immediately after injection and up to 72 hours later. Biodistribution in the blood and murine organs were quantified by spectroscopy and fluorescence microscopy. Based on these results, a six patient dose titration study was performed. In murine flank tumors, the tumor-to-background ratio (TBR) for ICG at doses less than 5 mg/kg were less than 2 fold at all time points, and the surgeons could not subjectively identify tissue contrast. However, for doses ranging from 5 mg/kg to 10 mg/kg, the TBR ranged from 2.1 to 8.0. The tumor signal was best appreciated at 24 hours and the background was least pronounced after 24 hours. Biodistribution studies in the blood and murine organs revealed excretion through the biliary tree and gastrointestinal tract, with minimal blood fluorescence at the higher doses. A follow up pilot study confirmed that these findings were applicable to lung cancer patients, and tumor was clearly delineated from surrounding normal tissue by NIR imaging. For non-hepatic solid tumors, we found ICG was optimal when dosed at 5 mg/kg and 24 hours before surgery.
Keywords: Cancer, imaging, fluorescence, ICG, surgery, indocyanine
Introduction
Cancer is a leading cause of mortality worldwide, accounting for approximately 8 million deaths each year [1]. More than 50% of cancer patients undergo surgery each year to remove their cancer, because it is the most effective approach to managing solid tumors [2]. In fact, mechanically removing a tumor by surgery can improve the cure rate by 4- to 11-fold for most solid tumors. However, surgeons have many intraoperative challenges such as identifying small lesions, locating metastases and confirming the removal of the tumor in its entirety [3-7].
Our group and others have proposed that near-infrared (NIR) imaging during cancer surgery could improve identification of cancer cells [8-10]. This approach would allow surgeons to locate microscopic lesions and examine surgical margins for small pockets of tumor cells. NIR imaging uses a fluorescent contrast agent (700-900 nm) and an imaging device to visually enhance abnormal tissues. NIR imaging does not use ionizing radiation, can penetrate beyond the organ surface, and provides real time information in the operating room.
Currently, only one NIR contrast dye, indocyanine green (ICG) is FDA approved for clinical use in the United States. ICG is a small organic dye that can easily penetrate tissues and cells and has an adverse reaction rate of < 0.1%. In the last couple years, several studies have shown ICG can locate metastatic tumors in the liver [11-15]. Since ICG is processed by the excretory pathways of the biliary system, ICG can provide superior contrast of intrahepatic nodules during surgery [16]. Our group and others have been exploring ICG for clinical applications to identify other solid tumors such as lung and breast cancers during surgery [17,18]. Unlike hepatic tumors, ICG is speculated to accumulate in these solid tumors by the enhanced permeability and retention (EPR) effect. The optimal pharmacokinetics of ICG for imaging non-liver tumors has not been established.
The EPR effect, first described in 1986 by Matsumura and Maeda, is a property by which small molecules such as ICG are injected systemically and passively accumulate in tumors due to the presence of defective endothelial cells and wide fenestrations (600 to 800 nm) in nascent blood vessels [19]. Once in the tumor microenvironment, these particles are retained due to global properties such as molecular size, shape, charge and polarity, rather than tumor-specific targeting mechanisms such as ligand-receptor interactions [20].
The goal of our study was to identify the optimal time and dose to inject ICG for intraoperative imaging of solid non-hepatic tumors that accumulate ICG by the EPR mechanism. First, we studied several murine models including lung cancer, esophageal carcinoma and mesothelioma. Using multiple timing and dosing experiments, we selected the optimal pharmacokinetics to administer ICG. Then, we translated our work into 6 human patients. In conclusion, we discovered that ICG provided superior contrast of thoracic tumors when given at 5 mg/kg at 24 hours prior to surgery.
Materials and methods
Reagents
Pharmaceutical grade indocyanine green (ICG) was purchased from Akorn Inc. (IC-GREEN, NDC 17478-701-02). Animals were dosed with 0.71, 2, 5, 7.5, and 10 mg/kg of ICG via intravenous injection at timepoints of: pre-injection, and 1 min, 3 min, 15 min, 1 hr, 6 hr, 12 hr, 24 hr, 36 hr, 48 hr, and 72 hr before imaging as previously described [21].
Cell lines
The metastatic non-small cell lung cancer (NSCLC) cell line, murine Lewis lung carcinoma (LLC), was obtained from American Type Culture Collection. AE17 is an asbestos-derived murine mesothelioma cell line (kindly provided by Steven Albelda, University of Pennsylvania). The murine esophageal carcinoma cell line, AKR, was derived from mouse esophageal squamous epithelia with cyclin D1 over-expression via Epstein-Barr virus ED-L2 promoter in p53-deficient genetic backgrounds. AKR and LLC cell lines were cultured and maintained in high-glucose DMEM (Dulbecco’s Modified Eagle’s Medium, Mediatech, Washington DC) supplemented with 10% fetal bovine serum (FBS; Georgia Biotechnology, Atlanta, GA), 1% penicillin/streptomycin, and 1% glutamine. The AE17 cell line was cultured in RPMI (RPMI 1640 Medium, Mediatech, Washington DC), 10% FBS, 1% penicillin/streptomycin, and 1% glutamine. Cell lines were regularly tested and maintained negative for Mycoplasma spp.
Animal flank tumor models
Female C57BL/6 mice were purchased from Charles River Laboratories and Jackson Laboratories. All mice were maintained in pathogen-free conditions and used for experiments at ages 6 week or older. The Animal Care and Use Committees of the Children’s Hospital of Philadelphia, The Wistar Institute, and the University of Pennsylvania approved all protocols in compliance with the Guide for the Care and Use of Laboratory Animals. Tumor cells were grown to 70% confluency and then harvested and re-suspended in PBS. Mice were injected subcutaneously on the flank with 1 × 10⁶ tumor cells (syngeneic mice). Tumor cells for subcutaneous injections were suspended in 100 uL PBS. Flank tumors were imaged when they reached approximately 250 mm3. The mice were anesthetized with intramuscular ketamine (80 mg/kg) and xylazine (10 mg/kg) and shaved prior to imaging.
NIR imaging
Our intraoperative system was composed of a light source (excitation 740 nm) and two charge-coupled device (CCD) cameras (BioVision, Inc., PA) that were fixed above the operating room table by a mobile gantry (BioMediCon Inc., NJ). Specific filters split the emitted light from the tissue to a brightfield and a near-infrared camera as previously described [22]. The cameras were aligned so an overlay of the two images allowed for precise localization of the fluorescent probes within the tissue. The imaging equipment was mounted inside a 16’ × 7’ × 24’ stainless steel case that was stationed above the operating room table. The system was controlled by Metamorph® (Molecular Devices LLC, CA) software that was customized in our laboratory.
Spectroscopy
The hand-held near infrared spectroscopy system has been previously described in detail [23]. In brief, a Raman Probe detector was incorporated into a cylindrical stainless steel sampling head integrated with a 5 m, two-fiber cable; one for laser excitation and the other for light collection. The sampling head and fiber cable were coupled via an FC connector to a spectrometer. The combined sampling head and spectrometer system has a wavelength range of 800-930 nm with 0.6 nm spectral resolution for near-infrared (NIR) fluorescence measurement. The excitation light was provided by a 785 nm, 100 mW continuous-wave diode laser. All readings were taken with a 0.1 second integration time and complied on a computer using proprietary software.
Tumor-to-blood comparison
Ten C57BL/6 mice bearing LLC flank tumors were injected with ICG (5 mg/kg) via tail vein at 10 sequential time intervals over a period of 5 days. Mice were anesthetized with intramuscular ketamine (80 mg/kg) and xylazine (10 mg/kg), and 10 uL of blood was drawn from the opposite tail vein using a 1 mL syringe and 28 1/2 gauge needle. Tumors were shaved and NIR fluorescence was measured from both the tumor and blood sample using a spectrometer. Two additional tumor-bearing mice without ICG injection were used for negative controls.
ICG biodistribution
5 mice with flank tumors (LLC, TC1, KB and AE17) (total N = 20) were given 5 mg/kg of ICG via tail vein injection. Twenty-four hours later, mice were euthanized by inhalation of CO2 followed by cervical dislocation. In order to assess the distribution of ICG, the tumor, heart, lung, stomach, liver, spleen, pancreas, small bowel, large bowel, kidneys, bone, fat and muscle were harvested and then imaged in NIR.
Human study design
Six human patients were enrolled in a pilot trial. All patients gave informed consent approved by the University of Pennsylvania Institutional Review Board (IRB). Any patient with a solitary lung nodule was eligible for this study. All patients underwent computed tomography (CT) scanning with at least 0.1 cm slice thickness to confirm the presence of a pulmonary solid tumor. None of these patients received chemotherapy or radiation prior to operation.
Twenty-four hours prior to surgery, patients were injected intravenously with 2 mg, 2 mg/kg or 5 mg/kg indocyanine green (ICG) (Akorn Pharmaceuticals, IL). Following thoracotomy, once the tumor was localized, the operating room lights were switched off, and the fluorescent imaging system was sterily draped and positioned above the chest using a custom designed gantry device (BioMediCon, Moorestown, NJ). The primary nodule was imaged and photo-documented by white light and fluorescence. Once removed, all specimens were re-imaged ex vivo on a back table in the operating room before submitting to pathology. Frozen section biopsies were performed when indicated. All specimens were sent for permanent histopathology. All nodules were reviewed by a specialized lung pathologist.
Immunohistochemistry and fluorescence microscopy
Tissues were harvested and bisected with one-half either placed in Tissue-Tek OCT and stored at -80°C or in formalin for paraffin sectioning. 5 µm thick sections were mounted with a gylcerine-based mounting media. Frozen tumor sections were prepared as previously described [24]. The samples were examined using an Olympus® IX51 fluorescent microscope equipped with an indocyanine green specific filter set (Chroma® 49030). Image capture was achieved using a PixeLink® NIR CCD camera (PL-B741EU). Each sample was then subsequently stained with hematoxylin and eosin and re-imaged using white light. Fluorescent images were further processed using ImageJ® (http://rsb.info.nih.gov/ij/; public domain software developed by National Institutes of Health) to give green pseudo-color to fluorescent signal, and then these images were subsequently overlaid to create color-NIR images. Of note, the ICG fluorescence was lost after formalin fixation despite all procedures being performed in the dark, thus all analyses were conducted on fresh tissues.
Data analysis
In order to quantitate the amount of fluorescence from the tissue, we used region of interest (ROI) software within ImageJ®. A background reading was taken from adjacent normal lung tissue in order to generate a tumor-to-background ratio (TBR). We assessed the significance of differences in median values (size, TBR, depth and SUV) of non-fluorescing vs. fluorescing tumors by the Mann-Whitney test. We assessed correlation of continuous outcomes by the Pearson correlation coefficient. We conducted all analyses in SAS Version 9.3 (SAS Institute, Inc.; Cary, NC).
Results
Dose and time kinetics of indocyanine green
In order to determine the optimal time and dose for ICG for tumor imaging in non-hepatic solid tumors, we performed a dose and time kinetics study on several murine flank models. In multiple experiments, six-week-old immune-intact syngeneic C57BL/6 (n = 25) were injected subcutaneously with various tumor cells on the right flank. Within 2 to 3 weeks the animals developed subcutaneous flank tumors that could be visualized. When the tumors reached approximately 250 mm3, 5 mice each were injected with ICG via tail vein with 5 different doses of ICG (0.71, 2, 5, 7.5, and 10 mg/kg). There were no obvious toxicities even at the highest doses. Mice were subsequently imaged at ten different time intervals ranging from 1 minute to 72 hours post-injection (Figure 1A). First, in order to mimic surgeon identification of tumor in the operating room, two independent investigators subjectively rated the degree of fluorescence from 0 (no fluorescence) to 5 (most fluorescent). Next, the tumors were imaged using our NIR imaging system and the degree of fluorescence was quantified. The images were then processed using ROI software, and a tumor-to-background ratio (TBR) was calculated. All the mice survived the study, and they were ultimately euthanized due to tumor burden.
Figure 1.
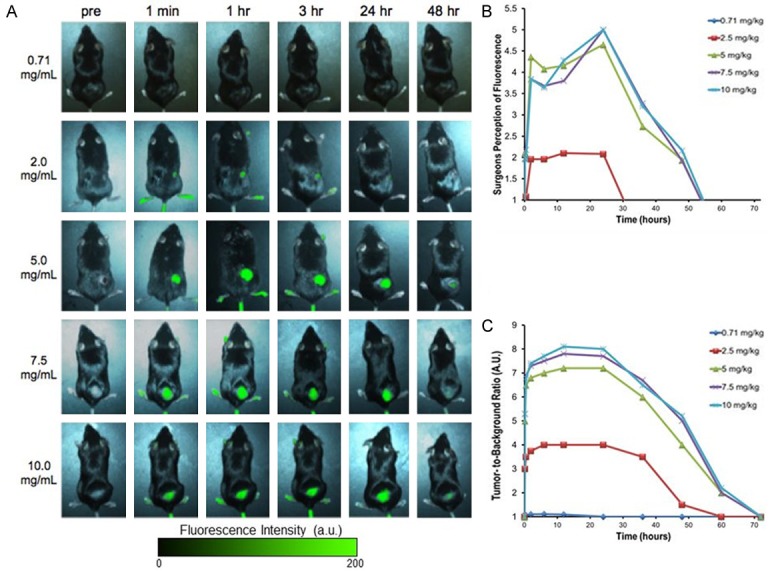
A. Subcutaneous tumors are imaged in vivo through the skin on the flank of mice. Tumor fluorescence with variation to ICG dosage and time dictate how it is optimally viewed. Increasing dosage leads to brighter fluorescence. With respect to time, the optimal fluorescence increased and peaked at 24 hours post injection, then steadily declined over the course of the next two days. B. Surgeons could not visualize the fluorescence from lower doses. At 5 mg/kg to 10 mg/kg, the surgeons did not subjectively perceive any difference in fluorescence. C. Tumor fluorescence was measured by region-of-interest software.
Both investigators did not visualize any fluorescence from the tumors at 0.71 mg/kg (mean subjective measurement 0) at any time interval. At 60 minutes after injection and dose 2 mg/kg, the investigators subjectively felt the tumors were mild to moderately fluorescent (mean 1.5). At 5 mg/kg, 7.5 mg/kg, and 10 mg/kg all animals exhibited a similar level of high fluorescence (mean 4.6, 4.7 and 4.9, respectively) at 60 minutes after injection. Although the investigators noted fluorescence of the tumor within only a few minutes, there was significant background noise from the surrounding tissues. Strong tumor fluorescence remained for 24 hours and had dissipated by 48 hours (mean 1). By 72 hours, there was no evidence of fluorescence in any of the tissues (mean 0). Hence, the investigators felt the optimal fluorescence occurred at 24 hours as the tumor was maximally fluorescent and background fluorescence was minimal (Figure 1B).
Next, we quantitated the degree of fluorescence using our imaging system for each time and dose point (Figure 1C). In previous studies, the TBR more than 2.5 is considered as substantial contrast between the tumor and surrounding background tissues [25]. The TBR at the predetermined time intervals for 0.71, 2, 5, 7.5, and 10 mg/kg ranged from 1.0-1.11, 1.0-4.0, 1.0-7.2, 1.0-7.8, and 1.0-8.1, respectively. The TBR at various doses for 1 min, 2 hours, 6 hours, 12 hours, 24 hours, 48 hours and 72 hours ranged from 1.0-1.0, 1.1-5.3, 1.11-7.7, 1.09-8.1, and 1.0-8.0, 1.0-5.2, 1.0-1.0, respectively. Thus, the most superior TBR was at 10 mg/kg at 24 hours, however, this was not substantially different than 5 mg/kg and 7.5 mg/kg at 24 hours.
Based on the subjective impression from the investigators as well as the imaging data, we concluded that the optimal time for intraoperative imaging occurred at 24 hours. At this time interval, the mean TBR was 5.6 ± 0.3 (range 1.0-8.0). The entire experiment was repeated with AE17, LLC and AKR cell lines in C57bl/6 mice and 4T1 in Balb/c mice with similar findings. Together, these data suggest the optimal time for optimizing the TBR of tumor to normal tissue in immunocompetent mice for ICG is imaging at 24 hours, irrespective of the cell type of origin. Since 5 mg/kg, 7.5 mg/kg and 10 mg/kg were almost equally fluorescent in each study, but 5 mg/kg was the lowest dose and therefore least likely to cause any systemic toxicity, we chose to proceed with 5 mg/kg as the optimal dose for our future studies.
ICG tumor-to-blood clearance
To further examine the optimal time for ICG administration for tumor imaging, we administered ICG at 5 mg/kg via tail vein injection to an additional 10 C57BL/6 mice bearing similar LLC flank tumors. We then measured fluorescence using spectroscopy from the tumor and blood at each of 10 sequential time intervals over 5 days. Mice with flank tumors without ICG injection were used as negative controls.
Following ICG injection (0 to 3 minutes), the blood sample saturated our spectrometer with NIR signal from ICG. For 12 minutes, the signal remained higher in the blood than in the tumor (Figure 2). In subsequent time points, the blood ICG signal continued to sharply decline over the next 24 hours. Following 24 hours, it remained steady for the remainder of this time experiment. In the tumor, the fluorescence peaked within the first 10 minutes, remained similar for the first 24 hours, and then decreased over the next 24-48 hours.
Figure 2.
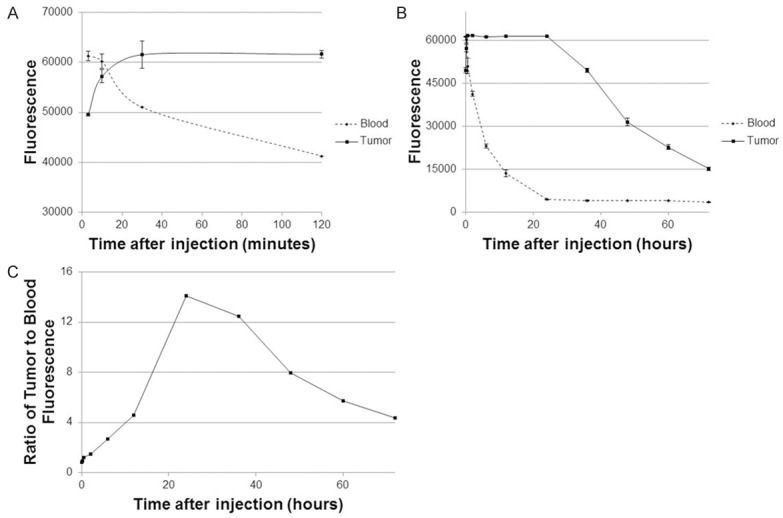
ICG signal in blood circulation versus tumor over time.
Based on these data, we found the tumor-to-blood ratio < 1 for 12 minutes as the tumor signal was significantly less than the blood. By 20 minutes, the tumor had retained ICG and the circulating blood had decreased NIR signal, at this point the tumor-to-blood ratio increased to > 1. It was noted that the tumor-to-blood ratio was 14.1 at 24 hours which was noted to be the peak ratio.
Biodistribution of ICG for tumor imaging
In order to examine the biodistribution of ICG, 5 mice with LLC, TC1, KB and AE17 flank tumors (total N = 20) were injected with the 5 mg/kg of ICG and sacrificed 24 hours following injection. Of the harvested organs, the liver, stomach, small intestine, and large intestine showed subjective fluorescence at 24 hours and were found to have TBR > 2.5. The heart, lung, spleen, pancreas, kidney, muscle, bone and fat were not fluorescent (TBR < 2.5) (Figure 3). This data is consistent with the known hepatic metabolization and biliary excretion of ICG. Some of the vital organs were preserved in formalin and sectioned in paraffin blocks. Slides were stained with Hemotoxylin and Eosin (H&E), and were subsequently read by a pathologist (Figure 4). The H&E stains of the vital organs were deemed anatomically free of disease. Next, the accumulation of ICG in tumors was confirmed by NIR fluorescence microscopy of the tumor specimens (Figure 5).
Figure 3.
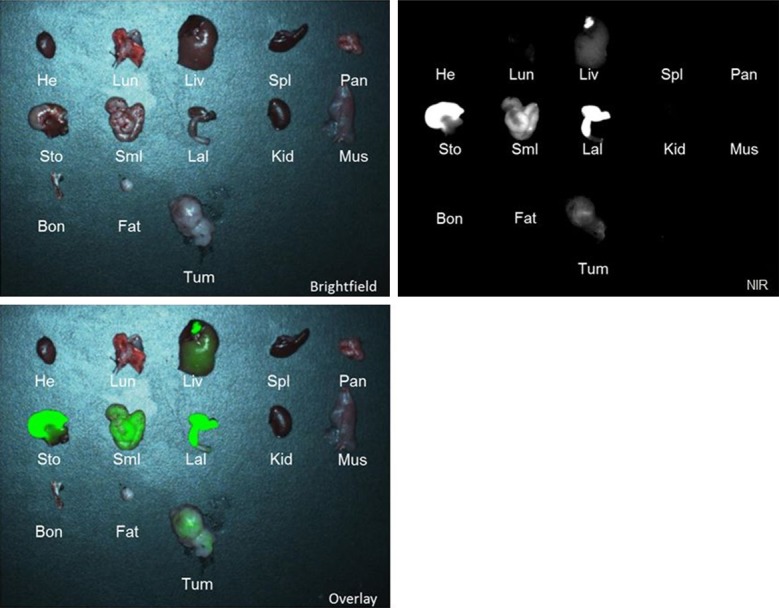
Biodistribution of NIR fluorescence in different murine organs after administering ICG. From left to right, row 1: heart (He), lungs (Lun), liver (Liv), spleen (Spl), pancreas (Pan); Row 2: stomach (Sto), small intestines (SmI), large intestines (LaI), kidney (Kid), muscle (Mus); Row 3: bone (Bon), fat (Fat), tumor (Tum).
Figure 4.
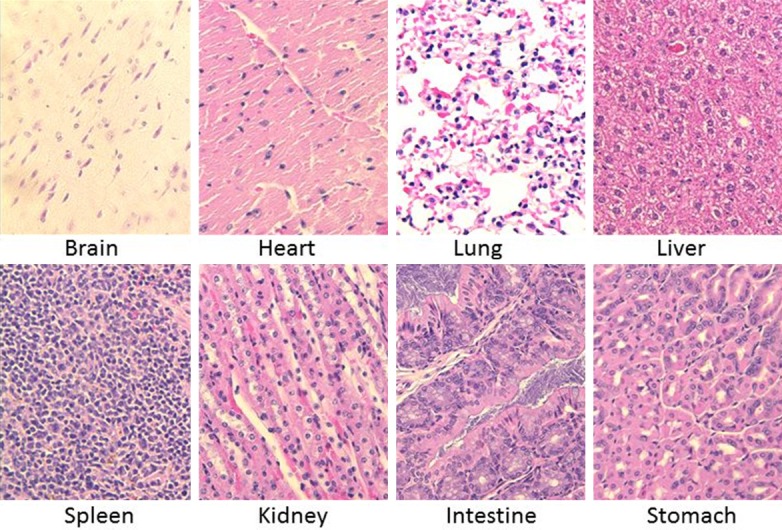
Vital organs (brain, heart, lung, liver, spleen, kidney, intestine, and stomach) were taken from the mice after imaging and fixed in formalin and embedded in paraffin. H&E stains were subsequently performed on these organ sections
Figure 5.
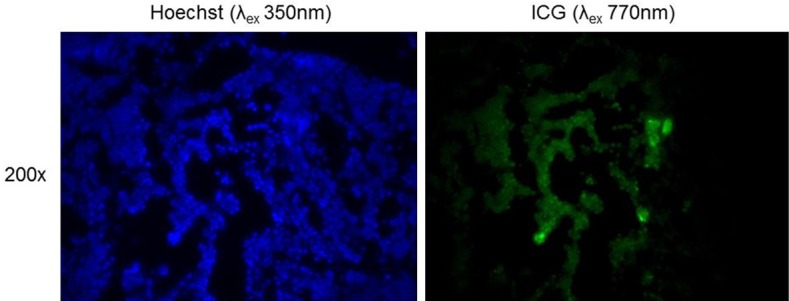
Fluorescence microscopy at λexcitation at 350 nm and λemission at ~500 nm for cellular staining (Hoescht). NIR microscopy at λexcitation at 770 nm and λemission at 820 nm for localizing ICG in the area of tumor cells.
Translation into intraoperative imaging of solid human tumors
Based on this preclinical data, a dose escalation study was approved by the University of Pennsylvania Institutional Review Board for patients with lung cancer. After informed consent, six patients were given different doses of intravenous ICG (patient 1&2: 0.71 mg/kg, patient 3&4: 2 mg/kg, and patient 5&6: 5 mg/kg) 24 hours prior to surgery. At the time of the thoracotomy, the pulmonary lesions were identified by traditional means of manual palpation and visual inspection. Next, the surgeons turned off the operating room lights and used NIR imaging at λex 780 nm to determine whether they could identify the lesion. Once the tumor was removed from the patient, the tumor was bisected on the back table prior to submitting it to pathology (Figure 6A).
Figure 6.
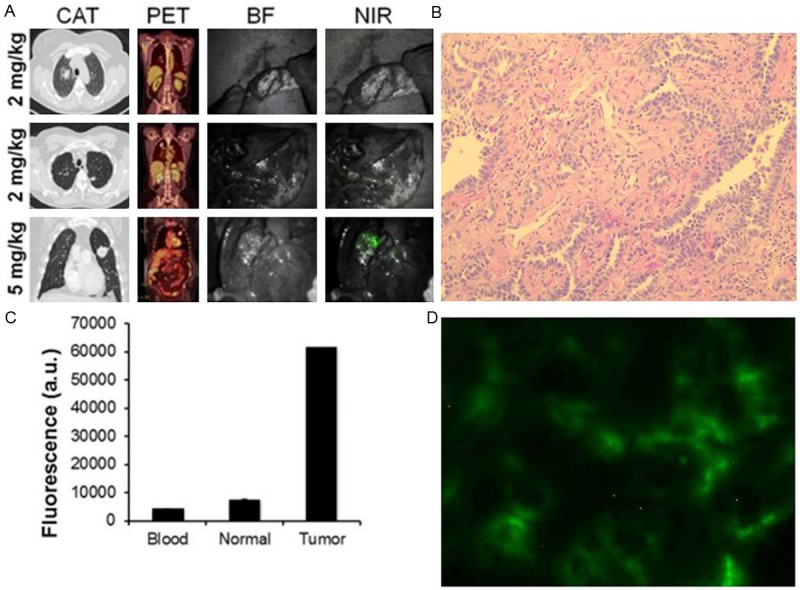
A. Representative images of three patients who underwent intraoperative imaging with ICG. Each patient underwent preoperative computed axial tomography (CAT) and positron emission tomography (PET) scanning. During the operation, each case was photo-documented by brightfield (BF) and NIR light. The first patient received 2 mg, the second patient received 2 mg/kg, and the third patient received 5 mg/kg. B. H&E and fluorescence microscopy confirmed the ICG was accumulating in the tumor tissue. C. Tumor, normal lung and blood fluorescence was measured by spectroscopy
Once the surface of the tumor was bisected, the tumors from patients 1 and 2 showed no fluorescence (TBR < 1.5). For patient 3, there was no tumor fluorescence; However, for patient 4, we could detect some mild fluorescence (TBR 1.8). Patients 5 and 6 who received 5 mg/kg of ICG 24 hours previously, had tumors with TBR of 3.7 and 3.1, respectively. Subjectively, the surgeon rated both these tumors as highly fluorescent, and the surgeon could perceive the location of the tumor with confidence.
A section of the tumors were taken for further ex vivo analysis (Figure 6B). Tumor samples were formalin fixed, paraffin embedded, and sectioned for H&E. Fresh tumor slices were also taken for immunofluorescence. Spectroscopy was performed on the blood, tumor and normal lung tissue and showed a > 6 fold difference in tumor fluorescence compared to background (Figure 6C).
Discussion
NIR imaging with ICG is a powerful tool for intraoperative imaging of solid tumors. Recently, it has been used for identifying primary and metastatic hepatic nodules in patients with cancer [11-15]. However, the uptake of ICG in non-hepatic tumors has not been rigorously evaluated, and has been based on perfusion studies, not tumor imaging. Thus, this study provided the preclinical optimization of ICG for non-hepatic solid tumors using the EPR effect. We found the optimal dose for ICG for solid tumors is 5 mg/kg, then, tumor imaging at 24 hours.
The mechanism of ICG uptake in solid tumors remains elusive. Currently, in hepatic tumors, it has been postulated that anion-transporting polypeptides, intracellular transporters and export transporters expressed on hepatocytes have been responsible for tumor contrast. In non-hepatic tumors, it is hypothesized that the EPR effect is the primary mechanism by which solid cancer accumulate ICG. The mechanism of EPR is related to differences in tumor oncotic pressure, pH, disorganization of vascular endothelium, local prostaglandin and bradykinin levels, and lack of lymphatic angiogenesis [26,27]. Based on this premise, we performed a detailed dose and time kinetic study in order to optimize ICG for humans.
Currently, the human dose that is indicated for perfusion studies is 2 mg. Multiple doses are frequently given during surgery when attempting to visualize vascular flow in gastrointestinal anastamoses, retinal surgery, colon resections and tissue flaps. ICG exhibits low toxicity (LD50 of 50-80 mg/kg for animals http://www.drugs.com/pro/indocyanine-green.html). Thus, the suggested dose (5 mg/kg) is likely to cause minimal problems. In multiple studies in prior decades, this dose has been found to safe in pediatrics, adults and pregnant woman for other purposes.
In this study, we found the TBR was optimal at 10 mg/kg. Presumably, higher doses may even provide superior tumor to normal tissue contrast. However, the TBR at 5 mg/kg was less than 15% different than the higher doses. Once the TBR was greater than 2.5, the surgeons’ noted they could not perceive a significant difference in the fluorescence emanating from the tumor. Thus, we chose 5 mg/kg because the likelihood of toxicity (e.g. hypersensitivity) would be lessened. It should be noted that for smaller tumors, a higher dose may be superior for detecting micro-deposits of cancer cells.
Although this time and dose is likely to be valid for non-gastrointestinal tract tumors, our biodistribution experiment revealed that even after 24 hours the ICG is still processing through the digestive tract. This suggests that NIR imaging with ICG would be problematic for imaging of tumors in the abdomen. Ideally, future NIR imaging agents could be processed through the renal system and would allow for imaging of tumors such as colon cancer.
In this study, 2 patients with lung tumors were NIR imaged after receiving 5 mg/kg of ICG and revealed several notable strengths. First, the tumors were subjectively fluorescent, and the tumor signal exceeded 3 times background. Future studies will need to confirm this in larger numbers, and other types of solid tumors will need to be tested. However, since the EPR effect functions by an underlying physical property of solid tumors, and is not receptor-specific, we predict it will be equally valid. Second, since ICG is readily available in hospitals, this approach is rapidly translatable. Since the optimal time to inject the patient is one day before surgery, it is practical, whereas a 12 hour or 14 hour interval would be more difficult to coordinate for surgery during normal working hours. Third, many commercial imaging systems are already available (e.g. Artemis by Quest, Pinpoint by Novadaq, Karl Storz) that can visualize ICG.
Disclosure of conflict of interest
None.
References
- 1.Jemal A, Bray F, Center MM, Ferlay J, Ward E, Forman D. Global cancer statistics. CA Cancer J Clin. 2011;61:69–90. doi: 10.3322/caac.20107. [DOI] [PubMed] [Google Scholar]
- 2.Aliperti LA, Predina JD, Vachani A, Singhal S. Local and systemic recurrence is the Achilles heel of cancer surgery. Ann Surg Oncol. 2011;18:603–607. doi: 10.1245/s10434-010-1442-0. [DOI] [PMC free article] [PubMed] [Google Scholar]
- 3.Eichfeld U, Dietrich A, Ott R, Kloeppel R. Video-assisted thoracoscopic surgery for pulmonary nodules after computed tomograph-yguided marking with a spiral wire. Ann Thorac Surg. 2005;79:313–316. doi: 10.1016/j.athoracsur.2003.10.122. discussion 316-317. [DOI] [PubMed] [Google Scholar]
- 4.Powell TI, Jangra D, Clifton JC, Lara-Guerra H, Church N, English J, Evans K, Yee J, Coxson H, Mayo JR, Finley RJ. Peripheral lung nodules: fluoroscopically guided video-assisted thoracoscopic resection after computed tomography-guided localization using platinum microcoils. Ann Surg. 2004;240:481–488. doi: 10.1097/01.sla.0000137132.01881.57. discussion 488-489. [DOI] [PMC free article] [PubMed] [Google Scholar]
- 5.Chella A, Lucchi M, Ambrogi MC, Menconi G, Melfi FM, Gonfiotti A, Boni G, Angeletti CA. A pilot study of the role of TC-99 radionuclide in localization of pulmonary nodular lesions for thoracoscopic resection. Eur J Cardiothorac Surg. 2000;18:17–21. doi: 10.1016/s1010-7940(00)00411-5. [DOI] [PubMed] [Google Scholar]
- 6.Zaman M, Bilal H, Woo CY, Tang A. In patients undergoing video-assisted thoracoscopic surgery excision, what is the best way to locate a subcentimetre solitary pulmonary nodule in order to achieve successful excision? Interact Cardiovasc Thorac Surg. 2012;15:266–272. doi: 10.1093/icvts/ivs068. [DOI] [PMC free article] [PubMed] [Google Scholar]
- 7.Fedor D, Johnson WR, Singhal S. Local recurrence following lung cancer surgery: incidence, risk factors, and outcomes. Surg Oncol. 2013;22:156–161. doi: 10.1016/j.suronc.2013.04.002. [DOI] [PMC free article] [PubMed] [Google Scholar]
- 8.Orosco RK, Tsien RY, Nguyen QT. Fluorescence imaging in surgery. IEEE Rev Biomed Eng. 2013;6:178–187. doi: 10.1109/RBME.2013.2240294. [DOI] [PMC free article] [PubMed] [Google Scholar]
- 9.Frangioni JV. New technologies for human cancer imaging. J. Clin. Oncol. 2008;26:4012–4021. doi: 10.1200/JCO.2007.14.3065. [DOI] [PMC free article] [PubMed] [Google Scholar]
- 10.Singhal S, Nie S, Wang MD. Nanotechnology applications in surgical oncology. Annu Rev Med. 2010;61:359–373. doi: 10.1146/annurev.med.60.052907.094936. [DOI] [PMC free article] [PubMed] [Google Scholar]
- 11.Van der Vorst JR, Schaafsma BE, Hutteman M, Verbeek FP, Liefers GJ, Hartgrink HH, Smit VT, Lowik CW, van de Velde CJ, Frangioni JV, Vahrmeijer AL. Near-infrared fluorescence-guided resection of colorectal liver metastases. Cancer. 2013;119:3411–3418. doi: 10.1002/cncr.28203. [DOI] [PMC free article] [PubMed] [Google Scholar]
- 12.Yokoyama N, Otani T, Hashidate H, Maeda C, Katada T, Sudo N, Manabe S, Ikeno Y, Toyoda A, Katayanagi N. Real-time detection of hepatic micrometastases from pancreatic cancer by intraoperative fluorescence imaging: preliminary results of a prospective study. Cancer. 2012;118:2813–2819. doi: 10.1002/cncr.26594. [DOI] [PubMed] [Google Scholar]
- 13.Van der Vorst JR, Hutteman M, Mieog JS, de Rooij KE, Kaijzel EL, Lowik CW, Putter H, Kuppen PJ, Frangioni JV, van de Velde CJ, Vahrmeijer AL. Near-Infrared fluorescence imaging of liver metastases in rats using indocyanine green. J Surg Res. 2011;174:266–71. doi: 10.1016/j.jss.2011.01.009. [DOI] [PMC free article] [PubMed] [Google Scholar]
- 14.Lida G, Asano K, Seki M, Ishigaki K, Teshima K, Yoshida O, Edamura K, Kagawa Y. Intraoperative identification of canine hepatocellular carcinoma with indocyanine green fluorescent imaging. J Small Anim Pract. 2013;54:594–600. doi: 10.1111/jsap.12148. [DOI] [PubMed] [Google Scholar]
- 15.Gotoh K, Yamada T, Ishikawa O, Takahashi H, Eguchi H, Yano M, Ohigashi H, Tomita Y, Miyamoto Y, Imaoka S. A novel image-guided surgery of hepatocellular carcinoma by indocyanine green fluorescence imaging navigation. J Surg Oncol. 2009;100:75–79. doi: 10.1002/jso.21272. [DOI] [PubMed] [Google Scholar]
- 16.Ishizawa T, Masuda K, Urano Y, Kawaguchi Y, Satou S, Kaneko J, Hasegawa K, Shibahara J, Fukayama M, Tsuji S, Midorikawa Y, Aburatani H, Kokudo N. Mechanistic background and clinical applications of indocyanine green fluorescence imaging of hepatocellular carcinoma. Ann Surg Oncol. 2014;21:440–448. doi: 10.1245/s10434-013-3360-4. [DOI] [PubMed] [Google Scholar]
- 17.Holt D, Okusanya O, Judy R, Venegas O, Jiang J, DeJesus E, Eruslanov E, Quatromoni J, Bhojnagarwala P, Deshpande C, Albelda S, Nie S, Singhal S. Intraoperative near-infrared imaging can distinguish cancer from normal tissue but not inflammation. PLoS One. 2014;9:e103342. doi: 10.1371/journal.pone.0103342. [DOI] [PMC free article] [PubMed] [Google Scholar]
- 18.Okusanya OT, Holt D, Heitjan D, Deshpande C, Venegas O, Jiang J, Judy R, DeJesus E, Madajewski B, Oh K, Wang M, Albelda SM, Nie S, Singhal S. Intraoperative near-Infrared imaging can identify pulmonary nodules. Ann Thorac Surg. 2014;98:1223–30. doi: 10.1016/j.athoracsur.2014.05.026. [DOI] [PMC free article] [PubMed] [Google Scholar]
- 19.Matsumura Y, Maeda H. A new concept for macromolecular therapeutics in cancer chemotherapy: mechanism of tumoritropic accumulation of proteins and the antitumor agent smancs. Cancer Res. 1986;46:6387–6392. [PubMed] [Google Scholar]
- 20.Heneweer C, Holland JP, Divilov V, Carlin S, Lewis JS. Magnitude of enhanced permeability and retention effect in tumors with different phenotypes: 89Zr-albumin as a model system. J Nucl Med. 2011;52:625–633. doi: 10.2967/jnumed.110.083998. [DOI] [PMC free article] [PubMed] [Google Scholar]
- 21.Madajewski B, Judy BF, Mouchli A, Kapoor V, Holt D, Wang MD, Nie S, Singhal S. Intraoperative near-infrared imaging of surgical wounds after tumor resections can detect residual disease. Clin Cancer Res. 2012;18:5741–5751. doi: 10.1158/1078-0432.CCR-12-1188. [DOI] [PMC free article] [PubMed] [Google Scholar]
- 22.Okusanya OT, Madajewski B, Segal E, Judy BF, Venegas OG, Judy RP, Quatromoni JG, Wang MD, Nie S, Singhal S. Small portable interchangeable imager of fluorescence for fluorescence guided surgery and research. Technol Cancer Res Treat. 2015;14:213–30. doi: 10.7785/tcrt.2012.500400. [DOI] [PMC free article] [PubMed] [Google Scholar]
- 23.Mohs AM, Mancini MC, Singhal S, Provenzale JM, Leyland-Jones B, Wang MD, Nie S. Hand-held spectroscopic device for in vivo and intraoperative tumor detection: contrast enhancement, detection sensitivity, and tissue penetration. Anal Chem. 2010;82:9058–65. doi: 10.1021/ac102058k. [DOI] [PMC free article] [PubMed] [Google Scholar]
- 24.Predina J, Eruslanov E, Judy B, Kapoor V, Cheng G, Wang LC, Sun J, Moon EK, Fridlender ZG, Albelda S, Singhal S. Changes in the local tumor microenvironment in recurrent cancers may explain the failure of vaccines after surgery. Proc Natl Acad Sci U S A. 2013;110:E415–424. doi: 10.1073/pnas.1211850110. [DOI] [PMC free article] [PubMed] [Google Scholar]
- 25.Zhang C, Liu T, Su Y, Luo S, Zhu Y, Tan X, Fan S, Zhang L, Zhou Y, Cheng T, Shi C. A near-infrared fluorescent heptamethine indocyanine dye with preferential tumor accumulation for in vivo imaging. Biomaterials. 2010;31:6612–6617. doi: 10.1016/j.biomaterials.2010.05.007. [DOI] [PubMed] [Google Scholar]
- 26.Ishizawa T, Masuda K, Urano Y, Kawaguchi Y, Satou S, Kaneko J, Hasegawa K, Shibahara J, Fukayama M, Tsuji S, Midorikawa Y, Aburatani H, Kokudo N. Mechanistic background and clinical applications of indocyanine green fluorescence imaging of hepatocellular carcinoma. Ann Surg Oncol. 2014;21:440–8. doi: 10.1245/s10434-013-3360-4. [DOI] [PubMed] [Google Scholar]
- 27.Shin EH, Li Y, Kumar U, Sureka HV, Zhang X, Payne CK. Membrane potential mediates the cellular binding of nanoparticles. Nanoscale. 2013;5:5879–5886. doi: 10.1039/c3nr01667f. [DOI] [PMC free article] [PubMed] [Google Scholar]


