

Abstract
Background: After an initial response to EGFR targeted therapy, secondary resistance almost invariably ensues, thereby limiting the clinical benefit of the drug. Hence, it has been recognized that the successful implementation of targeted therapy in the treatment of HNSCC cancer is very much dependent on predictive biomarkers for patient selection. Methods: We generated an in vitro model of acquired cetuximab resistance by chronically exposing three HNSCC cell lines to increasing cetuximab doses. Gene expression profiles of sensitive parental cells and resistant daughter cells were compared using microarray analysis. Growth inhibitory experiments were performed with an HB-EGF antibody and the MMP inhibitor, both in combination with cetuximab. Characteristics of EMT were analyzed using migration and invasion assays, immunofluorescent vimentin staining and qRT-PCR for several genes involved in this process. The function of the transcription factor AP-1 was investigated using qRT-PCR for several genes upregulated or downregulated in cetuximab resistant cells. Furthermore, anchorage-independent growth was investigated using the soft agar assay. Results: Gene expression profiling shows that cetuximab resistant cells upregulate several genes, including interleukin 8, the EGFR ligand HB-EGF and the metalloproteinase ADAM19. Cytotoxicity experiments with neutralizing HB-EGF antibody could not induce any growth inhibition, whereas an MMP inhibitor inhibited cell growth in cetuximab resistant cells. However, no synergetic effects combined with cetuximab could be observed. Cetuximab resistant cells showed traits of EMT, as witnessed by increased migratory potential, increased invasive potential, increased vimentine expression and increased expression of several genes involved in EMT. Furthermore, expression of upregulated genes could be repressed by the treatment with apigenin. The cetuximab resistant LICR-HN2 R10.3 cells tend to behave differently in cell culture, forming spheres. Therefore, soft agar assay was performed and showed more and larger colonies when challenged with cetuximab compared to PBS challenged cells. Conclusions: In summary, our results indicate that increased expression of the ligand HB-EGF could contribute to resistance towards cetuximab in our cetuximab resistant HNSCC cells. Furthermore, several genes upregulated or downregulated in cetuximab resistant cells are under control of the AP-1 transcription factor. However, more studies are warranted to further unravel the role of AP-1 in cetuximab resistance.
Keywords: Head and neck squamous cell carcinoma (HNSCC), cetuximab, resistance, HB-EGF, interleukin 8, ADAM19, transcription factor AP-1
Introduction
Molecular individualized medicine and the corresponding biomarkers are replacing the traditional “one-size-fits-all” medicine. The field of oncology has entered an era of personalized medicine where treatment selection for each cancer patient is becoming individualized or customized. Personalized medicine can be defined as “tailoring of medical treatment to the individual characteristics of each patient; to classify individuals into subpopulations that differ in their susceptibility to a particular disease or their response to a specific treatment so that preventive or therapeutic interventions can then be concentrated on those who will benefit, sparing expense and side effects for those who will not” [1].
In this regard, the epidermal growth factor receptor (EGFR) is recognized as a central regulator of proliferation and progression in many human cancers, including head and neck squamous cell carcinoma (HNSCC) and is, therefore, one of the most promising targets for molecular-targeted therapies in HNSCC. Furthermore, tumor EGFR expression is inversely correlated with clinical outcome in HNSCC patients [2,3]. In the last years, several potent EGFR inhibitors have been developed, including both EGFR targeting monoclonal antibodies and EGFR tyrosine kinase inhibitors.
After the initial promise of targeted therapies, drug resistance is now emerging as the major obstacle in the field of targeted therapies.
This non-responsiveness may be caused by multiple intrinsic and extrinsic/acquired resistance mechanisms. In the case of HNSCC, many tumors remain non-responsive to cetuximab, an EGFR targeting monoclonal antibody, as the single-agent response rate of this drug, is less than 15% [4], showing that intrinsic resistance is a widespread phenomenon. Nevertheless, cetuximab is known to provide a clinical benefit when used either in conjunction with radiation or in combination with chemotherapy [5,6]. From a clinical point of view, acquired resistance occurs after an initial response to therapy and eventually all HNSCC patients will relapse or become insensitive to further anti-EGFR therapy [7]. Therefore, determining the underlying active signaling pathways or genes may bring comprehensive understanding of these mechanisms of resistance and could consequently have an important impact on the effectiveness of treatment given in the acquired resistance clinical setting. Targeted therapy is thought to offer a higher therapeutic index and should therefore be associated with less toxicity than cytotoxic drugs [8]. However, predictive biomarkers are required to identify molecular determinants of resistance and to sub-classify tumors into homogenous molecular subtypes, thus maximizing efficacy and cost effectiveness and eventually enhancing quality of life for patients [1,9,10].
The development and combination of new agents that target members of the ErbB family or downstream effectors will lead to a more comprehensive approach in using targeted therapies and may overcome tumor-acquired resistance to single-agent therapies. Although previous results have been encouraging, there is a remaining need for further mechanistic insights [11].
In the current study, we generated a model of acquired cetuximab resistance by exposing cetuximab sensitive HNSCC cells to doses of cetuximab increasing over time, resulting in cetuximab resistant daughter HNSCC cells. This study provides valuable insights regarding the molecular mechanisms of acquired cetuximab resistance in HNSCC and could be used as a model to explore strategies to overcome therapeutic drug resistance.
Methods
Cell lines and culture conditions
The human HNSCC tumor cell line SC263, described previously [12], was kindly provided by Prof. Dr. Sandra Nuyts (University Hospital Leuven, Leuven, Belgium). The LICR-HN2 and LICR-HN5 cell lines were provided by Prof. Dr. Olivier De Wever (Ghent University Hospital, Ghent, Belgium). All these HNSCC derived cell lines were shown previously to respond to cetuximab therapy [13]. Cells were grown as monolayers in Dulbecco’s Modified Eagle Medium (DMEM), supplemented with 10% fetal calf serum, 2 mM glutamine and 1% penicillin/streptomycin. All media and supplements were obtained from Life Technologies (Merelbeke, Belgium). Cultures were maintained in exponential growth in a humidified 5% CO2/95% air atmosphere at 37°C. Cells were periodically screened for mycoplasma contamination (MycoAlertTM, Plus Mycoplasma detection kit, Lonza, Verviers, Belgium).
Generation of resistant cell clones
Previously, dose-response studies of cetuximab (Merck, Darmstadt, Germany) were performed in order to select cetuximab sensitive cell lines [13]. Cetuximab resistant variants of each cell line were derived from each original parental cell line by continuous exposure to cetuximab, starting with the IC50 concentration (drug concentration causing 50% growth inhibition) of cetuximab for 10-14 days for a particular tumor cell line. In parallel, controlled parental cells were exposed to the vehicle for cetuximab, PBS. After 9 or 10 dose doublings, dose-response studies were re-assessed for each resistant cell line (suffix Rx), by exposure to the maximally achieved dose of cetuximab every four weeks. Resistant cells were tested to investigate whether acquired resistance was a transient or lasting effect by re-assessing the dose-response studies of cetuximab after 6 weeks in cell culture without cetuximab.
Dose-response studies of cetuximab by SRB
Cetuximab resistant and cetuximab vehicle (PBS) cells were seeded in 48-well plates at cell concentrations assuring exponential cell growth during the whole assay. After overnight incubation at 37°C, cells were treated with 0-15 nM cetuximab for 168 h. Cell proliferation was determined by the sulphorhodamine B assay, as previously described [14]. All experiments were performed in triplicate and each concentration was tested six times within the same experiment. IC50 values were calculated using WinNonlin software (Pharsight, Mountain View, USA).
Genome wide gene expression and validation
Prior to RNA isolation using the Trizol method, cetuximab sensitive and resistant cells were treated with 15 nM cetuximab or vehicle (PBS) during 13 hours, thus eliciting activation of genes or signaling pathways responsible for (non-) response to cetuximab. In order to maintain minimal experimental variability, all cell lines were grown and treated in identical culture conditions.
For microarray experiments, RNA samples were amplified using the Illumina Totalprep RNA Amplification kit (Ambion, Austin, TX, USA). In short, mRNA fractions were converted to double stranded-cDNA. A subsequent in vitro transcription reaction produced cRNA strands with incorporated biotin-UTP nucleotides. 750 ng of the resulting cRNA was hybridized to an Illumina human HT12v4 beadchip (Illumina, San Diego, CA, USA). After overnight sample hybridization at 58°C, subsequent washing steps and sample labeling with a streptavidin-Cy3 dye (Amersham, Buckinghamshire, England), intensity values were read out on an Illumina iScan equipped with iScan control software (version 1) (Illumina). The software was configured in such a way that for every sample on the microarray, a file was created containing intensity values and XY coordinates for every probe present on the array. Next, the resulting data files were analyzed using the R package “Beadarray v1.14.0” for intensity reading and quantile normalization and were further processed in “Limma v3.2.1” to estimate differential gene expression [15,16]. In addition, pathway analysis was performed. For this purpose, a priori defined gene sets were downloaded from the Gene Ontology website (http://www.geneontology.org) and used as input in the Gene Set Enrichment v2.0 program [17].
All microarray expression data will be deposit in the Gene Expression Omnibus database (http://www.ncbi.nlm.nih.gov/geo/) at the time of acceptation of the paper.
Validation of microarray was assessed by qRT-PCR in 10 µl volumes with Power SYBR® Green RNA-to-CtTM 1-step kit (Applied Biosystems, Foster city, CA, USA). The reaction volume was made up as follows: 2x Taqman RT PCR mix, 200 nM forward and reverse primer each, 125x Taqman RT Enzyme Mix, 30 ng RNA to a total volume of 10 µl. Primer sequences is summarized in Table 1.
Table 1.
Sequence of primers used for validation of microarray results
| gene | forward | reverse |
|---|---|---|
| HB-EGF | GAAAGTCCGTGACTTGCAAGAGG | GTGGCTTGGAGGATAAAGTGACTC |
| IL8 | TCTGCAGCTCTGTGTGAAGGTG | TGTGGTCCACTCTCAATCACTCTC |
| HTRA1 | AAGTTCCTCACGGAGTCCCATGAC | TCAGCTCTTTGGCTTTGCTGGAC |
| KRTDAP | ACTGGGATGCCTTTCCTAAGCTG | TTCCAGTGGAGGTCATGGTCAC |
| GAPDH | TCCTGCACCACCAACTGCTTAG | TGGTCATGAGTCCTTCCACGATAC |
| ADAM19 | AGCACTTGCCGAGGAATTAGAGG | TCGATGACGTAGCTGAGGTTGC |
| VIM | AGATGCTTCAGAGAGAGGAAGCC | CAGAGACGCATTGTCAACATCCTG |
| ALAS1 | TAAGAGTCTTCCCTGCCTGGATGG | TGCTGGCTCCTGTGGAAAGAATC |
| HMBS | GGCAATGCGGCTGCAA | GGGTACCCACGCGAATCAC |
Each sample, including the non-template control, was run in triplicate. Relative gene expression levels were calculated according to the QbasePlus software (Biogazelle).
Growth inhibition experiments - xCELLigence
Growth inhibition experiments were carried out using the xCELLigence RTCA DP instrument (Roche Diagnostics GmbH, Mannheim, Germany) which was placed in a humidified incubator at 37°C and 5% CO2. Cell cytotoxicity experiments were performed using modified 16-well plates (E-plate, Roche Diagnostics GmbH), as previously described [18]. In short, 100 µL of cell-free DMEM medium (10% FBS) was added to the wells. After leaving the plates at room temperature for 30 min, the background impedance for each well was measured. Cells were harvested from exponential phase cultures by trypsinization using 0.05% Trypsin-EDTA (Invitrogen, Merelbeke, Belgium) and were counted automatically with a Scepter 2.0 device (Merck Millipore, Overijse, Belgium). Two replicates of each experimental condition were used in the same experiment. Cells were seeded at a concentration ensuring exponential growth during the assay. In accordance with the manufacturer’s guidelines, the plates were then left at room temperature for 30 minutes in order to allow cell attachment. Next, the plates were locked in the RTCA DP device inside the incubator and the impedance value of each well was automatically monitored by the xCELLigence system and expressed as a Cell Index value (CI). After a recovery period, cells were treated with the drug of interest; i.e. HB-EGF (monoclonal mouse antibody, R&D systems, Minneapolis, USA) or GM6001 (Enzo Life Sciences, Antwerp, Belgium). Combination studies were executed with single agent, vehicle and 15 nM cetuximab as control (Table 2).
Table 2.
Design of combination studies for the three drugs of interest
| Drug in Monotherapy | Monotherapy Cetuximab | Combination therapy | Vehicle |
|---|---|---|---|
| HB-EGF | 15 nM | 0.01; 0.1; 0.5; 1.0; 2.5; 5.0 µg/ml HB-EGF + 15 nM cetuximab | PBS |
| 10; 25; 50 mM GM6001 | 15 nM | 10; 25; 50 mM GM6001 + 15 nM cetuximab | DMSO |
For every experiment, corresponding vehicle solution was used as a control (Table 2). Cell index was monitored every 30 min during the experiment. After 72 hours of incubation with the particular drug of interest, cell index measurement was ended.
Migration assay
Migration of HNSCC cell lines was investigated by a Transwell system with 8.0 µm pore polycarbonate membrane insert (Corning®, NY, USA).
In order to exclude the effect of serum on the migratory capability, the experiment was run in conditions with (4 h) and without serum deprivation prior to the assay. Cells were detached using TrypLE™ Express (Life Technologies, Merelbeke, Belgium), counted and resuspended in 250 μl serum free medium (2.105 cells/insert) and incubated at 37°C (95% air-5% CO2). The lower chamber contained 600 μl medium supplemented with 10% FBS. 24 hours later, non-migrated wells were carefully removed with a cotton swab and migrated cells were fixed with 0.1% crystal violet in 20% methanol for 3 minutes at room temperature, followed by washing in deionized water to remove redundant staining. Next, stained membranes were visualized in three random non-overlapping fields at 10x objective and 10x eyepiece on a transmitted-light microscope (Leica DMBR, Leica Microsystems GmbH, Wetzlar, Germany) equipped with an AxioCam HRc camera (Carl Zeiss MicroImaging GmbH, Jena, Germany). Quantification was performed by processing all obtained images using ImageJ software (http://rsbweb.nih.gov/ij/), as described previously [18]. Degree of migration per experiment was determined by calculating the average pixel % area of the three random fields and experiments were performed in triplicate.
Invasion assay
Cell invasion experiments were carried out using a Transwell plate system as described for migration experiments, added with the application of Matrigel (Basement Membrane Matrix, growth factor reduced, BD Biosciences, Erembodegem, Belgium) as extracellular matrix component. Matrigel was thawed overnight on ice and mixed with ice-cold serum free medium to obtain a dilution corresponding with 12.5% v/v. All other conditions regarding culturing, cell seeding density and serum deprivation were identical to the Transwell migration assays described above. Experiments were performed in quadruplicate.
Immunofluorescence
For the immunofluorescent staining, cells were cultivated overnight in 6-well plates, with a coverslip on the bottom of the plate. The medium was removed, and the cells were washed once with 1x PBS buffer. Fixation of the cells was carried out for 5 minutes with ice-cold methanol and followed with a wash step 1x PBS. After permeabilization with 0.1% Triton X-100 in PBS for 10 minutes, the fixed cells were blocked with 1% BSA/PBS-buffer for 30 minutes. Next, cells were again washed with 1x PBS and incubated with the primary antibody vimentin (1/100, mouse, Dako, Glostrup, Denmark) for 1 hour. After washing 3 times with 1x PBS, cells were incubated for 2 hours with Alexa fluor 555 dye-coupled anti-mouse antibody (1/800, donkey, Life Technologies, Merelbeke, Belgium). The unbound secondary antibody was removed by 3 washes with 1x PBS for 5 minutes. Thereafter, the samples were counterstained with PPD mounting medium containing DAPI (Vector Laboratories, Burlingame, CA, USA). Samples were analyzed on an inverted immunofluorescence EVOS® FL Digital Fluorescence Microscope (Advanced Microscopy Group, Mill Creek, Washington, USA). The MDA-MB-231 breast cancer cell line was used as a positive control for vimentin staining. Negative control was achieved by incubation with only primary antibody or only secondary antibody.
qRT-PCR of genes associated with EMT and AP-1
Expression of genes associated with EMT or with the AP-1 transcription factor was assessed by qRT-PCR, as described above. Primer sequences are provided in Table 3.
Table 3.
Primer sequences of genes
| Gene | Forward primer | Reverse primer |
|---|---|---|
| VIM | CTTGAACGGAAAGTGGAATCCT | GTCAGGCTTGGAAACGTCC |
| FN1 | GGTGACACTTATGAGCGTCCTAAA | AACATGTAACCACCAGTCTCATGTG |
| TJP1 | AAGTCACACTGGTGAAATCC | CTCTTGCTGCCAAACTATCT |
| SNAI1 | AAGA TGCACA TCCGAAGCCA | CTCTTGGTGCTTGTGGAGCA |
| SNAI2 | CTCACCTCGGGAGCATACAG | GACTTACACGCCCCAAGGATG |
| TWIST1 | CTGCCCTCGGACAAGCTGAG | CTAGTGGGACGCGGACATGG |
| ZEB1 | GTTCTGCCAACAGTTGGTTT | GCTCAAGACTGTAGTTGATG |
| ZEB2 | TCTGAAGA TGAAGAAGGCTG | AGTGAATGAGCCTCAGGTAA |
| CST6 | GAGAAGCTGCGCTGTGACTTTGAG | AGTTGTGCTTTAGGAGCTGAGAGG |
| S100A8 | AGCTGTCTTTCAGAAGACCTGGTG | TCAGGGAGTACTTGTGGTAGACG |
| FOSL1 | AAGGCCTTGTGAACAGATCAGC | AGGAAGTCGGTCAGTTCCTTCC |
| PLAU | ATACGAACAGGCGAACTGTGAC | GCTGCCCTCCGAATTTCTTTGG |
Before RNA isolation using the Trizol method (Invitrogen, Merelbeke, Belgium), cells were treated with 15 nM cetuximab or PBS during 13 or 72 hours for the EMT experiment, whereas for the AP-1 experiment, cells were treated with 15 nM cetuximab or 15 nM cetuximab combined with 25 mM apigenin for 13 hours.
Colony formation in soft agar
Anchorage-independent growth of the LICR-HN2 R10.3 cell line was investigated using the soft agar assay. To prepare the base layer, 1 ml of 0.75% agar in DMEM media containing 10% FBS was added to 6 well plates and allowed to polymerize. The top layer consisted of 1 ml 1.104 cells per well suspended in 0.36% agar in DMEM with 10% FBS, containing 15 nM cetuximab or vehicle-solution (PBS) and plated in a 6 well plate. The top layer was covered with 0.5 ml DMEM twice a week, containing 15 nM cetuximab or PBS, in order to provide cells with fresh medium. After being cultured for 14 days at 37°C, colonies were stained with 0.04% crystal violet (Merck, Darmstadt, Germany) in 2% ethanol (Fisher Chemicals, Leicestershire, UK) in PBS. Three pictures per well of the stained colonies were taken using an EVOS® FL Digital Fluorescence Microscope.
Statistical analysis
All experiments were performed at least in triplicate. Results are presented as mean ± standard deviation. Possible significant differences (P≤0.05) were evaluated with Mann-Whitney U test, using SPSS v20.0 software.
Results
Generation of cetuximab resistant cell lines
Three human HNSCC cell lines LICR-HN2, LICR-HN5 and SC263, previously shown to be sensitive to cetuximab therapy, were exposed to increasing concentrations of cetuximab, starting with the IC50 of cetuximab for these cell lines; respectively 0.05, 0.43 and 0.13 nM cetuximab [13]. Eventually, cetuximab resistant daughter cells (suffix Rx) were generated, showing resistance towards high concentrations of cetuximab; respectively 25.6, 110.0 and 66.65 nM. In parallel, cells were exposed to the vehicle-solution PBS (suffix PBS). The resistant phenotype was characterized by performing cell proliferation assays when challenged with cetuximab (Figure 1A). Thus, we observed a higher proliferative potential in cetuximab resistant cells when treated with cetuximab compared with sensitive cells. Furthermore, statistical analysis showed that cetuximab sensitive and resistant cells responded significant different on 15 nM cetuximab (P=0.050 for all cell lines tested).
Figure 1.
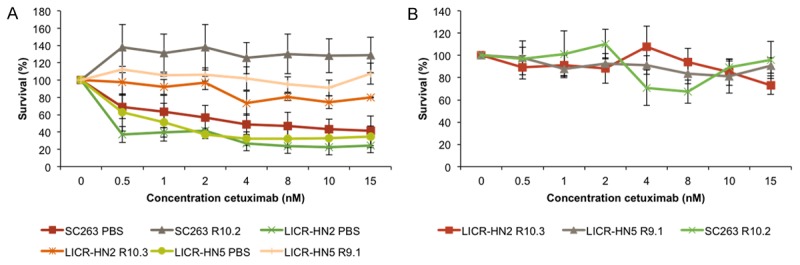
Dose response curves of cetuximab for isogenic cetuximab resistant and sensitive HNSCC cell lines. A. Dose response curves for the sensitive mother cell line (suffix PBS) and the resistant daughter cell line (suffix Rx) after exposure to cetuximab for 168 hours. The graph represents three independent experiments. B. Dose response curves of the three cetuximab resistant cell lines after 6 weeks of culture in drug-free medium, followed by cetuximab treatment for 168 hours. This graph represent one experiment executed in six-fold.
Next, we confirmed the stability of cetuximab resistance in a drug free culture system. LICR-HN2 R10.3, LICR-HN5 R9.1 and SC263 R10.2 cells still exhibited a resistant phenotype even after culture in drug-free medium for at least 6 weeks (Figure 1B).
Genome-wide gene expression profiling of cetuximab resistant cells
To determine the underlying signaling pathways responsible for cetuximab resistance, we used the same strategy as in our previous study [13], i.e. activation of these pathways and/or genes by treating cells with 15 nM cetuximab or vehicle (PBS) for 13 h prior to RNA isolation.
Since the LICR-HN5 and SC263 cells, both sensitive and resistant forms, tend to cluster more together compared to the LICR-HN2 cells (data not shown), most attention will be paid to the LICR-HN5 and SC263 cells. Hereby, differences in gene expression will be the result of different response towards cetuximab therapy. Furthermore, the effect of cetuximab treatment on the cells was minimal. Therefore, in the analysis no discrimination was made between treated (cetuximab) and vehicle (PBS). Differential gene expression of the LICR-HN5 and SC263 sensitive and resistant forms is shown in Tables 4 and 5.
Table 4.
Genes upregulated in resistant LICR-HN5 R9.1 and SC263 R10.2 cells compared with sensitive LICR-HN5 PBS and SC263 PBS cells. Genes were selected based on fold change > 2
| Gene Symbol | Gene Name | Fold Change |
|---|---|---|
| IL8 | interleukin 8 | 3.80 |
| CST6 | cystatin E/M | 2.66 |
| KRT80 | keratin 80 | 2.53 |
| ADAM19 | ADAM metallopeptidase domain 19 | 2.50 |
| THBS1 | thrombospondin 1 | 2.49 |
| HBEGF | heparin-binding EGF-like growth factor | 2.48 |
| CST6 | cystatin E/M | 2.33 |
| KRT8 | keratin 8 | 2.21 |
| FOSL1 | FOS-like antigen 1 | 2.17 |
| TAGLN | transgelin | 2.16 |
| PLAU | plasminogen activator, urokinase | 2.15 |
| TCEB1 | transcription elongation factor B (SIII), polypeptide 1 (15 kDa, elongin C) | 2.13 |
| RRS1 | RRS1 ribosome biogenesis regulator homolog (S. cerevisiae) | 2.09 |
| KRT18 | keratin 18 | 2.08 |
| HPCAL1 | hippocalcin-like 1 | 2.07 |
| KRT8 | keratin 8 | 2.03 |
| IER3 | immediate early response 3 | 2.03 |
| FAM20C | family with sequence similarity 20, member C | 2.02 |
| LTB | lymphotoxin beta (TNF superfamily, member 3) | 2.02 |
| TUBA1B | tubulin, alpha 1b | 2.02 |
| TUBA1A | tubulin, alpha 1a | 2.01 |
Table 5.
Genes downregulated in resistant LICR-HN5 R9.1 and SC263 R10.2 cells compared with sensitive LICR-HN5 PBS and SC263 PBS cells. Genes were selected based on fold change > 2
| Gene Symbol | Gene Name | Fold Change |
|---|---|---|
| HTRA1 | HtrA serine peptidase 1 | 3.45 |
| KRTDAP | keratinocyte differentiation-associated protein | 3.28 |
| PRODH | proline dehydrogenase (oxidase) 1 | 3.10 |
| KRT14 | keratin 14 | 2.79 |
| CXCR7 | Atypical Chemokine Receptor 3 | 2.77 |
| SPRR1B | small proline-rich protein 1B | 2.74 |
| ABCG1 | ATP-binding cassette, sub-family G (WHITE), member 1 | 2.60 |
| H19 | H19, imprinted maternally expressed transcript (non-protein coding) | 2.56 |
| AGR2 | anterior gradient 2 | 2.50 |
| SCGB1A1 | secretoglobin, family 1A, member 1 (uteroglobin) | 2.50 |
| MMP10 | matrix metallopeptidase 10 (stromelysin 2) | 2.43 |
| KRT13 | keratin 13 | 2.37 |
| KRT16 | keratin 16 | 2.31 |
| GJA1 | gap junction protein, alpha 1, 43 kDa | 2.30 |
| NTS | neurotensin | 2.30 |
| SLC7A8 | solute carrier family 7 (amino acid transporter light chain, L system), member 8 | 2.28 |
| TSC22D3 | TSC22 domain family, member 3 | 2.27 |
| SPANXC | SPANX family, member C | 2.19 |
| TNFSF10 | tumor necrosis factor (ligand) superfamily, member 10 | 2.18 |
| GPNMB | glycoprotein (transmembrane) nmb | 2.18 |
| PTPRZ1 | protein tyrosine phosphatase, receptor-type, Z polypeptide 1 | 2.15 |
| TP63 | tumor protein p63 | 2.15 |
| PPAP2B | phosphatidic acid phosphatase type 2B | 2.14 |
| SESN3 | sestrin 3 | 2.12 |
| IGFBP2 | insulin-like growth factor binding protein 2, 36 kDa | 2.10 |
| PI3 | peptidase inhibitor 3, skin-derived | 2.10 |
| BMP7 | bone morphogenetic protein 7 | 2.10 |
| MYLIP | myosin regulatory light chain interacting protein | 2.10 |
| CLCA2 | chloride channel accessory 2 | 2.10 |
| CXCR7 | atypical chemokine receptor 3 | 2.09 |
| SPRR1A | small proline-rich protein 1A | 2.07 |
| ALDH1A1 | aldehyde dehydrogenase 1 family, member A1 | 2.07 |
| DOCK8 | dedicator of cytokinesis 8 | 2.06 |
| AMTN | amelotin | 2.04 |
| ALDH3A1 | aldehyde dehydrogenase 3 family, member A1 | 2.04 |
| SREBF1 | sterol regulatory element binding transcription factor 1 | 2.03 |
| ABCA1 | ATP-binding cassette, sub-family A (ABC1), member 1 | 2.03 |
| ATP2B4 | ATPase, Ca++ transporting, plasma membrane 4 | 2.02 |
| SOX21 | SRY (sex determining region Y)-box 21 | 2.01 |
| S100A8 | S100 calcium binding protein A8 | 2.00 |
| ST6GALNAC2 | ST6 (alpha-N-acetyl-neuraminyl-2,3-beta-galactosyl-1,3)-N-acetylgalactosaminide alpha-2,6-sialyltransferase 2 | 2.00 |
| SCG2 | secretogranin II | 2.00 |
Among the most upregulated genes in LICR-HN5 R9.1 and SC263 R10.2 cells are the ligand HB-EGF, the chemokine IL8 and the metalloproteinase ADAM19. From literature, it is known that IL8 can activate the EGFR pathway by shedding of EGFR ligands in an ADAM dependent and independent way (Figure 2) [19]. In addition, shedding of HB-EGF has been associated with EGFR transactivation by G-protein coupled receptors [20]. Therefore, we hypothesized that acquired cetuximab resistance in our HNSCC cells could be the result of constitutive activation of the EGFR pathway caused by shedding of the HB-EGF ligand after activation of ADAM by a stimulus, possibly IL8.
Figure 2.
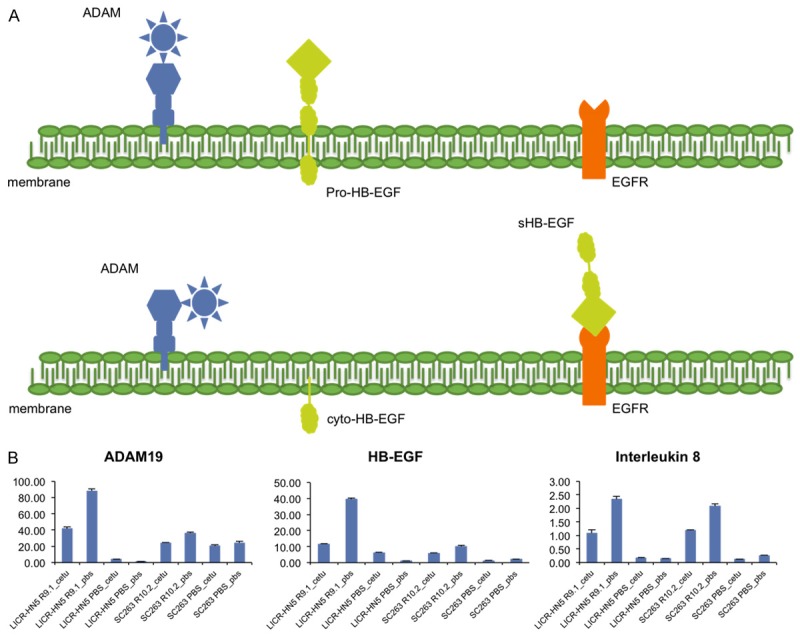
Simplified model of our hypothesis for acquired cetuximab resistance in our HNSCC cells. A. Schematic representation of the localization of HB-EGF, ADAM19 and EGFR. After a trigger (e.g. interleukin 8) ADAM becomes active and cleaves the pro-HB-EGF ligand in a soluble HB-EGF (sHB-EGF) and a carboxy-terminal fragment cyto-HB-EGF. The latter translocates to the nucleus where it activates several genes involved in cell cycle progression, whereas sHB-EGF can transactivate EGFR. B. Relative mRNA expression of HB-EGF, ADAM19 and interleukin 8 assessed by qRT-PCR in cetuximab resistant and sensitive cells challenged with cetuximab or vehicle (PBS) solution for 13 hours.
Targeting HB-EGF in cetuximab resistant cell lines did not establish growth inhibition, whereas inhibition of MMPs resulted in decreased cell survival
In order to investigate the role of HB-EGF in our cetuximab resistant cells, these cells were treated with a neutralizing antibody targeting soluble HB-EGF in combination with cetuximab. Surprisingly, we did not observe any additional growth inhibition after treatment in the LICR-HN5 R9.1 (Figure 3A) and SC263 R10.2 (Figure 3B) cells. In fact, the LICR-HN5 R9.1 cells tended to grow faster in the presence of cetuximab compared with control (PBS). This effect could not be inhibited by addition of the neutralizing HB-EGF antibody (Figure 3A).
Figure 3.
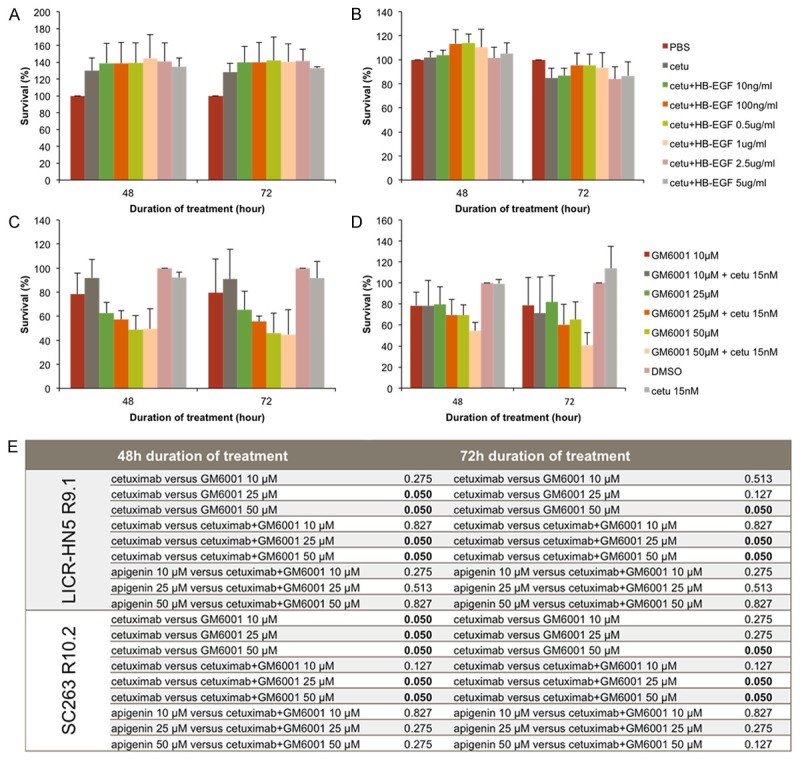
Relative cell survival of LICR-HN5 R9.1 and SC263 R10.2 cells after treatment with a neutralizing antibody targeting HB-EGF or the matrix metalloproteinase inhibitor GM6001. A & B. Cell survival of LICR-HN5 R9.1 cells (A) and SC263 R10.2 cells (B) after several conditions of a neutralizing HB-EGF antibody in combination with cetuximab. C & D. Cell survival of LICR-HN5 R9.1 cells (C) and SC263 R10.2 cells (D) after several conditions of a broad-spectrum MMP inhibitor GM6001 in monotherapy and in combination with cetuximab. Cells treated with vehicle-solution (PBS or DSMO) were used as absolute control and assimilated to 100% survival. All experiments were performed in triplicate. E. Statistical analysis of LICR-HN5 R9.1 and SC263 R10.2 cells and the MMP inhibitor GM6001 for the experimental conditions using Mann-Whitney U test.
Next, as pro-HB-EGF requires cleavage into soluble ligands by cell surface proteases to bind EGFR, we examined the effect of a matrix metalloproteinase inhibitor, GM6001, in combination with cetuximab on cetuximab resistant cell lines LICR-HN5 R9.1 (Figure 3C) and SC263 R10.2 (Figure 3D). A dose-dependent decrease in cell survival was observed in cetuximab resistant cells treated with GM6001 (Figure 3C and 3D). However, the obtained decrease in cell survival was solely the effect of GM6001, as the survival histograms of GM6001 in monotherapy are not statistically significant different from the corresponding survival histograms of the combination groups (Figure 3E).
Cetuximab resistant HNSCC cells exhibit characteristics of epithelial-to-mesenchymal transition (EMT)
As literature suggests that epithelial-to-mesenchymal transition (EMT) could contribute to cetuximab resistance [21-23] and our microarray analysis showed traits of EMT, we investigated several characteristics of EMT; such as migratory capacity, invasiveness and expression of several associated marker genes and transcription factors.
Transwell migration assays showed that cetuximab resistant LICR-HN5 R9.1 cells had a stronger migratory capacity compared with cetuximab sensitive LICR-HN5 PBS cells independent of preceding serum deprivation (P=0.050) (Figure 4A). In the invasion assay, however, this effect disappeared for both the serum free condition as well as the non-serum free condition (P=0.564 and P=0.773 respectively) (Figure 4C). Furthermore, increased expression of vimentin, a mesenchymal intermediate filament protein, and therefore an indication of EMT, was noticed in the drug resistant cells compared with drug sensitive cells (Figure 4B).
Figure 4.
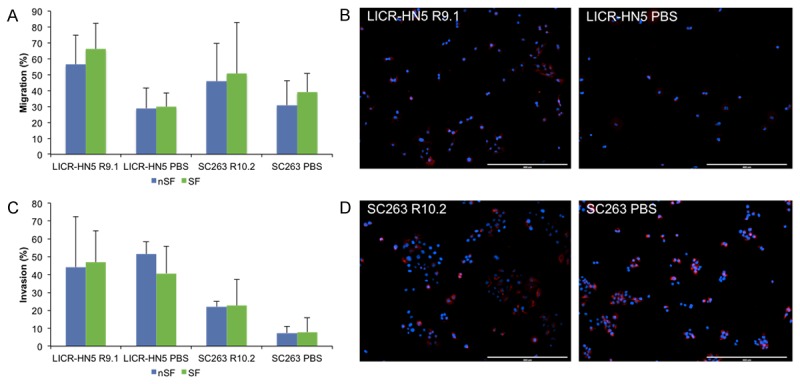
Characteristics of EMT: migration, invasion and vimentine expression. (A & C) Migration (A) and invasion (C) assay for cetuximab resistant LICR-HN5 R9.1 and SC263 R10.2 and cetuximab sensitive LICR-HN5 PBS and SC263 PBS cells. Migration experiments were performed in triplicate, whereas invasion assay were performed in quadruplicate. (B & D) Vimentin immunofluorescent staining of (B) LICR-HN5 and (D) SC263; left: resistant and right: sensitive isogenic cell lines. Blue = dapi, nucleus and red = vimentin.
In contrast to the LICR-HN5 R9.1 cells, the cetuximab resistant SC263 R10.2 cells did show a significantly increased invasive potential in the non-serum free condition (P=0.021) and a trend towards significance in the serum free condition (P=0.083) (Figure 4C). In this cell line, however, the observed increase in the migratory capacity was not statistically significant (P=0.513) in non-serum free as well as in serum free conditions (Figure 4A). Vimentin expression could be observed in cetuximab resistant as well as sensitive SC263 cells (Figure 4D). Overall, serum deprivation had no statistically significant effect on the migration or invasion of both cell lines.
Figure 5 shows the mRNA expression profiles of cetuximab sensitive and resistant SC263 and LICR-HN5 cells for different genes involved in EMT.
Figure 5.
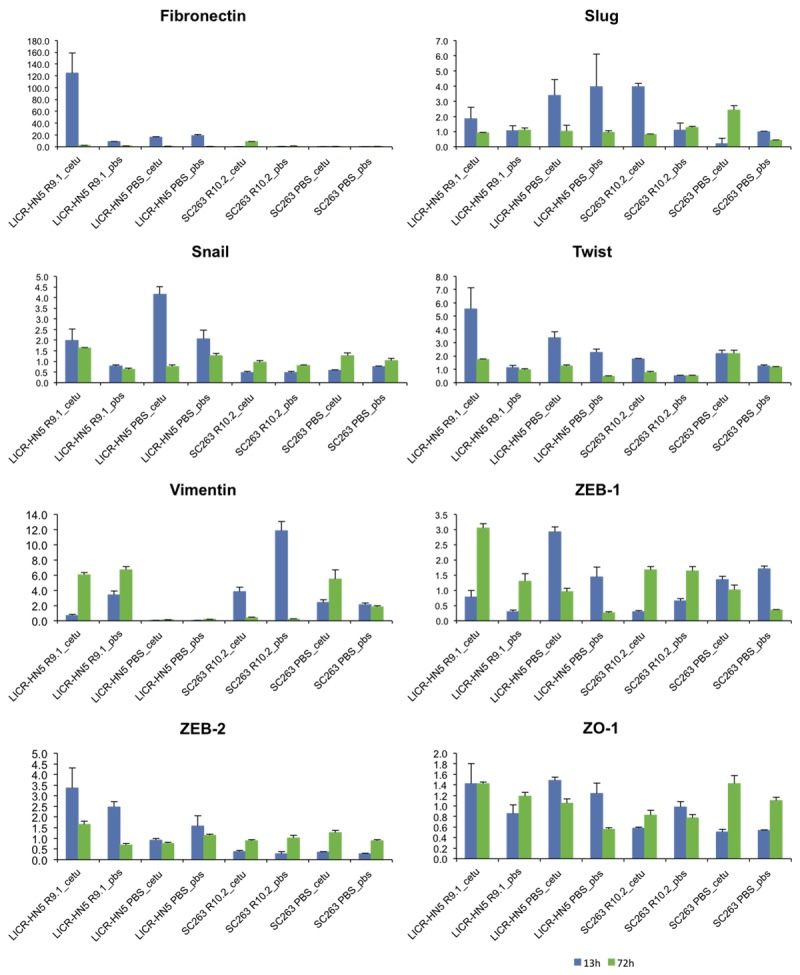
Relative gene expression profiles of EMT-related genes for the two HNSCC cell lines LICR-HN5 and SC263 (sensitive and resistant forms) challenged with cetuximab “cetu” or PBS “pbs” for 13 or 72 hours (blue and green respectively). qRT-PCR reactions were performed in triplicate.
A remarkable increase in fibronectin was observed in LICR-HN5 R9.1 challenged with cetuximab for 13 hours, whereas in SC263 R10.2 this increase was only observed after cetuximab exposure for 72 hours. In agreement with our immunofluorescent staining, a strong increase in the mesenchymal protein vimentin mRNA expression was observed in LICR-HN5 R9.1 cells, both after 13 and 72 hours of cetuximab exposure. Cetuximab could initially reduce vimentin expression in SC263 R10.2 cells as the untreated cells express more vimentin, though vimentin expression in cetuximab treated SC263 R10.2 is higher compared with SC263 PBS cells. However, longer exposure times resulted in more vimentin expression in SC263 PBS cells compared with S263 R10.2 cells. Furthermore, the expression of the ZEB-1 transcription factor was initially lower in the cetuximab resistant LICR-HN5 cells, but longer cetuximab exposure resulted in the opposite effect. ZEB-2 expression was higher under both conditions in the LICR-HN5 R9.1 cells. Higher expression of Slug, a transcriptional repressor of E-cadherin was noticed in the cetuximab sensitive LICR-HN5 versus cetuximab resistant daughter cells. For the SC263 cells, 13 hours of cetuximab treatment led to increased expression of this transcription factor in SC263 R10.2 cells. However, longer exposure resulted in a small increase for the SC263 PBS cells compared with resistant SC263 cells.
Several upregulated genes reveal a common promoter site for the transcription factor AP-1 in their regulatory region
Examination of the regulatory region of many upregulated genes in our microarray study revealed a common binding site for the transcription factor activator protein 1 (AP-1), which can be activated by injury, cytokines and growth factors [24]. Therefore, cetuximab resistant cells were treated with apigenin, an ERK1/2 inhibitor, and the expression of selected genes was assessed with qRT-PCR (Figure 6).
Figure 6.
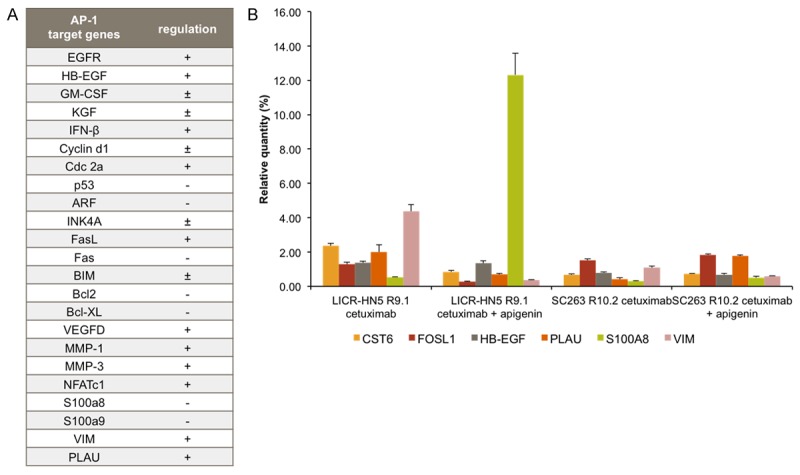
A. List of AP-1 target genes and the effect on their expression; +: positively regulated, -: negatively regulated and ±: positively or negatively regulated depending on the AP-1 dimer composition [66,69]. B. Gene expression profiles of several AP-1 target genes after treatment (13 h) with 15 nM cetuximab (control) and after treatment with 15 nM cetuximab plus ERK inhibitor 25 mM apigenin. qRT-PCR reactions were performed in triplicate.
Figure 6 shows that treatment with the ERK inhibitor apigenin combined with cetuximab for 13 hours resulted in a decrease of cystatin E/M (CST6), FOS-like antigen 1 (FOSL1), plasminogen activator urokinase (PLAU) and vimentin (VIM) expression in the LICR-HN5 R9.1 cells, whereas in the SC263 10.2 cells apigenin only had a negative effect on vimentin expression. Furthermore, in both cetuximab resistant cells, S100A8 expression was increased after apigenin treatment, which is negatively regulated by AP-1. However, expression of plasminogen activator urokinase was increased in the SC263 R10.2 cells after apigenin treatment. Apigenin had no effect on the expression of HB-EGF in LICR-HN5 R9.1 and SC263 R10.2 cells.
Exposure to cetuximab potentiates anchorage independence of LICR-HN2 R10.3 cells
The microarray dendrogram (data not shown) indicated that the LICR-HN2 (sensitive and resistant) cells cluster further from the LICR-HN5 and SC263 (sensitive and resistant) cells. Furthermore, we observed a different phenotype in cell culture. LICR-HN2 R10.3 cells tend to form multicellular spheroids in cell culture (Figure 7A). In order to investigate whether cetuximab induces the ability to survive a semi-solid environment, soft agar experiments were performed for cetuximab resistant LICR-HN2 R10.3 cells challenged with cetuximab or vehicle (PBS) (Figure 7B and 7C).
Figure 7.
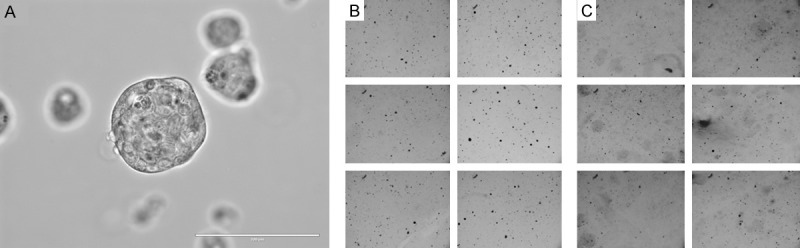
(A) Macroscopic image of LICR-HN2-R cells in culture. (B & C) Soft agar assay of LICR-HN2 R10.3 challenged with 15 nM cetuximab (B), and LICR-HN2 R10.3 cells challenged with PBS (C). Soft agar assay was performed in 2 wells and 3 non-overlapping fields were taken per well at a 4x objective on an EVOS ®FL Digital Fluorescence Microscope.
Figure 7B shows that challenge of resistant LICR-HN2 R10.2 cells with cetuximab results in increased anchorage independent growth of LICR-HN2 R10.2 compared with PBS treated cells (Figure 7C).
Discussion
The clinical efficacy of cetuximab in HNSCC patients is limited by the development of therapeutic resistance. However, little is known about these mechanisms in HNSCC. In the current study, we established a model of acquired resistance towards cetuximab in vitro by chronically exposing HNSCC cell lines to increasing doses of cetuximab.
Evaluation of our microarray data has revealed several interesting genes upregulated in cetuximab resistant cells compared with cetuximab sensitive cells, including IL8, HB-EGF and ADAM19. We focused on these genes for the following reasons. First, the most differentially expressed protein IL8 was previously shown to confer resistance towards anti-VEGF therapy [25] and the role of IL8 in EGFR transactivation has been described in several studies [26-28]. Furthermore, high IL8 expression has been negatively associated with overall survival, disease-free survival, and distant metastasis-free survival in nasopharyngeal carcinoma [29]. Second, increased expression of EGFR binding ligands may contribute to cetuximab resistance, as several studies have reported upregulation of EGFR ligands in resistant cells [30-34]. Finally, HB-EGF has been shown to activate EGFR even in the presence of cetuximab [30].
Our results show that neutralization of sHB-EGF combined with cetuximab could not decrease cell proliferation of cetuximab resistant cells. This might be due to nuclear translocation of cyto-HB-EGF, which is followed by nuclear export of the transcriptional repressor promyelocytic leukemia zinc finger protein and binding to B-cell lymphoma 6 [35,36]. Consequently, the suppression of cyclin A, cyclin D2 and c-Myc genes is reversed, resulting in cell cycle progression [35-38]. However, others have shown that EGFR phosphorylation decreases after treatment with a neutralizing HB-EGF antibody [26]. Therefore, cleavage of HB-EGF was prevented by the MMP inhibitor GM6001. This inhibitor was able to induce cell cytotoxicity, but no synergistic effect could be observed in combination with cetuximab therapy. However, it has been shown that knockdown of HB-EGF reverses cetuximab resistance in HNSCC cells [30]. Interestingly, one study reported translocation to the nuclear envelope of pro-HB-EGF [39]. This might explain our observation that no synergy between cetuximab and the MMP inhibitor GM6001 could be observed in our experiments.
In the literature, EMT has been proposed as a mechanism of resistance towards EGFR targeting therapeutics [21-23,40-44]. This process is characterized by loss of epithelial cell characteristics and acquisition of mesenchymal phenotypic traits, causing tumor cells to detach from neighboring cells and to migrate into adjacent tissue [45-47]. However, it has been reported that EGFR inhibition can promote an infiltrative front composed of mesenchymal-like cells, which made up a small subpopulation of the tumor before therapy [48]. Increased expression of IL8 and HB-EGF have been linked with EMT [29,30,49-54]. Both genes are upregulated in our cetuximab resistant cells and these cells shows traits of EMT, including higher migratory (LICR-HN5 R9.1 cells, P=0.050) and invasive capacity (SC263 R10.2 cells, P=0.021). Moreover, our microarray profile reveals upregulation of the epithelial markers KRT13, KRT14, KRT16 and KRTDAP in cetuximab sensitive cells, whereas resistant cells were characterized by upregulation of protease urokinase (PLAU), transgelin (TAGLN), ADAM19 and thrombospondin (TSP-1), all of which have functions associated with features of EMT [55-59]. Other important changes in the EMT expression profile of LICR-HN5 R9.1 cells included increased fibronectin, vimentin and ZEB2. For the SC263 R10.2 cells, an increase in fibronectin and Slug was observed, whereas the mesenchymal protein vimentin was more present in cetuximab sensitive SC263 PBS cells. However, EMT is a process in which different genes and transcription factors at certain times in this process will be regulated. Additionally, upregulation of the protease inhibitor cystatin M (CST6) was observed in our cetuximab resistant cells. Interestingly, increased expression of CST6 has been linked with metastasis in oropharyngeal squamous cell carcinoma, rescuing tumor cells from TNF-induced apoptosis [60]. Strikingly, several genes upregulated in cetuximab sensitive cells are known to be involved in aspects of tumor growth, such as p63 (TP63), neurotensin (NTS) and CXCR7 [61,62].
Other important processes involved in metastasis are anchorage-independency and anoikis resistance [63,64]. In this regard, it is an interesting finding that LICR-HN2 R10.3 cells not only were able to grow in an anchorage-independent manner in vitro as tumor spheroids, these cells also formed more and larger colonies when challenged with cetuximab. Previously, it has been shown that Ras could induce anchorage-independent growth, involving multiple signals leading to both expression of cyclin A and activation of cyclin-dependent kinase activities in the absence of cell adhesion [65]. This is an important observation, as it potentially implicates that cetuximab resistant HNSCC patients might deteriorate upon persistent cetuximab treatment.
The activator protein complex (AP-1) is formed by a FOS gene, which can dimerize with proteins of the JUN family through leucine zipper domains and have been implicated as regulators of cell proliferation, differentiation and transformation [66]. As most of the early response gene activation events in our microarray are facilitated by FOS/JUN AP-1 associated pathways and regulation of AP-1 is attributable to ERK1/2 [66-69], we investigated the effect of an ERK inhibitor, apigenin, on the expression of selected genes. These results indicate that the expression of these genes could be reversed by apigenin treatment in LICR-HN5 R9.1 cells, whereas the expression of these genes in the SC263 R10.2 cells was less influenced by 13 hours of apigenin treatment. Interestingly, ERK activation is considered essential for entry into the cell cycle, and therefore, ERK or AP-1 is considered as a strong target for cancer therapy [67,68]. Inhibitors of AP-1 have been shown to block tumor promotion, transformation, progression and invasion [70]. Resveratrol, curcumin, epigallocatechin gallate, quercetin and caffeic acid phenethyl ester, all inhibit AP-1 activation to varying degrees [70].
Conclusion
In summary, our results indicate that 1) increased expression of the ligand HB-EGF (sHB-EGF and cyto-HB-EGF) could be responsible for resistance towards cetuximab in our cetuximab resistant HNSCC cells; 2) cetuximab resistant cells showed characteristics of EMT, and 3) several upregulated genes in cetuximab resistant cells share a common promoter site for the AP-1 transcription factor. However, more studies are warranted to further unravel the role of AP-1 in cetuximab resistance.
Acknowledgements
AW is funded by Research Foundation Flanders (FWO-Vlaanderen, Belgium) as postdoctoral fellow.
Disclosure of conflict of interest
None.
Abbreviations
- ADAM19
a disintegrin and metalloproteinase 19
- AP-1
activator protein 1
- Cyto-HB-EGF
carboxy-terminal fragment of HB-EGF
- EGFR
epidermal growth factor receptor
- EMT
epithelial-to-mesenchymal transition
- HB-EGF
heparin-binding growth factor
- HNSCC
head and neck squamous cell carcinoma
- IL8
interleukin 8
- MMP
matrix metalloproteinase
- sHB-EGF
soluble HB-EGF
- SRB
sulforhodamine B
References
- 1.Kalia M. Personalized oncology: recent advances and future challenges. Metabolism. 2013;62(Suppl 1):S11–14. doi: 10.1016/j.metabol.2012.08.016. [DOI] [PubMed] [Google Scholar]
- 2.Temam S, Kawaguchi H, El-Naggar AK, Jelinek J, Tang H, Liu DD, Lang W, Issa JP, Lee JJ, Mao L. Epidermal growth factor receptor copy number alterations correlate with poor clinical outcome in patients with head and neck squamous cancer. J. Clin. Oncol. 2007;25:2164–2170. doi: 10.1200/JCO.2006.06.6605. [DOI] [PubMed] [Google Scholar]
- 3.Dittmann K, Mayer C, Rodemann HP. Nuclear EGFR as novel therapeutic target: insights into nuclear translocation and function. Strahlentherapie und Onkologie. 2010;186:1–6. doi: 10.1007/s00066-009-2026-4. [DOI] [PubMed] [Google Scholar]
- 4.Vermorken JB, Trigo J, Hitt R, Koralewski P, Diaz-Rubio E, Rolland F, Knecht R, Amellal N, Schueler A, Baselga J. Open-label, uncontrolled, multicenter phase II study to evaluate the efficacy and toxicity of cetuximab as a single agent in patients with recurrent and/or metastatic squamous cell carcinoma of the head and neck who failed to respond to platinum-based therapy. J. Clin. Oncol. 2007;25:2171–2177. doi: 10.1200/JCO.2006.06.7447. [DOI] [PubMed] [Google Scholar]
- 5.Bonner JA, Harari PM, Giralt J, Azarnia N, Shin DM, Cohen RB, Jones CU, Sur R, Raben D, Jassem J, Ove R, Kies MS, Baselga J, Youssoufian H, Amellal N, Rowinsky EK, Ang KK. Radiotherapy plus cetuximab for squamous-cell carcinoma of the head and neck. N Engl J Med. 2006;354:567–578. doi: 10.1056/NEJMoa053422. [DOI] [PubMed] [Google Scholar]
- 6.Vermorken JB, Mesia R, Rivera F, Remenar E, Kawecki A, Rottey S, Erfan J, Zabolotnyy D, Kienzer HR, Cupissol D, Peyrade F, Benasso M, Vynnychenko I, De Raucourt D, Bokemeyer C, Schueler A, Amellal N, Hitt R. Platinumbased chemotherapy plus cetuximab in head and neck cancer. N Engl J Med. 2008;359:1116–1127. doi: 10.1056/NEJMoa0802656. [DOI] [PubMed] [Google Scholar]
- 7.Lu Y, Li X, Liang K, Luwor R, Siddik ZH, Mills GB, Mendelsohn J, Fan Z. Epidermal growth factor receptor (EGFR) ubiquitination as a mechanism of acquired resistance escaping treatment by the anti-EGFR monoclonal antibody cetuximab. Cancer Res. 2007;67:8240–8247. doi: 10.1158/0008-5472.CAN-07-0589. [DOI] [PubMed] [Google Scholar]
- 8.Choi S, Myers JN. Molecular pathogenesis of oral squamous cell carcinoma: implications for therapy. J Dent Res. 2008;87:14–32. doi: 10.1177/154405910808700104. [DOI] [PubMed] [Google Scholar]
- 9.Jackson DB, Sood AK. Personalized cancer medicine--advances and socio-economic challenges. Nature reviews. Clin Oncol. 2011;8:735–741. doi: 10.1038/nrclinonc.2011.151. [DOI] [PMC free article] [PubMed] [Google Scholar]
- 10.Schilsky RL. Personalized medicine in oncology: the future is now. Nat Rev Drug Discov. 2010;9:363–366. doi: 10.1038/nrd3181. [DOI] [PubMed] [Google Scholar]
- 11.Lurje G, Lenz HJ. EGFR signaling and drug discovery. Oncology. 2009;77:400–410. doi: 10.1159/000279388. [DOI] [PubMed] [Google Scholar]
- 12.Begg AC, Sprong D, Balm A, Martin JM. Premature chromosome condensation and cell separation studies in biopsies from head and neck tumors for radiosensitivity prediction. Radiother Oncol. 2002;62:335–343. doi: 10.1016/s0167-8140(01)00498-4. [DOI] [PubMed] [Google Scholar]
- 13.Boeckx C, Op de Beeck K, Wouters A, Deschoolmeester V, Limame R, Zwaenepoel K, Specenier P, Pauwels P, Vermorken JB, Peeters M, Van Camp G, Baay M, Lardon F. Overcoming cetuximab resistance in HNSCC: The role of AURKB and DUSP proteins. Cancer Lett. 2014;354:365–77. doi: 10.1016/j.canlet.2014.08.039. [DOI] [PubMed] [Google Scholar]
- 14.Pauwels B, Korst AE, de Pooter CM, Pattyn GG, Lambrechts HA, Baay MF, Lardon F, Vermorken JB. Comparison of the sulforhodamine B assay and the clonogenic assay for in vitro chemoradiation studies. Cancer Chemother Pharmacol. 2003;51:221–226. doi: 10.1007/s00280-002-0557-9. [DOI] [PubMed] [Google Scholar]
- 15.Dunning MJ, Smith ML, Ritchie ME, Tavare S. beadarray: R classes and methods for Illumina bead-based data. Bioinformatics. 2007;23:2183–2184. doi: 10.1093/bioinformatics/btm311. [DOI] [PubMed] [Google Scholar]
- 16.Wettenhall JM, Smyth GK. limmaGUI: a graphical user interface for linear modeling of microarray data. Bioinformatics. 2004;20:3705–3706. doi: 10.1093/bioinformatics/bth449. [DOI] [PubMed] [Google Scholar]
- 17.Subramanian A, Tamayo P, Mootha VK, Mukherjee S, Ebert BL, Gillette MA, Paulovich A, Pomeroy SL, Golub TR, Lander ES, Mesirov JP. Gene set enrichment analysis: a knowledge-based approach for interpreting genome-wide expression profiles. Proc Natl Acad Sci U S A. 2005;102:15545–15550. doi: 10.1073/pnas.0506580102. [DOI] [PMC free article] [PubMed] [Google Scholar]
- 18.Limame R, Wouters A, Pauwels B, Fransen E, Peeters M, Lardon F, De Wever O, Pauwels P. Comparative analysis of dynamic cell viability, migration and invasion assessments by novel real-time technology and classic endpoint assays. PLoS One. 2012;7:e46536. doi: 10.1371/journal.pone.0046536. [DOI] [PMC free article] [PubMed] [Google Scholar]
- 19.Tanida S, Joh T, Itoh K, Kataoka H, Sasaki M, Ohara H, Nakazawa T, Nomura T, Kinugasa Y, Ohmoto H, Ishiguro H, Yoshino K, Higashiyama S, Itoh M. The mechanism of cleavage of EGFR ligands induced by inflammatory cytokines in gastric cancer cells. Gastroenterology. 2004;127:559–569. doi: 10.1053/j.gastro.2004.05.017. [DOI] [PubMed] [Google Scholar]
- 20.Prenzel N, Zwick E, Daub H, Leserer M, Abraham R, Wallasch C, Ullrich A. EGF receptor transactivation by G-protein-coupled receptors requires metalloproteinase cleavage of proHB-EGF. Nature. 1999;402:884–888. doi: 10.1038/47260. [DOI] [PubMed] [Google Scholar]
- 21.Skvortsova I, Skvortsov S, Raju U, Stasyk T, Riesterer O, Schottdorf EM, Popper BA, Schiestl B, Eichberger P, Debbage P, Neher A, Bonn GK, Huber LA, Milas L, Lukas P. Epithelial-to-mesenchymal transition and cmyc expression are the determinants of cetuximab-induced enhancement of squamous cell carcinoma radioresponse. Radiother Oncol. 2010;96:108–115. doi: 10.1016/j.radonc.2010.04.017. [DOI] [PubMed] [Google Scholar]
- 22.Frederick BA, Helfrich BA, Coldren CD, Zheng D, Chan D, Bunn PA Jr, Raben D. Epithelial to mesenchymal transition predicts gefitinib resistance in cell lines of head and neck squamous cell carcinoma and non-small cell lung carcinoma. Mol Cancer Ther. 2007;6:1683–1691. doi: 10.1158/1535-7163.MCT-07-0138. [DOI] [PubMed] [Google Scholar]
- 23.Holz C, Niehr F, Boyko M, Hristozova T, Distel L, Budach V, Tinhofer I. Epithelialmesenchymal-transition induced by EGFR activation interferes with cell migration and response to irradiation and cetuximab in head and neck cancer cells. Radiother Oncol. 2011;101:158–164. doi: 10.1016/j.radonc.2011.05.042. [DOI] [PubMed] [Google Scholar]
- 24.Ondrey FG, Dong G, Sunwoo J, Chen Z, Wolf JS, Crowl-Bancroft CV, Mukaida N, Van Waes C. Constitutive activation of transcription factors NF-(kappa)B, AP-1, and NF-IL6 in human head and neck squamous cell carcinoma cell lines that express pro-inflammatory and proangiogenic cytokines. Mol Carcinog. 1999;26:119–129. doi: 10.1002/(sici)1098-2744(199910)26:2<119::aid-mc6>3.0.co;2-n. [DOI] [PubMed] [Google Scholar]
- 25.Gyanchandani R, Sano D, Ortega Alves MV, Klein JD, Knapick BA, Oh S, Myers JN, Kim S. Interleukin-8 as a modulator of response to bevacizumab in preclinical models of head and neck squamous cell carcinoma. Oral Oncol. 2013;49:761–770. doi: 10.1016/j.oraloncology.2013.03.452. [DOI] [PubMed] [Google Scholar]
- 26.Itoh Y, Joh T, Tanida S, Sasaki M, Kataoka H, Itoh K, Oshima T, Ogasawara N, Togawa S, Wada T, Kubota H, Mori Y, Ohara H, Nomura T, Higashiyama S, Itoh M. IL-8 promotes cell proliferation and migration through metalloproteinase-cleavage proHB-EGF in human colon carcinoma cells. Cytokine. 2005;29:275–282. doi: 10.1016/j.cyto.2004.11.005. [DOI] [PubMed] [Google Scholar]
- 27.Luppi F, Longo AM, de Boer WI, Rabe KF, Hiemstra PS. Interleukin-8 stimulates cell proliferation in non-small cell lung cancer through epidermal growth factor receptor transactivation. Lung Cancer. 2007;56:25–33. doi: 10.1016/j.lungcan.2006.11.014. [DOI] [PubMed] [Google Scholar]
- 28.Singh RK, Lokeshwar BL. The IL-8-regulated chemokine receptor CXCR7 stimulates EGFR signaling to promote prostate cancer growth. Cancer Res. 2011;71:3268–3277. doi: 10.1158/0008-5472.CAN-10-2769. [DOI] [PMC free article] [PubMed] [Google Scholar]
- 29.Li XJ, Peng LX, Shao JY, Lu WH, Zhang JX, Chen S, Chen ZY, Xiang YQ, Bao YN, Zheng FJ, Zeng MS, Kang TB, Zeng YX, Teh BT, Qian CN. As an independent unfavorable prognostic factor, IL-8 promotes metastasis of nasopharyngeal carcinoma through induction of epithelial-mesenchymal transition and activation of AKT signaling. Carcinogenesis. 2012;33:1302–1309. doi: 10.1093/carcin/bgs181. [DOI] [PMC free article] [PubMed] [Google Scholar]
- 30.Hatakeyama H, Cheng H, Wirth P, Counsell A, Marcrom SR, Wood CB, Pohlmann PR, Gilbert J, Murphy B, Yarbrough WG, Wheeler DL, Harari PM, Guo Y, Shyr Y, Slebos RJ, Chung CH. Regulation of heparin-binding EGF-like growth factor by miR-212 and acquired cetuximab-resistance in head and neck squamous cell carcinoma. PLoS One. 2010;5:e12702. doi: 10.1371/journal.pone.0012702. [DOI] [PMC free article] [PubMed] [Google Scholar]
- 31.Jijon HB, Buret A, Hirota CL, Hollenberg MD, Beck PL. The EGF Receptor and HER2 Participate in TNF-alpha-Dependent MAPK Activation and IL-8 Secretion in Intestinal Epithelial Cells. Mediators Inflamm. 2012;2012:207398. doi: 10.1155/2012/207398. [DOI] [PMC free article] [PubMed] [Google Scholar]
- 32.Bedi A, Chang X, Noonan K, Pham V, Bedi R, Fertig EJ, Considine M, Califano JA, Borrello I, Chung CH, Sidransky D, Ravi R. Inhibition of TGF-beta Enhances the In Vivo Antitumor Efficacy of EGF Receptor-Targeted Therapy. Mol Cancer Ther. 2012;11:2429–2439. doi: 10.1158/1535-7163.MCT-12-0101-T. [DOI] [PMC free article] [PubMed] [Google Scholar]
- 33.Khambata-Ford S, Garrett CR, Meropol NJ, Basik M, Harbison CT, Wu S, Wong TW, Huang X, Takimoto CH, Godwin AK, Tan BR, Krishnamurthi SS, Burris HA 3rd, Poplin EA, Hidalgo M, Baselga J, Clark EA, Mauro DJ. Expression of epiregulin and amphiregulin and K-ras mutation status predict disease control in metastatic colorectal cancer patients treated with cetuximab. J. Clin. Oncol. 2007;25:3230–3237. doi: 10.1200/JCO.2006.10.5437. [DOI] [PubMed] [Google Scholar]
- 34.Tinhofer I, Klinghammer K, Weichert W, Knodler M, Stenzinger A, Gauler T, Budach V, Keilholz U. Expression of amphiregulin and EGFRvIII affect outcome of patients with squamous cell carcinoma of the head and neck receiving cetuximab-docetaxel treatment. Clin Cancer Res. 2011;17:5197–5204. doi: 10.1158/1078-0432.CCR-10-3338. [DOI] [PubMed] [Google Scholar]
- 35.Nanba D, Mammoto A, Hashimoto K, Higashiyama S. Proteolytic release of the carboxy-terminal fragment of proHB-EGF causes nuclear export of PLZF. J Cell Biol. 2003;163:489–502. doi: 10.1083/jcb.200303017. [DOI] [PMC free article] [PubMed] [Google Scholar]
- 36.Kinugasa Y, Hieda M, Hori M, Higashiyama S. The carboxyl-terminal fragment of pro-HBEGF reverses Bcl6-mediated gene repression. J Biol Chem. 2007;282:14797–14806. doi: 10.1074/jbc.M611036200. [DOI] [PubMed] [Google Scholar]
- 37.Nanba D, Inoue H, Shigemi Y, Shirakata Y, Hashimoto K, Higashiyama S. An intermediary role of proHB-EGF shedding in growth factor-induced c-Myc gene expression. J Cell Physiol. 2008;214:465–473. doi: 10.1002/jcp.21233. [DOI] [PubMed] [Google Scholar]
- 38.Nanba D, Higashiyama S. Dual intracellular signaling by proteolytic cleavage of membraneanchored heparin-binding EGF-like growth factor. Cytokine Growth Factor Rev. 2004;15:13–19. doi: 10.1016/j.cytogfr.2003.10.002. [DOI] [PubMed] [Google Scholar]
- 39.Hieda M, Isokane M, Koizumi M, Higashi C, Tachibana T, Shudou M, Taguchi T, Hieda Y, Higashiyama S. Membrane-anchored growth factor, HB-EGF, on the cell surface targeted to the inner nuclear membrane. J Cell Biol. 2008;180:763–769. doi: 10.1083/jcb.200710022. [DOI] [PMC free article] [PubMed] [Google Scholar]
- 40.Byers LA, Diao L, Wang J, Saintigny P, Girard L, Peyton M, Shen L, Fan Y, Giri U, Tumula PK, Nilsson MB, Gudikote J, Tran H, Cardnell RJ, Bearss DJ, Warner SL, Foulks JM, Kanner SB, Gandhi V, Krett N, Rosen ST, Kim ES, Herbst RS, Blumenschein GR, Lee JJ, Lippman SM, Ang KK, Mills GB, Hong WK, Weinstein JN, Wistuba II, Coombes KR, Minna JD, Heymach JV. An epithelial-mesenchymal transition gene signature predicts resistance to EGFR and PI3K inhibitors and identifies Axl as a therapeutic target for overcoming EGFR inhibitor resistance. Clin Cancer Res. 2013;19:279–290. doi: 10.1158/1078-0432.CCR-12-1558. [DOI] [PMC free article] [PubMed] [Google Scholar]
- 41.Haddad Y, Choi W, McConkey DJ. Deltacrystallin enhancer binding factor 1 controls the epithelial to mesenchymal transition phenotype and resistance to the epidermal growth factor receptor inhibitor erlotinib in human head and neck squamous cell carcinoma lines. Clin Cancer Res. 2009;15:532–542. doi: 10.1158/1078-0432.CCR-08-1733. [DOI] [PMC free article] [PubMed] [Google Scholar]
- 42.Thomson S, Buck E, Petti F, Griffin G, Brown E, Ramnarine N, Iwata KK, Gibson N, Haley JD. Epithelial to mesenchymal transition is a determinant of sensitivity of non-small-cell lung carcinoma cell lines and xenografts to epidermal growth factor receptor inhibition. Cancer Res. 2005;65:9455–9462. doi: 10.1158/0008-5472.CAN-05-1058. [DOI] [PubMed] [Google Scholar]
- 43.Yauch RL, Januario T, Eberhard DA, Cavet G, Zhu W, Fu L, Pham TQ, Soriano R, Stinson J, Seshagiri S, Modrusan Z, Lin CY, O’Neill V, Amler LC. Epithelial versus mesenchymal phenotype determines in vitro sensitivity and predicts clinical activity of erlotinib in lung cancer patients. Clin Cancer Res. 2005;11:8686–8698. doi: 10.1158/1078-0432.CCR-05-1492. [DOI] [PubMed] [Google Scholar]
- 44.Buck E, Eyzaguirre A, Barr S, Thompson S, Sennello R, Young D, Iwata KK, Gibson NW, Cagnoni P, Haley JD. Loss of homotypic cell adhesion by epithelial-mesenchymal transition or mutation limits sensitivity to epidermal growth factor receptor inhibition. Mol Cancer Ther. 2007;6:532–541. doi: 10.1158/1535-7163.MCT-06-0462. [DOI] [PubMed] [Google Scholar]
- 45.Cowling VH, Cole MD. E-cadherin repression contributes to c-Myc-induced epithelial cell transformation. Oncogene. 2007;26:3582–3586. doi: 10.1038/sj.onc.1210132. [DOI] [PubMed] [Google Scholar]
- 46.Thiery JP. Epithelial-mesenchymal transitions in development and pathologies. Curr Opin Cell Biol. 2003;15:740–746. doi: 10.1016/j.ceb.2003.10.006. [DOI] [PubMed] [Google Scholar]
- 47.Guarino M. Epithelial-mesenchymal transition and tumour invasion. Int J Biochem Cell Biol. 2007;39:2153–2160. doi: 10.1016/j.biocel.2007.07.011. [DOI] [PubMed] [Google Scholar]
- 48.Basu D, Bewley AF, Sperry SM, Montone KT, Gimotty PA, Rasanen K, Facompre ND, Weinstein GS, Nakagawa H, Diehl JA, Rustgi AK, Herlyn M. EGFR inhibition promotes an aggressive invasion pattern mediated by mesenchymal-like tumor cells within squamous cell carcinomas. Mol Cancer Ther. 2013;12:2176–2186. doi: 10.1158/1535-7163.MCT-12-1210. [DOI] [PMC free article] [PubMed] [Google Scholar]
- 49.Smith JP, Pozzi A, Dhawan P, Singh AB, Harris RC. Soluble HB-EGF induces epithelialto-mesenchymal transition in inner medullary collecting duct cells by upregulating Snail-2. American journal of physiology. Am J Physiol Renal Physiol. 2009;296:F957–965. doi: 10.1152/ajprenal.90490.2008. [DOI] [PMC free article] [PubMed] [Google Scholar]
- 50.Yagi H, Yotsumoto F, Miyamoto S. Heparinbinding epidermal growth factor-like growth factor promotes transcoelomic metastasis in ovarian cancer through epithelial-mesenchymal transition. Mol Cancer Ther. 2008;7:3441–3451. doi: 10.1158/1535-7163.MCT-08-0417. [DOI] [PubMed] [Google Scholar]
- 51.Wang F, Sloss C, Zhang X, Lee SW, Cusack JC. Membrane-bound heparin-binding epidermal growth factor like growth factor regulates E-cadherin expression in pancreatic carcinoma cells. Cancer Res. 2007;67:8486–8493. doi: 10.1158/0008-5472.CAN-07-0498. [DOI] [PubMed] [Google Scholar]
- 52.Fernando RI, Castillo MD, Litzinger M, Hamilton DH, Palena C. IL-8 signaling plays a critical role in the epithelial-mesenchymal transition of human carcinoma cells. Cancer Res. 2011;71:5296–5306. doi: 10.1158/0008-5472.CAN-11-0156. [DOI] [PMC free article] [PubMed] [Google Scholar]
- 53.Hwang WL, Yang MH, Tsai ML, Lan HY, Su SH, Chang SC, Teng HW, Yang SH, Lan YT, Chiou SH, Wang HW. SNAIL regulates interleukin-8 expression, stem cell-like activity, and tumorigenicity of human colorectal carcinoma cells. Gastroenterology. 2011;141:279–291. 291.e1–5. doi: 10.1053/j.gastro.2011.04.008. [DOI] [PubMed] [Google Scholar]
- 54.Shimura T, Yoshida M, Fukuda S, Ebi M, Hirata Y, Mizoshita T, Tanida S, Kataoka H, Kamiya T, Higashiyama S, Joh T. Nuclear translocation of the cytoplasmic domain of HB-EGF induces gastric cancer invasion. BMC Cancer. 2012;12:205. doi: 10.1186/1471-2407-12-205. [DOI] [PMC free article] [PubMed] [Google Scholar]
- 55.Lin Y, Buckhaults PJ, Lee JR, Xiong H, Farrell C, Podolsky RH, Schade RR, Dynan WS. Association of the actin-binding protein transgelin with lymph node metastasis in human colorectal cancer. Neoplasia. 2009;11:864–873. doi: 10.1593/neo.09542. [DOI] [PMC free article] [PubMed] [Google Scholar]
- 56.Jo M, Eastman BM, Webb DL, Stoletov K, Klemke R, Gonias SL. Cell signaling by urokinase-type plasminogen activator receptor induces stem cell-like properties in breast cancer cells. Cancer Res. 2010;70:8948–8958. doi: 10.1158/0008-5472.CAN-10-1936. [DOI] [PMC free article] [PubMed] [Google Scholar]
- 57.Noh H, Hong S, Huang S. Role of urokinase receptor in tumor progression and development. Theranostics. 2013;3:487–495. doi: 10.7150/thno.4218. [DOI] [PMC free article] [PubMed] [Google Scholar]
- 58.Seals DF, Courtneidge SA. The ADAMs family of metalloproteases: multidomain proteins with multiple functions. Genes Dev. 2003;17:7–30. doi: 10.1101/gad.1039703. [DOI] [PubMed] [Google Scholar]
- 59.Qian X, Tuszynski GP. Expression of thrombospondin-1 in cancer: a role in tumor progression. Proc Soc Exp Biol Med. 1996;212:199–207. doi: 10.3181/00379727-212-44008. [DOI] [PubMed] [Google Scholar]
- 60.Vigneswaran N, Wu J, Zacharias W. Upregulation of cystatin M during the progression of oropharyngeal squamous cell carcinoma from primary tumor to metastasis. Oral Oncol. 2003;39:559–568. doi: 10.1016/s1368-8375(03)00038-1. [DOI] [PubMed] [Google Scholar]
- 61.Ishizuka J, Townsend CM Jr, Thompson JC. Neurotensin regulates growth of human pancreatic cancer. Ann Surg. 1993;217:439–445. doi: 10.1097/00000658-199305010-00003. discussion 446. [DOI] [PMC free article] [PubMed] [Google Scholar]
- 62.Maussang D, Mujic-Delic A, Descamps FJ, Stortelers C, Vanlandschoot P, Stigter-van Walsum M, Vischer HF, van Roy M, Vosjan M, Gonzalez-Pajuelo M, van Dongen GA, Merchiers P, van Rompaey P, Smit MJ. Llama-derived single variable domains (nanobodies) directed against chemokine receptor CXCR7 reduce head and neck cancer cell growth in vivo. J Biol Chem. 2013;288:29562–29572. doi: 10.1074/jbc.M113.498436. [DOI] [PMC free article] [PubMed] [Google Scholar]
- 63.Mori S, Chang JT, Andrechek ER, Matsumura N, Baba T, Yao G, Kim JW, Gatza M, Murphy S, Nevins JR. Anchorage-independent cell growth signature identifies tumors with metastatic potential. Oncogene. 2009;28:2796–2805. doi: 10.1038/onc.2009.139. [DOI] [PMC free article] [PubMed] [Google Scholar]
- 64.Guadamillas MC, Cerezo A, Del Pozo MA. Overcoming anoikis--pathways to anchorageindependent growth in cancer. J Cell Sci. 2011;124:3189–3197. doi: 10.1242/jcs.072165. [DOI] [PubMed] [Google Scholar]
- 65.Kang JS, Krauss RS. Ras induces anchorage-independent growth by subverting multiple adhesion-regulated cell cycle events. Mol Cell Biol. 1996;16:3370–3380. doi: 10.1128/mcb.16.7.3370. [DOI] [PMC free article] [PubMed] [Google Scholar]
- 66.Zenz R, Eferl R, Scheinecker C, Redlich K, Smolen J, Schonthaler HB, Kenner L, Tschachler E, Wagner EF. Activator protein 1 (Fos/Jun) functions in inflammatory bone and skin disease. Arthritis Res Ther. 2008;10:201. doi: 10.1186/ar2338. [DOI] [PMC free article] [PubMed] [Google Scholar]
- 67.Swenson WG, Wuertz BR, Ondrey FG. Tobacco carcinogen mediated up-regulation of AP-1 dependent pro-angiogenic cytokines in head and neck carcinogenesis. Mol Carcinog. 2011;50:668–679. doi: 10.1002/mc.20775. [DOI] [PMC free article] [PubMed] [Google Scholar]
- 68.Hommes D, van den Blink B, Plasse T, Bartelsman J, Xu C, Macpherson B, Tytgat G, Peppelenbosch M, Van Deventer S. Inhibition of stress-activated MAP kinases induces clinical improvement in moderate to severe Crohn’s disease. Gastroenterology. 2002;122:7–14. doi: 10.1053/gast.2002.30770. [DOI] [PubMed] [Google Scholar]
- 69.Hollenhorst PC. RAS/ERK pathway transcriptional regulation through ETS/AP-1 binding sites. Small GTPases. 2012;3:154–158. doi: 10.4161/sgtp.19630. [DOI] [PMC free article] [PubMed] [Google Scholar]
- 70.Matthews CP, Colburn NH, Young MR. AP-1 a target for cancer prevention. Curr Cancer Drug Targets. 2007;7:317–324. doi: 10.2174/156800907780809723. [DOI] [PubMed] [Google Scholar]