

Abstract
Hemodynamic stress via hypotensive challenge has been shown previously to cause a corticotropin-releasing factor (CRF)-mediated increase in tonic locus coeruleus (LC) activity and consequent release of norepinephrine (NE) in noradrenergic terminal fields. Although alterations in LC-NE can modulate the responsiveness of signal processing neurons along sensory pathways, little is understood regarding how continuous CRF-mediated activation of LC-NE output due to physiologically relevant stressor affects downstream target cell physiology. The goal of the present study was to investigate the effects of a physiological stressor [hemodynamic stress via sodium nitroprusside (SNP) i.v.] on stimulus evoked responses of sensory processing neurons that receive LC inputs. In rat, the dorsal lateral geniculate nucleus (dLGN) of the thalamus is the primary relay for visual information and is a major target of the LC-NE system. We used extracellular recording techniques in the anesthetized rat monitor single dLGN neuron activity during repeated presentation of light stimuli before and during hemodynamic stress. A significant decrease in magnitude occurred, as well as an increase in latency of dLGN stimulus-evoked responses were observed during hemodynamic stress. In another group of animals the CRF antagonist DpheCRF12–41 was infused onto the ipsilateral LC prior to SNP administration. This infusion blocked the hypotension-induced changes in dLGN stimulus-evoked discharge. These results show that CRF-mediated increases in LC-NE due to hemodynamic stress disrupts the transmission of information along thalamic-sensory pathways by: (1) initially reducing signal transmission during onset of the stressor and (2) decreasing the speed of stimulus evoked sensory transmission.
1. Introduction
The nucleus locus coeruleus (LC), the largest norepinephrine (NE)-containing cell group in the brain, has extensive efferent projections throughout the entire CNS (Grzanna and Molliver, 1980; Swanson and Hartman, 1976). Neurons of the LC display a range of tonic firing rates (1–5 Hz) that are linearly related to NE efflux in regions of the brain that receive LC projections (Berridge and Abercrombie, 1999; Devilbiss et al., 2006). Increasing discharge rates are correlated with increased forebrain EEG activation and increased arousal, with the highest rates of discharge associated w/ distractibility or labile attentiveness (Aston-Jones and Bloom, 1981; Berridge and Foote, 1991; Berridge and Waterhouse 2003). By regulating levels of arousal and altering the responsiveness of single neurons and neural circuits to synaptic inputs (Devilbiss and Waterhouse, 2002, 2004), the LC-NE system modulates the transmission of sensory information within and between noradrenergically-innervated neural networks and across behavioral states (Berridge and Waterhouse, 2003).
Stress may alter sensory-driven responses of cells in LC terminal fields, as a variety of stressors are associated with increased LC-NE output (Curtis et al., 2012; Lechner et al., 1997; Page et al., 1992; Valentino, 1989). Stressor exposure prompts release of the neuropeptide corticotropin-releasing factor (CRF) which activates the LC-NE system (Bale and Vale, 2004; Valentino and Van Bockstaele, 2001) and initiates events associated with the stress response. Such responses can be attenuated by intra-LC administration of CRF-antagonist (Curtis et al., 1993, 1994, 1997, 1999, 2012; Lechner et al., 1997). Increased tonic output from the LC-NE system is associated with scanning attention, a behavioral domain representing an adaptive response to stressors, i.e. serving to facilitate executive functions and sensorimotor responses during stress (Valentino and Van Bockstaele, 2008). CRF-mediated activation of the LC-NE system therefore provides a means through which stress can alter the operation of downstream targets reponsible for sensory signal processing. However, the effects of stress-induced activation of the LC-NE pathway on response properties of individual neurons in primary sensory circuits have not been determined..
One stressor that has been shown to elicit CRF release and increase LC activity is blood volume reduction by hemorrhage (Plotsky and Vale, 1984; Svensson, 1987). A 10–15% reduction in blood volume can be mimicked by a rapid drop in blood pressure induced by hypotensive challenge, e.g. intravenous (i.v.) administration of the vasodilator sodium nitroprusside (SNP) (Valentino, 1989). In the anesthetized rat, infusion of SNP increases the tonic discharge of LC neurons 20–30% from baseline, an effect that is correlated with the magnitude and onset of the induced hypotension (Valentino and Wehby, 1988; Valentino et al., 1991). SNP administration is associated with increased EEG activation (Page et al., 1993) and increased extracellular NE in LC terminal fields, such as the prefrontal cortex (PFC) (Kawahara et al., 1999; Swiergiel et al., 1998). Furthermore, LC activation by hemodynamic stress is blocked when a CRF antagonist is infused locally onto the LC prior to SNP infusion (Curtis et al., 1994; Valentino et al., 1991).
Acute stress is disruptive to sensory information processing in humans (Clark et al., 1986; Ermutlu et al., 2005; Grillon and Davis, 1997; Kilpatrick et al., 2010) and animals (Liu et al., 2011; Miyazato et al., 2000; Sutherland and Conti, 2011). However, the pathway(s) and mechanism(s) through which stressor-induced disruption of sensory processing occurs have not been identified. Although it is well established that hemodynamic stress results in an increase in tonic LC discharge and NE release, it remains unclear how this sequence of events affects the physiology of neurons in noradrenergic terminal fields, particularly those responsible for processing sensory information. The goal of the current study was to connect downstream target cell physiology to stress-induced alterations in LC discharge. To this end, light flash-evoked responses of rat dorsal lateral geniculate nucleus (dLGN) neurons were recorded before and during SNP-induced hypotensive challenge in the anesthetized rat. The results show that hemodynamic stress suppresses visual signal processing in the dLGN via output from the LC.
2. Results
Action potential waveforms were recorded from the dLGN thalamus in 14 anesthetized animals: SNP-treated (n = 8) and CRF-antagonist, DpheCRF12–41, -treated prior to SNP (n = 6). Confirmation of recording electrode and cannula locations in the dLGN (Fig. 1) and LC (Fig. 2), respectively, was conducted post-mortem. All discriminated units were responsive to the light stimulus. A total of 54 cells (27 cells in each animal treatment group) were deemed suitable for subsequent analysis, i.e. well discriminated, reliable single cell recordings - as described in Methods. Multi-neuron waveforms were observed in all animals but excluded from further analysis.
Figure 1.
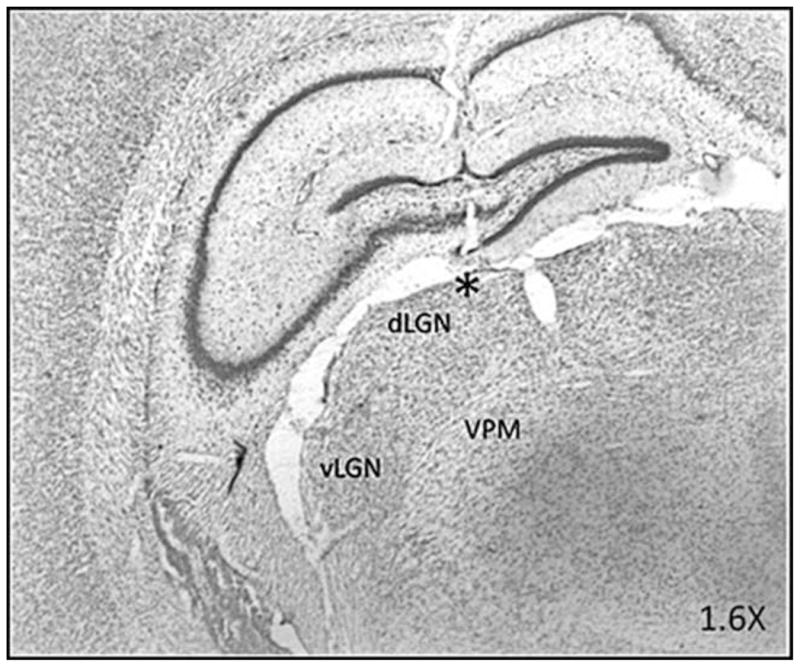
Brightfield photomicrograph of a section through the dLGN showing histological verification of the electrode recording site. The section is counterstained with neutral red. vLGN, ventral lateral geniculate nucleus; VPM, ventral posteriomedial thalamus. * denotes location of microwire bundle protruding from the 26 GA guide cannula.
Figure 2.

A. Brightfield photomicrograph of a section through the LC showing histological verification of the ipsilateral injection site. The section is counterstained with neutral red. 4V, fourth ventricle; cb, cerebellum. B–D: Plots of DpheCRF microinfusion sites. Shown are rat brain atlas representative sections of the LC. “X” represents the location of the individual cannula placements. B. −9.8 bregma, C. −10 bregma, D. −10.3 bregma
2.1 Effects of sodium nitroprusside i.v. on blood pressure
To be confident that the timing and magnitude of the drug-mediated decrease in blood pressure were similar to previous findings, mean arterial pressure was recorded before, during, and after administration of SNP (i.v., 10 μg/30 μL/min) in a separate group of animals (n = 4). This dose/rate of infusion decreased blood pressure significantly below baseline levels 3 minutes after the start of infusion, remaining significantly below baseline (Repeated Measures ANOVA; F = 15.915 (13, 39) = p < .01) for the duration of drug infusion, as observed previously (Curtis et al., 1994; Valentino and Wehby 1988; Valentino 1989; Valentino et al., 1991). Fig. 3 shows the effect of SNP administration on blood pressure for all animals tested in the present study. Blood pressure changes were averaged across all subjects and expressed as percentage baseline (pre-SNP). On average, blood pressure decreased to 68 ± 12% of baseline at 3 mins after SNP infusion with the maximal reduction occurring at 5 minutes after the start of SNP infusion (55 ± 5% of baseline blood pressure rate). For all animals tested blood pressure was reduced to 67 ± 13% of baseline 3–15 min during SNP infusion. The central nucleus of the amygdala is the primary source of CRF that activates the LC during this hypotensive challenge (Curtis et al., 2002); significantly increasing tonic LC output 3 mins after the start of SNP infusion and remaining stably elevated 20–30% above baseline firing until termination of drug administration (Curtis et al., 1994; Valentino and Wehby 1988; Valentino et al., 1991).
Figure 3.

Time course of SNP effects on blood pressure across the population of animals recorded (n = 4). The x-axis represents time before and after SNP infusion. Time of SNP infusion is indicated by the bar (0 to 15 minutes). Each point is mean blood pressure expressed as percentage of the mean pre-SNP blood pressure. Note the significant decrease in blood pressure occurring 3 min during-SNP (p < .05). Blood pressure remains significantly below baseline levels for the duration of drug infusion
2.2 Effects of hemodynamic stress on dLGN neuron responsiveness to light stimulus
The cumulative raster plot and PTSHs in Fig. 4 show responses of a single dLGN unit to light flash before and during hypotensive challenge. Note that suppression of the evoked response occurs 3–6 min after the start of SNP infusion, followed by a return to the control level of stimulus-evoked discharge prior to termination of SNP administration, although blood pressure remains significantly below baseline levels (see Fig. 3). Across all cells recorded from animals receiving SNP infusions, the magnitude of dLGN light-stimulus evoked response was reduced to 54 ± 13% of baseline at 3–6 min after the start of SNP infusion and returned to 107 ± 17% of baseline at 12–15 min after the start of SNP infusion. Although the majority of cells recorded were suppressed 3–6 min after the start of SNP infusion (21/27: 78%), the responses of a small sub-group of cells were increased (4/27: 15%) or unchanged (2/17: 7%) during hypotensive challenge (Table 1).
Figure 4.
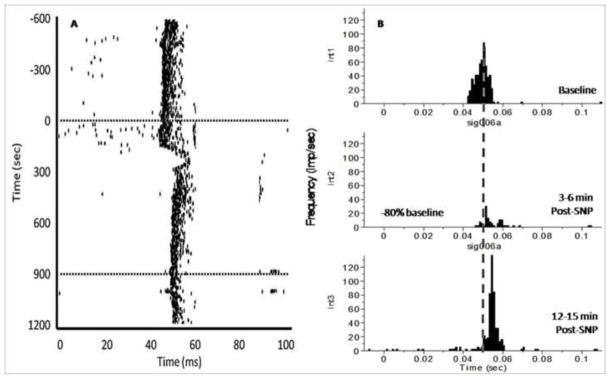
An example of the effects hemodynamic stress has on the responsiveness of a dLGN neuron to light stimuli. X-axis time zero represents onset of stimulus (light flash). The light was presented 1/500 ms (twice per second) for 20 ms duration. Note the marked decrease in evoked dLGN discharges 3–6 min post-drug, coinciding with a significant decrease in blood pressure. Also note the increase in response latency during hypotensive challenge. A. Cumulative raster plot illustrating the stimulus evoked discharges from a single dLGN thalamic neuron before, during, and after hypotensive challenge via i.v. SNP administration. The y-axis represents recording time. Dotted lines denote onset and termination of SNP-drug infusion. B. Peri-stimulus time histograms (PSTHs) illustrating the light evoked discharge of a single dLGN neuron before drug (int1), 3–6 min SNP (int2), and 12–15 min SNP (int3). These intervals were chosen as a representative of the effect of hemodynamic stress on dLGN activity. The x-axis represents time (ms). The y-axis represents the magnitude of evoked responses, based on frequency of dLGN firing (impulses/sec). The vertical dotted line represents the mean peak response latency at baseline.
Table 1.
Summary of hemodynamic stress effects on responsiveness of dLGN neurons
Summary of the individual effects of hemodynamic stress on single cell responses to light stimuli. dLGN cell responses were categorized according to the nature of the neuromodulatory effects observed during hemodynamic stress when compared to baseline. Facilitation or suppression in magnitude and increase or decrease in latency was declared if each single cell increased or decreased 1 SEM of avg. baseline magnitude/latency during hypotensive challenge.
| Response | # of Cells | % Total | Avg Change From Baseline |
|---|---|---|---|
| Magnitude: | −46 ± 14%a | ||
| Suppression | 21 | −78% | −54 ± 11% |
| Facilitation | 4 | −15% | +19 ± 64% |
| No effect | 2 | −7% | 0% |
| Latency: | +3 ± 1 msb | ||
| Increase | 16 | −59% | +7 ± 1 ms |
| Decrease | 9 | −33% | −4 ± 3 ms |
| No change | 2 | −7% | 0% |
Average change in the magnitude of response 3–6 min post-SNP vs. baseline across all cells recorded
Average change in response latency 12–15 min post-SNP vs. baseline across all cells recorded
Changes in the latency of dLGN evoked responses were also observed over the course of hypotensive challenge. For all SNP treated animals, the peak latency of the primary stimulus evoked response increased during hypotensive challenge (average: +3 ms from baseline). Fig. 4A shows a cumulative raster record for a representative neuron where increased latency to stimulus-evoked discharge was observed over the duration of hemodynamic stress. Together, these results show that hemodynamic stress suppresses the magnitude and increases the latency of thalamic neuron responses to afferent sensory input. While the majority of cells recorded displayed an increase in the latency of stimulus evoked discharge (16/27: 59%), the latency to response in a sub-set of cells was decreased (9/27: 33%) or unchanged (2/17: 7%) during SNP infusion (Table 1).
2.3 Effects of pre-treatment with CRF antagonist on dLGN neuron responsiveness to light stimulus
The effect of hypotensive challenge on dLGN neuron responses to visual input was prevented in animals pretreated with a direct infusion of the CRF antagonist, DpheCRF12–41 onto the LC ipsilateral to the dLGN recording site. Based on our previous findings, we anticipated that hemodynamic stress would result in a suppression of visual stimulus evoked discharges in the majority of dLGN cells 3–6 min after the start of SNP infusion. However, across all cells recorded among animals pretreated with DpheCRF12–41, 70% of cells showed no significant change in the magnitude of response during SNP administration vs. baseline. In the case illustrated in Fig. 5 both the latency (Fig. 5A) and magnitude (Fig. 5B) of light-stimulus evoked discharge were unchanged following SNP administration, when compared to baseline.
Figure 5.
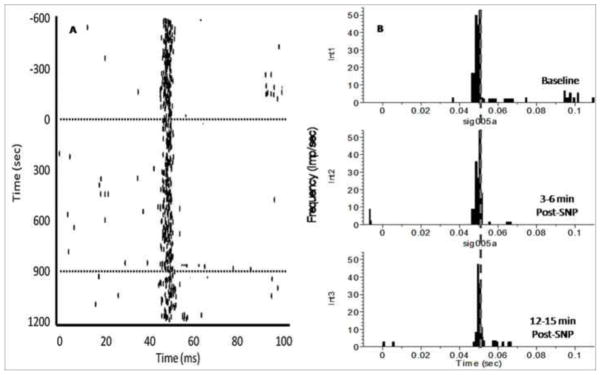
An example of the response of a single dLGN neuron to light stimuli in animals pre-treated with an ipsilateral intra-LC infusion of CRF-antagonist, DpheCRF, prior to hemodynamic stress. X-axis time zero represents onset of stimulus (light flash). The light was presented 1/500 ms (twice per second) for 20 ms duration. Note that the latency and magnitude of response to the light stimulus remains unchanged despite hypotensive challenge. These results provide evidence that any changes observed in dLGN responsiveness during hemodynamic stress is due to a CRF-mediated activation of the LC. A. Cumulative raster plot illustrating the stimulus evoked discharges from a single dLGN thalamic neuron before, during, and after hypotensive challenge via i.v. SNP administration. Dotted lines denote onset and termination of SNP-drug infusion. B. Peri-stimulus time histograms (PSTHs) illustrate the effect of hemodynamic stress on visually evoked dLGN thalamic in animals pretreated with CRF-antagonist. Stimulus-evoked discharge of a single dLGN neuron before drug (int1), 3–6 min SNP (int2), and 12–15 min SNP (int3). The x-axis represents time (ms). The y-axis represents the magnitude of evoked responses, based on frequency of dLGN firing (impulses/sec).
2.4 Treatment and time dependent effects of hemodynamic stress on dLGN neuron responsiveness to light stimuli
Using 2-way repeated measures ANOVAs, the effects of treatment (animals solely administered SNP vs. those DpheCRF treated prior to SNP) and time (pre-drug baseline vs. 3–6 min during-SNP, and 12–15 min during-SNP) on the magnitude and latency of dLGN evoked responses during hemodynamic stress were analyzed. Magnitude showed a significant difference in time (F (2, 51) = 9.846, p < .01) and treatment group (F (2, 52) = 4.252, p < .05), but not for time*treatment interaction (F (2, 51) = 4.252, p < .01). Latency of dLGN evoked responses during hemodynamic stress showed a significant difference in time (F (2, 51) = 5.33, p < .01) and treatment (F (2, 51) = 5.224, p < .05), but not for time*treatment interaction (F (2, 51) = 1.064, p > .05). A subsequent analysis examined the effects of time within each treatment group separately.
Figure 6A shows the effect of hemodynamic stress on the magnitude of dLGN stimulus evoked responses versus baseline. Among animals solely administered SNP, a repeated measures ANOVA demonstrated a significant effect over time in the mean magnitude of light evoked discharges in the dLGN, i.e. 3–6 and 12–15 min after the start of SNP infusion vs. baseline (F (2, 52) = 4.838, p < .05). Post hoc tests confirmed that the decrease in magnitude of evoked responses observed 3–6 min after the start of SNP infusion (25.27 ± 4.83) vs. both baseline (37.11 ± 6.33) and the interval 12–15 min after the start of SNP infusion (39.71 ± 6.38) was significant (p < .05 and .01, respectively), Fig. 6A. There was no significant change in the duration of the primary stimulus evoked response 3–6 or 12–15 min after the start of SNP infusion vs. baseline (F (2, 52) = 1.727, p > .05). There was no significant difference between baseline and 12–15 min after the start of SNP infusion (p > .05). Among animals pretreated with DpheCRF, a repeated measures ANOVA determined that the mean magnitude of light evoked dLGN responses was not significantly different at any time interval examined [baseline vs. 3–6 min after the start of SNP infusion vs. 12–15 min after the start of SNP infusion (F (2, 52) = 4.175, p > .05)] in CRF-antagonist pretreated animals (Fig. 6A).
Figure 6.
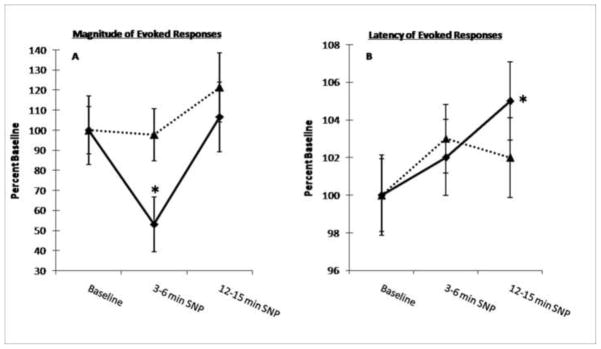
Summary of the effects of hemodynamic stress on magnitude and latency of light evoked dLGN responses. All data are expressed as percentage of mean control (pre-SNP) discharge rate. The time segments represented on the x-axis were chosen to illustrate the primary effect of hemodynamic stress on dLGN responsiveness to the light stimulus. Each point is the mean of all cells recorded among animals solely administered SNP (solid line: 27 cells, n = 8) or DpheCRF-pretreated animals + SNP (dotted line: 27 cells, n = 6). Vertical lines indicate ± 1 SEM. Note that both effects on the magnitude and latency of dLGN responses not evident among cells recorded in animals pretreated with the CRF antagonist, DpheCRF. A. The effect of hemodynamic stress on the magnitude of light-evoked dLGN neuronal responses. Note the marked decrease in magnitude of dLGN evoked activity 3–6 min during-SNP, returning to within baseline 12–15 min during-SNP, despite continuous infusion of drug and significantly low blood pressure. B. The effect of hemodynamic stress on the latency of light-evoked dLGN neuronal responses. Note the increase in response latency throughout the duration of hemodynamic stress, becoming significant 12–15 min during-SNP. Magnitude data were analyzed using repeated measures ANOVA w/ Bonferroni corrections for individual comparisons with pretreatment values (* p < .05). Latency data were analyzed using paired samples t-test for individual comparisons with pretreatment values (* p < .05).
Figure 6B shows the effect of hemodynamic stress on the latency of dLGN stimulus evoked responses versus baseline. Among animals not pretreated with CRF antagonist, a repeated measures ANOVA demonstrated a significant effect over time in the mean peak latency of these light evoked dLGN responses, i.e. 3–6 and 12–15 min after the start of SNP infusion vs. baseline (F (2, 52) = 5.137, p < .05). Post hoc tests confirmed that the increase in latency of evoked responses observed 12–15 min after the start of SNP infusion (47 ± 1) vs. baseline (44 ± 1) was significant (p < .05), Fig. 6B. There was no significant difference between baseline vs. 3–6 min after the start of SNP infusion (45 ± 1) or 3–6 vs. 12–15 min after the start of SNP infusion (p > .05, respectively). There was no significant change in onset latency of the primary stimulus evoked responses at 3–6 or 12–15 min after the start of SNP infusion vs. baseline (F (2, 52) = 2.105, p > .05). Among animals pretreated with DpheCRF, a repeated measures ANOVA demonstrated no significant effect over time in the mean peak latency of these light evoked dLGN responses, i.e. 3–6 and 12–15 min after the start of SNP infusion vs. baseline (F (2, 52) = 5.137, p < .05) among animals pretreated with DpheCRF (Fig. 6B).
3. Discussion
Our results show that CRF-mediated activation of the LC-NE system via hemodynamic challenge modulates the magnitude and timing of stimulus evoked discharges within thalamic sensory circuits in the anesthetized rat. Specifically, hemodynamic stress causes an initial suppression of dLGN stimulus evoked discharge and a slight reduction in the speed of transmission of these signals through the thalamic visual circuitry. Furthermore, these effects were blocked in animals pretreated with CRF antagonist, directly administered to the ipsilateral LC prior to SNP administration – demonstrating that these modulatory effects are dependent upon stress-induced CRF activation of the LC-NE system. Together, these data suggest that during exposure to an internal physiological stressor, such as hypotensive challenge, activation of the LC-NE system disrupts and delays the transmission of sensory information through primary sensory thalamic circuits. These effects likely contribute to impairments in sensory signal processing during stressor exposure.
3.1 Technical considerations
To date, no studies have employed a physiological stressor to activate the LC while characterizing the response properties of downstream sensory neurons. Previous investigations in anesthetized rat have shown that dLGN neuron responsiveness can be enhanced during and immediately following periods of LC activation. These studies relied on electrical stimulation of LC at high frequencies, e.g. 10 Hz (Rogawski and Aghajanian, 1980, 1982) and 200 Hz (Kayama et al., 1982; Kayama, 1985). These stimulus rates greatly exceed normal tonic LC discharge rates (1–5 Hz). Moreover, the periods of activation were brief (< 1 min) and episodic, unlike the stressor-induced activation of LC employed here (~12 mins). Work from our own laboratory has shown that LC activation can increase NE release in the thalamus and enhance VPM thalamic neuron responsiveness (decreased response latency and increased signal to noise ratio) to whisker pad stimulation (Devilbiss and Waterhouse, 2004; Devilbiss et al., 2006). These studies used low frequency tonic or high frequency phasic electrical stimulation of the LC in the waking animal to generate output from the LC-NE system, thus the mode of LC activation and subsequent NE release was different from that employed in the current studies, i.e. persistent CRF-induced elevation of tonic LC output. More recently however, Devilbiss et al. (2012) showed that intra-LC administration of CRF (300 ng) suppressed sensory evoked responses among ventral posteromedial (VPM) thalamic neurons 0–30 min post-CRF. These results are consistent with those found in the current study, i.e. CRF-mediated activation of the LC-NE system suppresses downstream target thalamic neuronal responses to sensory stimuli.
In vivo voltammetry and microdialysis studies have reported differences in both the degree and timing of NE release in terminal fields following hypotensive challenge via SNP administration, unilateral electrical activation of the LC, intra-LC CRF, and intracerebroventricular (ICV) CRF administration (Berridge and Abercrombie, 1999; Kawahara et al., 1999; Palamarchouk et al., 2000; Swiergiel et al., 1998; Zhang et al., 1998). Most notably, Swiergiel et al. (1998), using in vivo voltammetry, showed that i.v. administration of SNP causes a large increase in extracellular NE in the medial prefrontal cortex (a primary target of the LC-NE efferent system) during (2–8 min post-infusion) hemodynamic stress. This initial increase diminishes progressively until termination of hypotensive challenge. These changes in terminal field extracellular concentrations of NE coincides with a significant increase in tonic LC activity that occurs 3 min after the start of SNP infusion (Curtis et al., 1993; 1994; 2001; Valentino et al., 1991). Together, we believe the mode of LC activation and subsequent time course of NE release in downstream targets (specifically, the abrupt and rapid efflux of NE during onset of the hemodynamic challenge) likely accounts for differences in the noradrenergic modulatory effects observed in the current study - where the effects are generally suppressive, versus earlier reports where they are typically facilitative.
As described above, we believe the initial increase in LC output that occurs as a result of stressor exposure causes an immediate and large increase in NE release, resulting in suppression of dLGN thalamic neurons to sensory stimuli 3–6 mins after the start of SNP infusion. However, we cannot account for latency changes that occur over a different time interval, i.e. 12–15 min post-SNP. Prior studies examining the effect of tonic LC activation on downstream sensory neuron responsiveness rely on brief on/off periods of electrical activation of the LC (Devilbiss and Waterhouse, 2004; Devilbiss et al., 2006). The current study measures sensory evoked discharge during uninterrupted, prolonged activation of the LC-NE system via continued exposure to an internal physiological stressor. It remains possible that extended tonic activation of the LC (i.e. ~15 minutes) may alter terminal release of NE or result in transient sensitization of postsynaptic adrenergic receptors, therefore explaining why response magnitude returned to baseline toward the end of drug administration, while latency was not significantly altered until 12 minutes after the start of hypotensive challenge and 9 minutes after observed increases in tonic LC discharge. As revealed in the current study, two measures of neuronal response, magnitude and latency of evoked discharge, were altered over the time course of continued LC activation, albeit differentially. Further studies are needed to assess moment to moment changes in NE release and target cell responsiveness during prolonged periods of LC activation as would occur under conditions that mimic naturalistic stressor exposure.
It is important to note that while the majority of cells recorded in the present study were modulated in the same way (i.e. suppressed magnitude and increased latency of stimulus evoked discharge at 3–6 min after the start of SNP infusion), there was a population of thalamic neurons whose responses to light stimuli were either facilitated and/or exhibited a decrease in response latency (Table 1). dLGN neurons were examined on a cell by cell basis to see if there was any relationship between hypotensive stressor-induced change in response magnitude and latency. Cells (n=2) that showed no significant change in response magnitude during-SNP vs. baseline also showed no change in latency. Among dLGN neurons whose responses were facilitated during hemodynamic stress, half (n=2) exhibited a decrease in response latency while the other half (n=2) exhibited an increase in latency. The majority of cells (n=14, 67%) whose responses were suppressed during hypotensive challenge also exhibited an increase in response latency, while 33% (7 neurons) exhibited a decreased latency. This heterogeneous pattern of response modulation is typical of the effects of LC output on the response properties of sensory neurons. Prior studies have shown that LC activation or local NE application can either enhance or suppress responses of individual neurons to sensory input (Devilbiss and Waterhouse, 2004; Foote et al., 1975; Manunta and Edeline, 1997). Such mixed effects have also been observed in thalamic neurons recorded simultaneously in multi-channel, multi-neuron recording studies (Devilbiss and Waterhouse, 2002; Devilbiss et al., 2006). Therefore, we find the differential modulation of single cell response properties, as observed in the current experiments, to be consistent with the literature regarding LC-NE modulatory effects in sensory circuits.
To be confident that alterations in dLGN responsiveness to light stimuli were due to noradrenergic influences from the LC; we were able to block the effects of SNP hypotensive challenge on dLGN neurons by applying the CRF antagonist DpheCRF12–41 directly onto the ipsilateral LC. There was no topographic relationship between cannula placement and observed effects (Fig. 2B–D). Thus, we cannot attribute the observed effects to a particular area of LC or peri-coerulear region. While the majority of the LC innervation of dLGN is ipsilateral, passing through the dorsal noradrenergic bundle, there is some contribution from the contralateral LC (Kromer and Moore, 1980). Because we observed a complete blockade of the effects of SNP-induced hemodynamic stress on dLGN response to light stimulus with ipsilateral infusions of antagonist we did not to test the effects of contralateral or bilateral antagonist infusion.
Although output from the LC-NE pathway is known to alter the responsiveness of dLGN neurons to synaptic stimuli, other neurotransmitters have also been implicated in modulating neuronal activity in this nucleus, including: dopamine (Albrecht et al., 1996), serotonin (Kemp et al., 1992), and acetylcholine (Kemp et al., 1983). However, dopaminergic innervation of the rat dLGN is sparse, if not non-existent (Garcia-Cabezas et al., 2009). Serotonin-containing axons from the dorsal raphe nucleus (DRN) project to and modulate activity within the dLGN (Pasquier and Villar, 1982). Although central serotonergic neurons have been implicated in cardiovascular function (Antonaccio 1984; Kuhn et al., 1980), the discharge of serotonin-containing cells in the DRN is not altered significantly in response to hemodynamic stress caused by SNP administration (Echizenn and Freed, 1984; Fornal et al., 1990). Therefore, it seems unlikely that the present results depend on serotonergic DRN-dLGN projections. Cholinergic innervation of the thalamus arrives from the pedunculopontine nucleus (PPN) and laterodorsal tegmental (LDT) nucleus of the brainstem (Hallanger et al., 1990; Woolf and Butcher, 1986). There is no evidence to suggest that these brainstem regions are activated and release acetylcholine in downstream targets during whole animal exposure to an internal physiological stressor such as hypotensive challenge. Because the effects of hemodynamic challenge on dLGN neuronal responsiveness to light stimuli were blocked following the direct infusion of a CRF antagonist in the LC, we remain confident that those alterations were due to stressor-induced activation of the LC-NE pathway.
3.2 Functional relevance
The current study investigated how a physiological stressor alters sensory signal processing in downstream LC-NE targets. Although only one stressor that activates the CRF-LC axis was tested, the results may be generalizable to other stressors that are known to produce a CRF-mediated increase in tonic LC output, including: predator odor exposure, and colonic or bladder distention (Curtis et al., 1993, 2012; Lechner et al., 1997; Page et al., 1992). Previous studies have shown that increased LC output or direct application of NE to single cells along sensory pathways facilitates neuronal responsiveness to excitatory and inhibitory synaptic inputs according to an inverted-U dose response function (Devilbiss and Waterhouse, 2002, 2004; Devilbiss et al., 2006). Optimal levels of NE or LC activation produce peak responses in sensory thalamic and cortical neurons to afferent inputs whereas higher than optimal levels begin to suppress evoked discharges of recorded neurons, eventually to the point of non-responding. In theory (Aston-Jones and Cohen, 2005) such an inverted-U dose response relationship provides for broadly tuned neuronal responding across a range of behavioral circumstances; i.e. optimal responding during focused attention to salient stimuli, and more subdued responding during adaptive responses to changing environmental conditions or internal physiological cues. The stressor-induced, CRF mediated suppression of sensory signal transmission observed here may be one outcome of this inverted-U relationship.
It is important to note that prior studies identifying the “optimal” degree of LC activation (50–60%) for facilitating responsiveness of target neurons to sensory synaptic inputs relied on unilateral electrical stimulation of the LC (Devilbiss and Waterhouse, 2004; Devilbiss et al., 2006). Hemodynamic stress via hypotensive challenge causes a more moderate (20–30%) bilateral activation of the LC (Page et al., 1993). Thus, it is difficult to directly compare the outcomes of previous LC activation studies and the current work. For example, exposure to a physiological stressor causes bilateral activation of the LC and the dLGN receives bilateral innervation from the LC (Simpson et al., 1997). Furthermore, exposure to a physiologically stressor most likely activates neurons of the LC uniformly, as opposed to electrical stimulation – which may activate a sub-region of LC or sub-population of noradrenergic cells. Together, these differences in the mode of activating the LC-NE pathway likely influences NE release and extracellular neurotransmitter levels which in turn dictate the nature of the modulatory actions observed in downstream targets.
Stressor induced activation of the LC-NE pathway by CRF may be maladaptive insofar as it yields impaired sensory processing during hemodynamic challenge. Injury can result in blood loss, and activation of the stress axis (Plotsky and Vale, 1984). The hypotensive challenge used in the present study mimics a hemorrhagic event where 10–15% blood volume is lost (Plotsky and Vale, 1984; Svensson, 1987; Valentino, 1989). While this amount of blood loss is not life threatening, it does represent a significant physiological event; one that is commonly experienced on the battlefield by combat soldiers (Eastridge et al., 2011; Kelly et al., 2008; White et al., 2011). Therefore, this study provides insight into how blood loss due to injury can impair signal processing at primary sensory relay nuclei, specifically how exposure to this type of stressor alters visual signal processing among thalamic neurons.
Acute stress is disruptive to sensory information processing in humans (Clark et al., 1986; Ermutlu et al., 2005; Grillon and Davis, 1997; Kilpatrick et al., 2010; Shackman et al., 2011) and animals (Liu et al., 2011; Miyazato et al., 2000; Sutherland and Conti, 2011). While several studies have tested sensorimotor gating via prepulse inhibition (PPI) (Grillon and Davis, 2005; Kilpatrick et al., 2010; Liu et al., 2012; Sutherland and Conti, 2011), some studies in humans have used visual discrimination tasks, noting that acute stress exposure decreases visual sensitivity (Clark et al., 1986) and disrupts focus on task related cues (Ermutlu et al., 2005; Shackman et al., 2011). The deficits in sensory signal processing observed in the current study were blocked when CRF-mediated activation of the LC was prevented by a local infusion of CRF antagonist, suggesting that problems in sensory signal processing that arise during exposure to a stressor are due to NE release onto target neurons following CRF-mediated activation of the LC. Preventing this activation of the LC-NE system prior to stressor exposure could reverse the detrimental effects of stress conditions on sensory signal processing. Furthermore, LC and CRF dysfunction are implicated in several stress-related disorders (Asnis and Van Praag, 1995; Aston-Jones et al., 1994; Bakshi et al., 2012; Bremner et al., 1996, 1997; Curtis et al., 1999; Dunn and Berridge, 1990), thus accounting for problems in sensory processing among those affected with these disorders.
4. Materials and Methods
4.1 Animals
The subjects, adult male Sprague-Dawley rats (Taconic Farms, Inc.; Hudson, NY) weighing 250–400 g, were housed two to a cage in a temperature and humidity controlled environment with ad libitum food and water. The animal facility was maintained at 21°C with a 12/12-hr light/dark cycle with the light period beginning at 7:00 am. All procedures were conducted in accordance with the NIH Guide for Care and Use of Laboratory Animals. All protocols were approved by the Drexel University College of Medicine Intuitional Animal Care and Use Committee.
4.2 Experimental protocol
Animals were allowed to acclimate to the animal facility for at least one week before surgery. The day of surgery, animals were anesthetized with isoflurane (induction at 4%, maintenance at 1–2%). Catheterization of the jugular vein was performed for administration of SNP, using PE 10 tubing filled with 0.9% sterile saline (NaCl) solution. After catheterization was performed, the animal was positioned in a stereotaxic apparatus with the skull flat, and allowed to breathe spontaneously. The body temperature of the animal was monitored using a rectal probe and maintained at 37°C by a heating pad. Anesthesia was maintained throughout the surgery, such that animals were not responsive to foot pinch and the breathing was slow and regular. A burr hole was drilled (−4.8 AP, +4.1 ML) over the dLGN (Paxinos and Watson, 1982) (Fig. 1). A RadioShack© white, clear lens LED light (luminous intensity: 1100mcd, chromaticity coordinates: 660, viewing angle: 100 deg) connected to a Grass Instruments© S44 stimulator (Quincy, Mass.) was placed in front of the contralateral eye to ensure the majority of the retina is illuminated. The light was flashed continuously at twice per second for 20 ms duration. Room lights were turned off and an 8-channel multi-wire (.0015″ formvar insulated nichrome wire, A-M Systems©) recording electrode was then lowered into the brain (−4.0 DV). The electrode’s final location was determined by electrophysiological verification that the recording contained cells characteristic of LGN cell firing during evoked stimulus light flashes. Electrode signals were passed through a high input impedance amplifier (Plexon© MAP system; Dallas, TX) and monitored continuously online through Plexon© Sort Client. Once cells of the dLGN were identified, they were recorded and stored on a disk for subsequent analysis to build peri-stimulus time histograms (PTSHs) and raster records of neuronal activity. Each recording session consisted of a 10 min period of recording of evoked activity pre-drug, followed by a 15 min period of continuous i.v. infusion of SNP (10 μg/30 μL/min). The dose and rate of infusion of drug were chosen based on previous studies showing that this magnitude and duration of hypotensive challenge causes a CRF-mediated increase in tonic LC discharge (20–30%) in the anesthetized rat (Valentino 1989; Valentino et al., 1991).
4.3 Microinfusion of D-PheCRF12–41
In another group of animals, 10 ng of D-PheCRF12–41 in 100 nl of artificial cerebral spinal fluid (aCSF), was administered locally onto the LC ipsilateral to the dLGN recording site (Lambda: AP −10.0 mm, ML +1.2 mm, DV −5.1 mm), using a 31 gauge cannula, 6 mins prior to SNP infusion. Microinfusions of this drug directly onto the LC have been shown previously to prevent CRF-mediated activation of the LC during SNP administration (Curtis et al., 1994). At the conclusion of these experiments, cannula location was marked by a 100 nL infusion of 2% pontamine skye blue dye and examined post-mortem (Fig. 2).
4.4 Histology
Placements of the recording electrode within the dLGN thalamus and infusion cannula within the LC were verified histologically. Animals were perfused with 0.9% saline followed by a 10% formalin solution. After euthanasia, the brains were removed, stored for 48 hrs in phosphate buffer solution containing 20% sucrose, sectioned, and stained with neutral red in order to verify electrode and cannula locations. Only data from animals where drug infusions and unit recording were confirmed in the LC and dLGN, respectively, were included in this analysis.
4.5 Extracellular recording and analysis
Extracellular activity was recorded continuously in the dLGN before, during, and after presentation of the brief light stimulus (described above). Multichannel Acquisition Processor hardware and Real time Acquisition System Programs for Unit Timing In Neuroscience (Plexon, Dallas, TX) were used to amplify, discriminate, and record electrical activity from putative single neurons or “units” of the dLGN. Individual units were discriminated in real time from background activity using a template-matching algorithm. After the experimental session was concluded, the waveforms for each discriminated unit were reexamined with respect to pre-established criteria to verify that individual waveforms originated from a single cell. These off-line criteria included characterization of unit waveform properties and spike train discharge patterns, specifically: peak voltage of the waveform, waveform slopes, scattergram of the waveform’s first two principal components (PCs), spike train auto-correlegram, and interspike interval histogram. The combined on-line discrimination and off-line sorting procedures provide a high level of assurance that recorded waveforms represented continuous spike train activity from individual neurons.
Computer-generated cumulative rasters and Peri-Stimulus Time Histograms (PSTHs) were constructed from the data recorded from each cell in order to characterize and quantify unit responses to light stimuli before and after hypotensive challenge. The spontaneous firing rate, baseline magnitude and latency of light evoked responses of each cell were determined during a 10 minute recording prior to SNP administration. Any baseline activity observed prior to the stimulus evoked discharge was subtracted from the primary stimulus response. Although unit activity was recorded throughout the period following drug administration, drug effects were routinely assessed 3–6 and 12–15 min during SNP administration for all neurons studied, as these time points corresponded with drug-mediated changes in blood pressure and stressor-mediated changes in LC-NE output (Kawahara et al., 1999; Swiergiel et al., 1998; Valentino and Wehby, 1988; Valentino, 1989; Valentino et al., 1991). Onset of the stimulus evoked response was identified as the first of two consecutive bins in the PSTH (bin size = 1 ms) with firing frequencies one standard deviation above baseline firing rate. Offset of the response was declared when firing rate fell below one standard deviation above the initial baseline firing rate for two consecutive bins in the PSTH. The primary stimulus evoked response was then identified as the height of the tallest bin between this onset and offset. Changes in the magnitude and timing of light evoked discharges were quantified by comparing discharge rates and onset/offset times for equivalent histograms generated for each neuron. The following values were calculated from PSTH’s in order to characterize the effect of hemodynamic stress on stimulus evoked discharge of individual dLGN neurons: (1) the peak amplitude (impulses/sec) of the primary stimulus-evoked discharge, (2) the duration of the stimulus evoked discharge (time between onset and offset of the response), (3) the mean latency of the peak response (ms), and (4) the onset latency of the primary stimulus response (ms) before and after SNP infusion.
All statistical tests were conducted using SPSS (version 19). Initially, data were analyzed using a two-way repeated measures ANOVA (time as a repeated factor and treatment as a fixed factor). Subsequently, drug-mediated changes in magnitude, duration, peak latency, and onset latency of stimulus evoked responses were compared to baseline using a one-way repeated measures analysis of variance (ANOVA). Bonferroni-corrected follow up paired t-tests were made to compare individual time segments to baseline values. In animals pretreated with CRF antagonist prior to hypotensive challenge, the same methodology and statistical analysis were used in order to determine significance in characterizing the effect of hemodynamic stress on the magnitude and latency of stimulus evoked discharges among single dLGN thalamic neurons before and after SNP infusion.
In addition to the analysis described above, in which all cells in each treatment group were analyzed together, differences in the magnitude of evoked response were examined individually for each single cell 3–6 min. This analysis was conducted in order to observe any possible variation in modulatory effects hemodynamic stress may have among subpopulations of dLGN neurons. For each cell, the SEM of response magnitude was calculated from the pre-drug baseline firing frequency. The response of each cell was then compared 3–6 min after the start of SNP infusion to observe if the magnitude was within, one SEM of this baseline value. Cells were deemed “facilitated,” “suppressed,” or “unchanged” – based on whether the magnitude had increase above, decreased below, or stayed within the baseline ± one SEM 3–6 min during-SNP, respectively. The same analysis was conducted for latency of dLGN evoked response 12–15 min during-SNP vs. baseline.
In a separate population of animals (n = 4), the mean arterial pressure was recorded min-to-min before, during, and following SNP infusion by a digital display blood pressure transducer (BP1, WPI©) connected to a catheter in the femoral artery, using PE 100 tubing filled with 0.9% sterile NaCl solution. These data were combined with statistical significance determined using one-way repeated measures ANOVA with Bonferroni post-hoc for individual comparisons to baseline (pre-SNP infusion) values.
4.6 Drugs
Sodium nitroprusside (Sigma-Aldrich Co., St. Louis, MO) was dissolved in saline on the day of the experiment. D-PheCRF12–41 was supplied by Tocris Bioscience© with permission of The SALK Institute (San Diego, CA).
Highlights.
We examined how hemodynamic stress alters sensory processing in rodent thalamus.
dLGN single unit responses to light stimuli were recorded in the anesthetized rat.
A decrease in the magnitude and increase in latency of response were observed.
Stressor-induced changes were blocked in animals pretreated with CRF-antagonist.
CRF-mediated activation of LC-NE suppresses thalamic sensory transmission.
Acknowledgments
Supported by the National Institute on Drug Abuse (NIDA DA017960) to BDW.
Abbreviations
- LC
Locus Coeruleus
- dLGN
dorsal Lateral Geniculate Nucleus
- CRF
corticotropin releasing factor
- NE
norepinephrine
- SNP
sodium nitroprusside
Footnotes
Publisher's Disclaimer: This is a PDF file of an unedited manuscript that has been accepted for publication. As a service to our customers we are providing this early version of the manuscript. The manuscript will undergo copyediting, typesetting, and review of the resulting proof before it is published in its final citable form. Please note that during the production process errors may be discovered which could affect the content, and all legal disclaimers that apply to the journal pertain.
References
- Albrecht D, Quäschling U, Zippel U, Davidowa H. Effects of dopamine on neurons of the lateral geniculate nucleus: an iontophoretic study. Synapse. 1996;23(2):70–8. doi: 10.1002/(SICI)1098-2396(199606)23:2<70::AID-SYN2>3.0.CO;2-D. [DOI] [PubMed] [Google Scholar]
- Asnis GM, Van Praag HM. The norepinephrine systm in panic disorder. In: Asnis GM, Van Praag HM, editors. Panic Disorder. New York: Wiley Interscience; 1995. pp. 119–150. [Google Scholar]
- Antonaccio MJ. Considerations for developing an antiarrhythmic agent: a perspective from the pharmaceutical industry. Can J Cardiol. 1994;10(3):325–6. [PubMed] [Google Scholar]
- Aston-Jones G, Segal M, Bloom FE. Brain aminergic axons exhibit marked variability in conduction velocity. Brain Res. 1980;195(1):215–22. doi: 10.1016/0006-8993(80)90880-x. [DOI] [PubMed] [Google Scholar]
- Aston-Jones G, Bloom FE. Activity of norepinephrine-containing locus coeruleus neurons in behaving rats anticipates fluctuations in the sleep-waking cycle. J Neurosci. 1981;1(8):876–86. doi: 10.1523/JNEUROSCI.01-08-00876.1981. [DOI] [PMC free article] [PubMed] [Google Scholar]
- Aston-Jones G, Valentino RJ, Van Bockstaele EJ, Meyerson AT. Locus coeruleus, stress, and PTSD: Neurobiological and clinical parallels. In: Murburg MM, editor. Catecholamine Function in PTSD: Emerging Concepts. Vol. 42. Washington, DC: American Psychiatric Press; 1994. pp. 17–62. [Google Scholar]
- Aston-Jones G, Rajkowski J, Cohen J. Role of locus coeruleus in attention and behavioral flexibility. Biol Psychiatry. 1999;46(9):1309–20. doi: 10.1016/s0006-3223(99)00140-7. [DOI] [PubMed] [Google Scholar]
- Aston-Jones G, Cohen JD. An integrative theory of locus coeruleus-norepinephrine function: adaptive gain and optimal performance. Annu Rev Neurosci. 2005;28:403–50. doi: 10.1146/annurev.neuro.28.061604.135709. [DOI] [PubMed] [Google Scholar]
- Bale TL, Vale WW. CRF and CRF receptors: role in stress responsivity and other behaviors. Annu Rev Pharmacol Toxicol. 2004;44:525–57. doi: 10.1146/annurev.pharmtox.44.101802.121410. [DOI] [PubMed] [Google Scholar]
- Bakshi VP, Alsene KM, Roseboom PH, Connors EE. Enduring sensorimotor gating abnormalities following predator exposure or corticotropin-releasing factor in rats: a model for PTSD-like information-processing deficits? Neuropharmacology. 2012;62(2):737–48. doi: 10.1016/j.neuropharm.2011.01.040. [DOI] [PMC free article] [PubMed] [Google Scholar]
- Berridge CW, Foote SL. Effects of locus coeruleus activation on electroencephalographic activity in neocortex and hippocampus. J Neurosci. 1991;11(10):3135–45. doi: 10.1523/JNEUROSCI.11-10-03135.1991. [DOI] [PMC free article] [PubMed] [Google Scholar]
- Berridge CW, Abercrombie ED. Relationship between locus coeruleus discharge rates and rates of norepinephrine release within neocortex as assessed by in vivo microdialysis. Neuroscience. 1999;93(4):1263–70. doi: 10.1016/s0306-4522(99)00276-6. [DOI] [PubMed] [Google Scholar]
- Berridge CW, Waterhouse BD. The locus coeruleus-noradrenergic system: modulation of behavioral state and state-dependent cognitive processes. Brain Res Brain Res Rev. 2003;42(1):33–84. doi: 10.1016/s0165-0173(03)00143-7. [DOI] [PubMed] [Google Scholar]
- Bremner JD, Krystal JH, Southwick SM, Charney DS. Noradrenergic mechanisms in stress and anxiety: II. Clinical studies. Synapse. 1996;23:39–51. doi: 10.1002/(SICI)1098-2396(199605)23:1<39::AID-SYN5>3.0.CO;2-I. [DOI] [PubMed] [Google Scholar]
- Bremner JD, Licinio J, Darnell A, Krystal JH, Owens MJ, Southwick SM, Nemeroff CB, Charney DS. Elevated CSF corticotropin-releasing factor concentrations in posttraumatic stress disorder. Am J Psychiatry. 1997;154(5):624–9. doi: 10.1176/ajp.154.5.624. [DOI] [PMC free article] [PubMed] [Google Scholar]
- Clark WC, Yang JC, Janal MN. Altered pain and visual sensitivity in humans: the effects of acute and chronic stress. Ann N Y Acad Sci. 1986;467:116–29. doi: 10.1111/j.1749-6632.1986.tb14623.x. [DOI] [PubMed] [Google Scholar]
- Curtis AL, Drolet G, Valentino RJ. Hemodynamic stress activates locus coeruleus neurons of unanesthetized rats. Brain Res Bull. 1993;31(6):737–44. doi: 10.1016/0361-9230(93)90150-a. [DOI] [PubMed] [Google Scholar]
- Curtis AL, Grigoradis DE, Page ME, Rivier J, Valentino RJ. Pharmacological comparison of two corticotropin-releasing factor antagonists: In vivo and in vitro studies. J Pharmacol Exp Ther. 1994;268:359–365. [PubMed] [Google Scholar]
- Curtis AL, Lechner SM, Pavcovich LA, Valentino RJ. Activation of the locus coeruleus noradrenergic system by intracoerulear microinfusion of corticotropin-releasing factor: Effects on discharge rate, cortical norepinephrine levels and cortical electroencephalographic activity. J Pharmacol Exp Ther. 1997;281:163–172. [PubMed] [Google Scholar]
- Curtis AL, Pavcovich LA, Valentino RJ. Long-term regulation of locus coeruleus sensitivity to corticotrophin releasing factor by swim stress. J Pharmacol Exp Ther. 1999;289:1211–1219. [PubMed] [Google Scholar]
- Curtis AL, Bello NT, Valentino RJ. Evidence for functional release of endogenous opioids in the locus ceruleus during stress termination. J Neurosci. 2001;21(13):RC152. doi: 10.1523/JNEUROSCI.21-13-j0001.2001. [DOI] [PMC free article] [PubMed] [Google Scholar]
- Curtis AL, Bello NT, Connolly KR, Valentino RJ. Corticotropin-releasing factor neurones of the central nucleus of the amygdala mediate locus coeruleus activation by cardiovascular stress. J Neuroendocrinol. 2002;14(8):667–82. doi: 10.1046/j.1365-2826.2002.00821.x. [DOI] [PubMed] [Google Scholar]
- Curtis AL, Leiser SC, Snyder K, Valentino RJ. Predator stress engages corticotropin-releasing factor and opioid systems to alter the operating mode of locus coeruleus norepinephrine neurons. Neuropharmacology. 2012;62(4):1737–45. doi: 10.1016/j.neuropharm.2011.11.020. [DOI] [PMC free article] [PubMed] [Google Scholar]
- Devilbiss DM, Waterhouse BD. Determination and quantification of pharmacological, physiological, or behavioral manipulations on ensembles of simultaneously recorded neurons in functionally related neural circuits. J Neurosci Methods. 2002;121(2):181–98. doi: 10.1016/s0165-0270(02)00263-7. [DOI] [PubMed] [Google Scholar]
- Devilbiss DM, Waterhouse BD. The effects of tonic locus ceruleus output on sensory-evoked responses of ventral posterior medial thalamic and barrel field cortical neurons in the awake rat. J Neurosci. 2004;24(48):10773–85. doi: 10.1523/JNEUROSCI.1573-04.2004. [DOI] [PMC free article] [PubMed] [Google Scholar]
- Devilbiss DM, Page ME, Waterhouse BD. Locus ceruleus regulates sensory encoding by neurons and networks in waking animals. J Neurosci. 2006;27;26 (39):9860–72. doi: 10.1523/JNEUROSCI.1776-06.2006. [DOI] [PMC free article] [PubMed] [Google Scholar]
- Devilbiss DM, Waterhouse BD, Berridge CW, Valentino R. Corticotropin-releasing factor acting at the locus coeruleus disrupts thalamic and cortical sensory-evoked responses. Neuropsychopharmacology. 2012;(9):2020–30. doi: 10.1038/npp.2012.50. [DOI] [PMC free article] [PubMed] [Google Scholar]
- Dunn AJ, Berridge CW. Physiological and behavioral responses to corticotropin-releasing factor administration: Is CRF a mediator of anxiety or stress responses? Brain Res-Brain Res Rev. 1990;15:71–100. doi: 10.1016/0165-0173(90)90012-d. [DOI] [PubMed] [Google Scholar]
- Eastridge BJ, Hardin M, Cantrell J, Oetjen-Gerdes L, Zubko T, Mallak C, Wade CE, Simmons J, Mace J, Mabry R, Bolenbaucher R, Blackbourne LH. Died of wounds on the battlefield: causation and implications for improving combat casualty care. J Trauma. 2011;71(1 Suppl):S4–8. doi: 10.1097/TA.0b013e318221147b. [DOI] [PubMed] [Google Scholar]
- Echizen H, Freed CR. Measurement of serotonin turnover rate in rat dorsal raphe nucleus by in vivo electrochemistry. J Neurochem. 1984;42(5):1483–6. doi: 10.1111/j.1471-4159.1984.tb02815.x. [DOI] [PubMed] [Google Scholar]
- Ermutlu MN, Karamürsel S, Ugur EH, Senturk L, Gokhan N. Effects of cold stress on early and late stimulus gating. Psychiatry Res. 2005;136(2–3):201–9. doi: 10.1016/j.psychres.2003.03.002. [DOI] [PubMed] [Google Scholar]
- Foote SL, Freedman R, Oliver AP. Effects of putative neurotransmitters on neuronal activity in monkey auditory cortex. Brain Res. 1975;86(2):229–42. doi: 10.1016/0006-8993(75)90699-x. [DOI] [PubMed] [Google Scholar]
- Fornal CA, Litto WJ, Morilak DA, Jacobs BL. Single-unit responses of serotonergic neurons to vasoactive drug administration in behaving cats. Am J Physiol. 1990;259(5 Pt 2):R963–72. doi: 10.1152/ajpregu.1990.259.5.R963. [DOI] [PubMed] [Google Scholar]
- García-Cabezas MA, Martínez-Sánchez P, Sánchez-González MA, Garzón M, Cavada C. Dopamine innervation in the thalamus: monkey versus rat. Cereb Cortex. 2009;(2):424–34. doi: 10.1093/cercor/bhn093. [DOI] [PMC free article] [PubMed] [Google Scholar]
- Grillon C, Davis M. Effects of stress and shock anticipation on prepulse inhibition of the startle reflex. Psychophysiology. 1997;34(5):511–7. doi: 10.1111/j.1469-8986.1997.tb01737.x. [DOI] [PubMed] [Google Scholar]
- Grzanna R, Molliver ME. The locus coeruleus in the rat: An immunocytochemical delineation. Neuroscience. 1980;5:21–40. doi: 10.1016/0306-4522(80)90068-8. [DOI] [PubMed] [Google Scholar]
- Hallanger AE, Price SD, Lee HJ, Steininger TL, Wainer BH. Ultrastructure of cholinergic synaptic terminals in the thalamic anteroventral, ventroposterior, and dorsal lateral geniculate nuclei of the rat. J Comp Neurol. 1990;99(4):482–92. doi: 10.1002/cne.902990408. [DOI] [PubMed] [Google Scholar]
- Kayama Y, Negi T, Sugitani M, Iwama K. Effects of locus coeruleus stimulation on neuronal activities of dorsal lateral geniculate nucleus and perigeniculate reticular nucleus of the rat. Neuroscience. 1982;7:655–666. doi: 10.1016/0306-4522(82)90071-9. [DOI] [PubMed] [Google Scholar]
- Kayama Y. Ascending, descending and local control of neuronal activity in the rat lateral geniculate nucleus. Vision Res. 1985;25(3):339–47. doi: 10.1016/0042-6989(85)90058-6. [DOI] [PubMed] [Google Scholar]
- Kawahara Y, Kawahara H, Westerink BHC. Comparison of effects of hypotension and handling stress on the release of noradrenaline and dopamine in the locus coeruleus and medial prefrontal cortex of the rat. Naunyn-Schmiedeberg’s Arch Pharmacol. 1999;360:42–49. doi: 10.1007/s002109900042. [DOI] [PubMed] [Google Scholar]
- Kelly JF, Ritenour AE, McLaughlin DF, Bagg KA, Apodaca AN, Mallak CT, Pearse L, Lawnick MM, Champion HR, Wade CE, Holcomb JB. Injury severity and causes of death from Operation Iraqi Freedom and Operation Enduring Freedom: 2003–2004 versus 2006. J Trauma. 2008;64(2 Suppl):S21–6. doi: 10.1097/TA.0b013e318160b9fb. discussion S26–7. [DOI] [PubMed] [Google Scholar]
- Kemp JA, Roberts HC, Sillito AM. Further studies on the action of 5-hydroxytryptamine in the dorsal lateral geniculate nucleus of the cat. Brain Res. 1982;246(2):334–7. doi: 10.1016/0006-8993(82)91187-8. [DOI] [PubMed] [Google Scholar]
- Kilpatrick LA, Ornitz E, Ibrahimovic H, Hubbard CS, Rodríguez LV, Mayer EA, Naliboff BD. Gating of sensory information differs in patients with interstitial cystitis/painful bladder syndrome. J Urol. 2010;184(3):958–63. doi: 10.1016/j.juro.2010.04.083. [DOI] [PMC free article] [PubMed] [Google Scholar]
- Kuhn DM, Wolf WA, Lovenberg W. Review of the role of the central serotonergic neuronal system in blood pressure regulation. Hypertension. 1980;(3):243–55. doi: 10.1161/01.hyp.2.3.243. [DOI] [PubMed] [Google Scholar]
- Kromer LF, Moore RY. A study of the organization of the locus coeruleus projections to the lateral geniculate nuclei of the albino rat. Neuroscience. 1980;5:255–271. doi: 10.1016/0306-4522(80)90102-5. [DOI] [PubMed] [Google Scholar]
- Lechner SM, Curtis AL, Brons R, Valentino RJ. Locus coeruleus activation by colon distention: role of corticotropin-releasing factor and excitatory amino acids. Brain Res. 1997;756(1–2):114–24. doi: 10.1016/s0006-8993(97)00116-9. [DOI] [PubMed] [Google Scholar]
- Liu YP, Tung CS, Chuang CH, Lo SM, Ku YC. Tail-pinch stress and REM sleep deprivation differentially affect sensorimotor gating function in modafinil-treated rats. Behav Brain Res. 2011;219(1):98–104. doi: 10.1016/j.bbr.2010.12.012. [DOI] [PubMed] [Google Scholar]
- Manunta Y, Edeline JM. Effects of noradrenaline on frequency tuning of rat auditory cortex neurons. Eur J Neurosci. 1997;9(4):833–47. doi: 10.1111/j.1460-9568.1997.tb01433.x. [DOI] [PubMed] [Google Scholar]
- Mansour AA, Babstock DM, Penney JH, Martin GM, McLean JH, Harley CW. Novel objects in a holeboard probe the role of the locus coeruleus in curiosity: support for two modes of attention in the rat. Behav Neurosci. 2003;117(3):621–31. doi: 10.1037/0735-7044.117.3.621. [DOI] [PubMed] [Google Scholar]
- Miyazato H, Skinner RD, Garcia-Rill E. Locus coeruleus involvement in the effects of immobilization stress on the p13 midlatency auditory evoked potential in the rat. Prog Neuropsychopharmacol Biol Psychiatry. 2000;24(7):1177–201. doi: 10.1016/s0278-5846(00)00127-5. [DOI] [PubMed] [Google Scholar]
- Page ME, Akaoka H, Aston-Jones G, Valentino RJ. Bladder distention activates noradrenergic locus coeruleus neurons by an excitatory amino acid mechanism. Neuroscience. 1992;51:555–563. doi: 10.1016/0306-4522(92)90295-d. [DOI] [PubMed] [Google Scholar]
- Page ME, Berridge CW, Foote SL, Valentino RJ. Corticotropin-releasing factor in the locus coeruleus mediates EEG activation associated with hypotensive stress. Neurosci Lett. 1993;164:81–84. doi: 10.1016/0304-3940(93)90862-f. [DOI] [PubMed] [Google Scholar]
- Palamarchouk VS, Zhang J, Zhou G, Swiergiel AH, Dunn AJ. Hippocampal norepinephrine-like voltammetric responses following infusion of corticotropin-releasing factor into the locus coeruleus. Brain Res Bull. 2000;51(4):319–26. doi: 10.1016/s0361-9230(99)00241-5. [DOI] [PubMed] [Google Scholar]
- Pasquier DA, Villar MJ. Subcortical projections to the lateral geniculate body in the rat. Exp Brain Res. 1982;48(3):409–19. doi: 10.1007/BF00238617. [DOI] [PubMed] [Google Scholar]
- Paxinos G, Watson C. The rat brain in stereotaxic coordinates. Academic Press; San Diego: 1982. [DOI] [PubMed] [Google Scholar]
- Plotsky PM, Vale W. Hemorrhage-induced secretion of corticotropin-releasing factor-like immunoreactivity into the rat hypophyseal portal circulation and its inhibition by glucocorticoids. Endocrinology. 1984;114:164–169. doi: 10.1210/endo-114-1-164. [DOI] [PubMed] [Google Scholar]
- Rogawski MA, Aghajanian GK. Modulation of lateral geniculate neurone excitability by noradrenaline microiontophoresis or locus coeruleus stimulation. Nature. 1980;287:731– 734. doi: 10.1038/287731a0. [DOI] [PubMed] [Google Scholar]
- Rogawski MA, Aghajanian GK. Activation of lateral geniculate neurons by locus coeruleus or dorsal noradrenergic bundle stimulation: selective blockade by the alpha 1-adrenoceptor antagonist prazosin. Brain Res. 1982;250(1):31–9. doi: 10.1016/0006-8993(82)90950-7. [DOI] [PubMed] [Google Scholar]
- Shackman AJ, Maxwell JS, McMenamin BW, Greischar LL, Davidson RJ. Stress potentiates early and attenuates late stages of visual processing. J Neurosci. 2011;31(3):1156–61. doi: 10.1523/JNEUROSCI.3384-10.2011. [DOI] [PMC free article] [PubMed] [Google Scholar]
- Simpson KL, Altman DW, Wang L, Kirifides ML, Lin RC, Waterhouse BD. Lateralization and functional organization of the locus coeruleus projection to the trigeminal somatosensory pathway in rat. J Comp Neurol. 1997;385(1):135–47. [PubMed] [Google Scholar]
- Sillito AM, Kemp JA, Berardi N. The cholinergic influence on the function of the cat dorsal lateral geniculate nucleus (dLGN) Brain Res. 1983;280(2):299–307. doi: 10.1016/0006-8993(83)90059-8. [DOI] [PubMed] [Google Scholar]
- Sutherland JE, Conti LH. Restraint stress-induced reduction in prepulse inhibition in Brown Norway rats: role of the CRF2 receptor. Neuropharmacology. 2011;60(4):561–71. doi: 10.1016/j.neuropharm.2010.12.022. [DOI] [PMC free article] [PubMed] [Google Scholar]
- Svensson TH. Peripheral, autonomic regulation of locus coeruleus noradrenergic neurons in brain: putative implications for psychiatry and psychopharmacology. Psychopharmacology. 1987;92 (1):1–7. doi: 10.1007/BF00215471. [DOI] [PubMed] [Google Scholar]
- Swanson LW, Hartman BK. The central adrenergic system. An immunofluomscence study of the location of cell bodies and their efferent connections in the rat using dopamine-b-hydroxylase as a marker. J Comp Neural. 1976;163:467–506. doi: 10.1002/cne.901630406. [DOI] [PubMed] [Google Scholar]
- Swiergiel AH, Palamarchouk VS, Smagin G, Dunn AJ. Cortical catecholamine secretion following intravenous nitroprusside infusion: A voltammetric study. Brain Research Bulletin. 1998;45 (2):125–129. doi: 10.1016/s0361-9230(97)00317-1. [DOI] [PubMed] [Google Scholar]
- Valentino RJ, Foote SL, Aston-Jones G. Corticotropin releasing factor activates noradrenergic neurons of the locus coeruleus. Brain Res. 1983;270:363–367. doi: 10.1016/0006-8993(83)90615-7. [DOI] [PubMed] [Google Scholar]
- Valentino RJ, Wehby RG. Corticotropin-releasing factor: evidence for a neurotransmitter role in the locus coeruleus during hemodynamic stress. Neuroendocrinology. 1988;48:674–677. doi: 10.1159/000125081. [DOI] [PubMed] [Google Scholar]
- Valentino RJ. Corticotropin-releasing factor: putative neurotransmitter in the noradrenergic nucleus locus ceruleus. Psychopharmacol Bull. 1989;25:306–311. [PubMed] [Google Scholar]
- Valentino RJ, Page ME, Curtis AL. Activation of noradrenergic locus coeruleus neurons by hemodynamic stress is due to local release of corticotropin-releasing factor. Brain Res. 1991;555:25–34. doi: 10.1016/0006-8993(91)90855-p. [DOI] [PubMed] [Google Scholar]
- Valentino RJ, Van Bockstaele E. Opposing regulation of the locus coeruleus by corticotropin-releasing factor and opioids. Potential for reciprocal interactions between stress and opioid sensitivity. Psychopharmacology. 2001;158 (4):331–42. doi: 10.1007/s002130000673. [DOI] [PubMed] [Google Scholar]
- Valentino RJ, Van Bockstaele E. Convergent regulation of locus coeruleus activity as an adaptive response to stress. Eur J Pharmacol. 2008;583 (2–3):194–203. doi: 10.1016/j.ejphar.2007.11.062. [DOI] [PMC free article] [PubMed] [Google Scholar]
- White JM, Stannard A, Burkhardt GE, Eastridge BJ, Blackbourne LH, Rasmussen TE. The epidemiology of vascular injury in the wars in Iraq and Afghanistan. Ann Surg. 2011;253(6):1184–9. doi: 10.1097/SLA.0b013e31820752e3. [DOI] [PubMed] [Google Scholar]
- Woolf NJ, Butcher LL. Cholinergic systems in the rat brain: III. Projections from the pontomesencephalic tegmentum to the thalamus, tectum, basal ganglia, and basal forebrain. Brain Res Bull. 1986;16(5):603–37. doi: 10.1016/0361-9230(86)90134-6. [DOI] [PubMed] [Google Scholar]
- Zhang JJ, Swiergiel AH, Palamarchouk VS, Dunn AJ. Intracerebroventricular infusion of CRF increases extracellular concentrations of norepinephrine in the hippocampus and cortex as determined by in vivo voltammetry. Brain Res Bull. 1998;47(3):277–84. doi: 10.1016/s0361-9230(98)00117-8. [DOI] [PubMed] [Google Scholar]