

Abstract
The brainstem nucleus locus coeruleus (LC) is the sole source of norepinephrine (NE)-containing fibers in the mammalian cortex. Previous studies suggest that the density of noradrenergic fibers in rat is relatively uniform across cortical regions and that cells in the nucleus discharge en masse. This implies that activation of the LC results in equivalent release of NE throughout the cortex. However, it is possible that there could be differences in the density of axonal varicosities across regions, and that these differences, rather than a difference in fiber density may contribute to the regulation of NE efflux. Quantification of dopamine beta hydroxylase (DβH) immunostained varicosities was performed on several cortical regions and in the ventral posterior medial (VPM) thalamus using unbiased sampling methods. The density of DβH varicosites is greater in the prefrontal cortex than in motor, somatosensory, or piriform cortices, greater in superficial than in deep layers of cortex, and greater in VPM than in somatosensory cortex. Our results provide anatomical evidence for non-uniform release of NE across functionally discrete cortical regions. This morphology may account for differential, region specific, impact of LC output on different cortical areas.
Keywords: norepinephrine, prefrontal, somatosensory, motor, locus coeruleus, stereology
Introduction
Many studies conducted over several decades have examined the noradrenergic projection to the mammalian cerebral cortex. The sole source of this input is the nucleus locus coeruleus (LC), a small cluster of norepinephrine (NE)-containing cells located in the brainstem (Levitt and Moore, 1978; Morrison et al., 1978). While the trajectories and densities of cortical NE fibers have been described, the uniformity of this axonal network as it relates to the potential for NE release in the surrounding tissue has not been adequately addressed. The reason for this gap in experimental analysis is largely methodological.
The capacity for uniform vs non-uniform release of NE across the cortical mantle is an important consideration. While it is well established that NE can modulate individual neuron and neuronal network function (Berridge and Waterhouse, 2003), such effects follow an inverted-U dose response relationship. Thus, local extracellular concentrations of NE are important in determining the effects of LC activation and LC-mediated transmitter release in noradrenergic terminal fields. For example, differences in NE release across cortical regions could optimize processing in one area while minimally affecting or suppressing neural circuit operations in another.
In 1968, Fuxe and colleagues described the density of catecholaminergic nerve terminals in the rat as non-uniform, being greater in the cingulate cortex relative to other cortices as well as greater in superficial vs deep cortical layers (Fuxe et al., 1968). These qualitative observations were based upon histochemical fluorescence, a technique that lacked specificity for clearly distinguishing between dopamine- and NE-containing axons. Later, with the development of immunohistochemistry for dopamine beta-hydroxylase (DβH), the enzyme that converts dopamine to NE, a better distinction of NE fibers was achieved. Morrison and colleagues (1978) reexamined NE cortical innervation in the rat using DβH immunohistochemistry and measured NE content. They described a widespread and uniform NE innervation of the cortex, with major differences only in the orientation of NE fibers in specific cortical regions.Palkovits et al. (1979) demonstrated the presence of NE across the rat cortical mantle, with only minor differences in content. Using NE autoradiography,Doucet et al. (1988) and Audet et al. (1988) compared regions of rat cortex and found a fairly uniform distribution of noradrenergic axonal varicosities, although a graded distribution across cortical layers was noted. Biegon and Rainbow (1983) examined the distribution of the NE transporter (NET) in the rat and found the cingulate cortex to be distinctive as the only cortical area with moderately high binding.
For the most part, these reports involve qualitative, not quantitative analyses, and even the quantitative papers (Audet et al., 1988; Doucet et al., 1988) lack focused statistical comparisons. The conclusion to be drawn from these studies is that the overall distribution of noradrenergic input is relatively equivalent among discrete cortical regions. The exception appears to be the repeated observation of denser innervation in superficial as opposed to deep, cortical layers (Fuxe et al., 1968). This projection pattern is preserved across species (Freedman et al., 1975; 1976; Gatter and Powell, 1977; Itakura et al., 1981).
In the present study we revisited the question of uniform vs non-uniform distribution of NE release in the brain. By using a quantitative approach, based on unbiased stereological methods and statistical inference (reviewed in West, 1993), we sought objective tests of potential non-uniformity of the noradrenergic system in cortical terminal fields. We estimated NE varicosity density across multiple areas in the same animals in order to evaluate several different potential organizational schemes.
Materials and Methods
Subjects
Five male Sprague-Dawley rats weighing between 325–375 grams served as subjects. Animals were housed two or three per cage, under 12 hour light/12 hour dark conditions, with ad libitum access to food and water All methods involving the use of live animals conformed to NIH guidelines and were approved by the appropriate Institutional Animal Care and Use Committee.
Tissue Processing
Subjects were deeply anesthetized with an intraperitoneal injection of Nembutal (50 mg/kg). One hundred ml of room temperature saline was perfused transcardially at 2 ml/s, followed by 350 ml of 4% paraformaldahyde in 0.1 PBS (pH 7.4), at 2 ml/s during the first minute, then decreased to 1 ml/s for the remainder of the solution. Brains were removed from the skull, postfixed in 4% paraformaldehyde overnight, and then placed into 20% sucrose until the time of sectioning.
The brains were sectioned at 40 µm using a cryostat set between −17 to −18 °C. Tissue was collected on 0.1 M PBS-Az. Sections were collected serially. Every sixth section was saved as part of a set representative of the entire cerebrum and underlying structures and processed for dopamine beta hydroxylase (DβH) and methyl green. Tissue was first placed in phosphate buffered saline (PBS) and 30% hydrogen peroxide bath, and subsequently washed in PBS. Sections were then incubated for 2 hours in 1% triton PBS followed by overnight incubation in the primary antibody, monoclonal mouse anti-DβH (1/1000, Table 1). Specificity of the DβH antibody had been demonstrated previously by preadsorption with excess bovine DβH and detection by Western blot (Rinaman, 2001; Zhou et al., 2004). Sections were then rinsed in 0.3% triton PBS and incubated in the secondary antibody, biotinylated anti-mouse IgG (1/1000; Jackson ImmunoResearch, West Grove, PA) for 2 hours. The tissue was again washed in 0.3% triton PBS and an avidin-biotin reaction was used to visualize the fibers. Sections were incubated in the ABC (1/1000; Vector Laboratories) for 90 min, rinsed in PBS, and exposed to Vector SG (blue/grey; SK-4700) for 20 minutes. All tissue samples were processed at the same time. Sections were then placed in PBS to stop the reaction, washed and stored in PBS in 0.1% sodium azide. Tissue was mounted on gelatin coated slides and counterstained with methyl green (MG). The MG solution was placed in a 60°C oven for 20 minutes and then slides were submerged in MG for 1 minute. The sections were then rinsed in distilled water, dehydrated with a series of ethanol baths, and cover slipped.
Table 1.
Primary Antibody Used
| Antigen | Immunogen | Manufacture, specie, type, catalogue number |
Dilution |
|---|---|---|---|
| DβH | Purified bovine DβH from adrenal medulla | Millipore, mouse monoclonal, MAB308 | 1:1000 |
Regions Selected for Study
Regions of interest were demarcated using Paxinos and Watson (1998) The Rat Brain in Stereotaxic Coordinates. We sampled varicosities throughout the A-P length of each region (Figures 1 and 2, Table 2). Our general hypothesis was that the distribution of noradrenergic varicosities would differ among regions with different functional roles. For example, many recent studies have underscored the importance of NE to higher cognitive functions (Lapiz and Morilak 2006; Lapiz et al., 2007; Tait et al., 2007; McGaughy et al., 2008; Newman et al., 2008). Thus, one expectation was that frontal cortical regions would express higher densities of NE varicosities than other cortical areas. Therefore we contrasted frontal, somatosensory, motor, and piriform (PIR) cortices. Furthermore we subdivided the first three regions: the somatosensory cortex into primary (S1), barrel field (BF) and secondary (S2) divisions; the motor cortex into primary (M1) and secondary (M2) divisions; the frontal cortex into anterior infralimbic (ILA) and prelimbic (PL) portions of the medial prefrontal cortex, the anterior cingulate (ACA), and medial (MO), lateral (LO), ventral (VO), and dorsolateral (DLO) regions of the orbitofrontal cortex to test for finer-scale differences in density that might be associated with distinct functional roles, emphasizing regions associated with executive function in the prefrontal cortex. The ventral posterior medial (VPM) thalamus was included to allow us to contrast densities along the well-defined ascending trigeminal somatosensory pathway. For determination of cortical fields and sub-fields we relied on coordinates and anatomical landmarks specified in the rat brain atlas of Paxinos and Watson (1998), see Figure. 1, cross-referenced with the atlas of Zilles (1985). The borders of regions of interest were identified after matching tissue sections with comparable atlas sections (Figure 2).
Figure 1.

Regional borders used to delineate cortical and subcortical areas of interest. Demarcation of the areas of interest. All anatomical borders were taken from Paxinos and Watson (4th edition, 1998). Distance of section from bregma indicated at lower right of each section. Abbreviations: ACA; anterior cingulate, BF; barrel field, ILA; anterior infralimbic, M1; primary motor, M2; secondary motor LO; lateral orbitofrontal, MO; medial orbitofrontal, VO; ventral orbitofrontal, DLO; dorsolateral orbitofrontal, PIR; piriforn, PL; prelimbic, S1; primary somatosensory, S2; secondary somatosensory, VPM; ventral posterior medial thalamic nucleus.
Figure 2.

A sample coronal section paired with atlas diagram (Paxinos and Watson, 1998) at bregma −0.26.
Table 2.
Estimated NE varicosity number, regional volume and varicosity density for multiple brain regions.
| Region | Atlas Boundaries (from bregma) |
Number of Sampling Sites |
CE 0 | Estimated total numbers of NE Varicosities (×106) |
Regional Volume (mm3) |
Density (×106/mm3) |
|
|---|---|---|---|---|---|---|---|
| Frontal | PL | 4.70 to 2.20 | 381 ± 62.6 | 0.076 ± 0.008 | 7.64 ± 0.80 | 3.30 ± 0.40 | 2.48 ± 0.45 |
| ILA | 3.20 to 2.20 | 140 ± 9.3 | 0.096 ± 0.007 | 4.47 ± 0.57 | 1.28 ± 0.08 | 3.54 ± 0.50 | |
| ACA | 3.70 to −1.40 | 787 ± 42.3 | 0.050 ± 0.007 | 28.74 ± 2.29 | 7.74 ± 0.25 | 3.72 ± 0.31 | |
| MO | 4.20 to 3.70 | 143 ± 32.0 | 0.166 ± 0.070 | 3.80 ± 0.93 | 1.33 ± 0.30 | 2.89 ± 0.63 | |
| VO | 4.20 to 3.70 | 302 ± 42.1 | 0.090 ± 0.020 | 7.51 ± 0.84 | 2.82 ± 0.41 | 2.80 ± 0.34 | |
| LO | 4.20 to 3.70 | 283 ± 48.8 | 0.094 ± 0.018 | 7.90 ± 1.28 | 2.65 ± 0.48 | 3.09 ± 0.33 | |
| DLO | 4.20 to 3.70 | 134 ± 34.4 | 0.143 ± 0.053 | 3.50 ± 1.06 | 1.12 ± 0.27 | 2.70 ± 0.53 | |
| Motor | M1s | 3.70 to −3.80 | 986 ± 64.0 | 0.041 ± 0.002 | 25.99 ± 4.51 | 9.75 ± 0.40 | 2.66 ± 0.43 |
| M1d | 3.70 to −3.80 | 972 ± 37.2 | 0.048 ± 0.002 | 22.09 ± 3.04 | 9.45 ± 0.24 | 2.33 ± 0.30 | |
| M2s | 4.20 to −3.80 | 752 ± 52.2 | 0.068 ± 0.006 | 19.74 ± 3.46 | 7.26 ± 0.53 | 2.69 ± 0.38 | |
| M2d | 4.20 to −3.80 | 653 ± 44.6 | 0.072 ± 0.004 | 14.78 ± 2.20 | 6.14 ± 0.54 | 2.42 ± 0.30 | |
| Sensory | S1s | 2.70 to −3.60 | 1666 ± 52.3 | 0.040 ± 0.003 | 40.86 ± 8.98 | 16.44 ± 0.43 | 2.44 ± 0.46 |
| S1d | 2.70 to −3.60 | 1503 ± 46.0 | 0.038 ± 0.004 | 30.48 ± 5.18 | 14.77 ± 0.43 | 2.04 ± 0.29 | |
| BFs | 3.70 to −1.40 | 825 ± 31.6 | 0.058 ± 0.006 | 17.56 ± 4.93 | 8.38 ± 0.39 | 2.10 ± 0.57 | |
| BFd | 3.70 to −1.40 | 814 ± 40.3 | 0.078 ± 0.007 | 13.89 ± 3.00 | 7.86 ± 0.40 | 1.77 ± 0.37 | |
| S2s | −0.26 to −3.60 | 329 ± 28.2 | 0.074 ± 0.010 | 7.04 ± 1.32 | 3.21 ± 0.22 | 2.19 ± 0.42 | |
| S2d | −0.26 to −3.60 | 346 ± 20.2 | 0.078 ± 0.007 | 5.17 ± 0.64 | 3.36 ± 0.16 | 1.55 ± 0.19 | |
| Other | PIR | 3.70 to −4.30 | 1286 ± 129.9 | 0.040 ± 0.005 | 29.21 ± 4.89 | 12.15 ± 0.90 | 2.37 ± 0.36 |
| VPM | −2.30 to −4.52 | 157 ± 19.1 | 0.094 ± 0.010 | 4.19 ± 1.09 | 1.48 ± 0.25 | 2.75 ± 0.43 | |
All values represent the mean ± SEM. Densities were computed for each rat separately, then averaged. CE 0: Gundersen coefficient of error. PL: prelimbic. ILA: anterior infralimbic. MO: medial orbitofrontal. VO: ventral orbitofrontal. LO: lateral orbitofrontal. DLO: dorsolateral orbitofrontal. ACA: anterior cingulate. M2s secondary motor, superficial. M2d: secondary motor, deep. M1s, primary motor, superficial. M1d: primary motor, deep. S1s: primary somatosensory, superficial. S1d: primary somatosensory, deep. BSs: barrel field, superficial. BFd: barrel field, deep. S2s, secondary somatosensory cortex, superficial. S2d, secondary somatosensory cortex, deep. PIR: piriform. VPM ventral posterior medial nucleus of the thalamus.
An alternative hypothesis to a modality specific organization is that NE varicosity density varies depending upon the origin of the noradrenergic fibers innervating the cortex.Morrison et al. (1979) established two major pathways for NE cortical afferents: a path medial to the cingulum bundle that innervates medial cortices (anterior cingulate and retrosplenial cortex) and a lateral projection that leaves the medial forebrain bundle and proceeds laterally to enter the external capsule and innervates lateral cortical areas from frontal to occipital cortex in longitudinal strips. The mediolateral topography observed by Morrison et al. might be a basis for non-uniform varicosity density. To test this idea we looked for a relationship between density and positional order of cortical regions from medial to lateral, as they appear in cross sections caudal to the genu of the corpus callosum: ACA, M2, M1, S1, BF and S2.
We also considered other possible organizational schemes for the distribution of varicosities. For the sensory and motor regions, we divided the cortex into superficial (layers II/III - s) and deep (layers V/VI - d), e.g., S1s, S1d, etc., portions (Figure 3), to test whether earlier observations of depth-related differences in fiber density were consistent with varicosity density. Finally, we performed an additional series of measurements of the distances between members of pairs of adjacent varicosities along single axons in each region (N=20 per region), to assess whether variation in this distance might be related to regional differences in varicosity density. Pairs were selected only if it was clear they lay on the same fiber within the same section, and there was no intervening varicosity. To determine mean inter-varicosity distance along single axons the x, y, and z coordinates of the two varicosities were extracted and the distance between the two points determined.
Figure 3.

Parcellation of pyramidal superficial (layer II–III) and deep (layer V–VI) cortical layers. Cortical layers were differentiated by cytoarchitectural boundaries with methyl green staining. (A) A sample coronal section from somatosensory cortex. DβH varicosities were observed in both superficial and deep layers (B).
Data Analysis
Sections were initially viewed at 5× magnification to contour anatomical boundaries. A Zeiss Axioplan microscope and computer equipped with StereoInvestigator software (version 7; MicroBrightField, Inc., Williston, VT) were used to complete the analysis. A systematic random sample to count varicosities used a grid with spacing of 230 × 180 µm that was placed over all regions of interest. Varicosities were counted within a counting frame 10 µm in length, 10 µm in width, and 5 µm in height. A guard zone of 3 µm was employed to avoid irregularities on the tissue surface. The optical fractionator probe was used to estimate the total number of noradrenergic varicosities. Varicosities were counted at 100× magnification with oil immersion. To estimate regional volume a Cavalieri probe was completed (Gundersen and Jensen, 1987). Grid spacing for the Cavalieri probe was 250 × 250 µm. The value obtained for the number of varicosities estimated with the optical fractionator was divided by the regional volume to obtain an estimate for the density of noradrenergic varicosities in each region.
Densities were compared using paired t-tests or repeated measures ANOVA (degrees of freedom adjusted by the Greenhouse-Geisser correction) followed by paired post-hoc t-tests, applying the sequential Bonferroni correction of Holm (1979). Analyses were performed in the statistical language R (R Development Core Team, 2011), using the ez (Lawrence, 2011) and car packages (Fox and Weisberg, 2010) for ANOVA.
Results
Varicosities appeared as spherical enlargements of varying size along DβH-positive fibers in noradrenergic terminal fields (Figure 4A). Varicosities were absent along DβH-stained fibers traversing the midbrain and pons (Figure 4B).
Figure 4.

Photomicrographs illustrating DβH-stained fibers with and without varicosities. A. DβH-stained fiber from prefrontal cortex. Arrows top to bottom indicate typical large, intermediate, and small varicosities along the fiber length. B. DβH-stained fibers from the dorsal noradrenergic bundle where varicosities are typically absent.
As indicated above, varicosities were sampled and counted throughout the A-P length of each region studied (Table 2). To evaluate the precision of our estimates, we calculated the relative variance of individual estimates utilizing the Gundersen coefficient of error (CE 0; Gundersen and Jensen, 1987). Most CE 0 values were below 0.1, the exceptions being MO and DLO. Table 2 gives the mean estimated totals of NE varicosities, volumes and NE varicosities by region, along with CE 0 values. For several comparisons, the raw numbers and volumes were recombined for each rat to compute densities for various composite regions, e.g., the density for frontal was computed for each rat from the summed counts and volumes for PL, ILA, MO, VO, LO, and DLO (Table 3).
Table 3.
Estimated NE varicosity number, regional volume and varicosity density for combined brain regions.
| Region | Estimated total numbers of NE Varicosities (×106) |
Regional Volume (mm3) |
Density (×106/mm3) |
|---|---|---|---|
| Frontal | 63.56 ± 3.12 | 20.27 ± 1.87 | 3.23 ± 0.32 |
| mPFC | 12.10 ± 1.29 | 4.59 ± 0.47 | 2.77 ± 0.43 |
| ORB | 22.71 ± 3.57 | 7.94 ± 1.39 | 2.97 ± 0.32 |
| Motor | 82.60 ± 12.53 | 32.60 ± 0.68 | 2.52 ± 0.35 |
| M1 | 48.08 ± 7.52 | 19.20 ± 0.58 | 2.50 ± 0.36 |
| M2 | 34.53 ± 5.65 | 13.40 ± 1.06 | 2.56 ± 0.34 |
| Sensory (−BF) | 115.01 ± 23.14 | 54.02 ± 0.92 | 2.11 ± 0.39 |
| S1 | 71.34 ± 13.92 | 31.21 ± 0.81 | 2.25 ± 0.38 |
| S2 | 12.21 ± 1.90 | 6.57 ± 0.38 | 1.86 ± 0.29 |
| BF | 31.45 ± 7.87 | 16.24 ± 0.78 | 1.94 ± 0.47 |
| Primary | 119.42 ± 21.10 | 50.41 ± 0.89 | 2.34 ± 0.36 |
| Secondary | 46.74 ± 7.41 | 19.97 ± 0.99 | 2.32 ± 0.32 |
| Superficial | 111.19 ± 22.48 | 45.04 ± 0.62 | 2.45 ± 0.45 |
| Deep | 86.42 ± 13.16 | 41.57 ± 0.82 | 2.06 ± 0.28 |
For each combined region, the counts and volumes were summed, and new densities computed from those totals. All values represent the mean ± SEM. mPFC: medial prefrontal cortex. ORB: orbitofrontal cortex. M2: secondary motor. M1: primary motor S1: primary somatosensory. BF: barrel field. S2: secondary somatosensory.
Cortical NE Innervation: Modality
In our initial analysis we posited that cortical NE innervation varies according to functional modality. Frontal cortex was selected as a region representative of executive function, whereas motor, somatosensory and piriform cortices were selected as representative of motor, sensory and limbic modalities. While the fiber density within these areas appears uniform at lower magnification, the high magnification pictures are suggestive of variations in the number of varicosities across regions (Figure 5). Varicosity density varied significantly among cortical regions (p= 0.000048), with post-hoc paired t-tests showing that density was significantly greater in frontal than in sensory (p=0.0063), piriform (p=0.044), and motor (p= 0.046) cortex (Figure 6). The mean density in the frontal cortex (3.23 × 10⁶ varicosities/mm3) was roughly 40% greater than the mean of the remaining areas. No difference was observed among motor, somatosensory and piriform cortex (0.12 < p < 0.42).
Figure 5.

Photomicrographs illustrating DβH fibers and varicosities in the frontal, motor, sensory, and piriform cortices; and VPM thalamus at 40× (lower rows) and 100× (upper row) magnification. While the 40× images appear more uniform, differences in varicosity density can be observed at higher magnification. VPM: ventral posterior medial thalamus.
Figure 6.

Density of noradrenergic varicosities in cortical regions associated with different modalities. Density is calculated by dividing the estimated total number of noradrenergic varicosities by the summed volume for each anatomical region. PIR: piriform. * significantly different from sensory, motor and piriform cortex (p<0.05).
Cortical NE Innervation: Superficial and Deep Layers of Sensory and Motor Cortex
We quantified the NE varicosity density in superficial and deep cortical layers in combined motor and somatosensory (M1 + M2 + S1 + S2 + BF) cortices. Superficial and deep layers in these cortical areas are readily differentiated and easily distinguished in methyl green counterstained sections (see Figure 3). In every animal, the density of varicosities in the collected superficial layers was greater than in the deep layers, with mean density 18% greater (2.45 vs 2.06 × 10⁶ varicosities/mm3, respectively). This difference lies on the cusp of significance (p = 0.0507); however, removal of an outlier with an unusually large difference (~5-fold greater than the remaining cases) resulted in a smaller (11%) but highly significant (p = 0.0008) difference (Figure 7), i.e. superficial > deep. .
Figure 7.

Differences in varicosity density in primary and secondary cortices (A) and superficial and deep layers of cortex (B). No significant difference in density was found between primary and secondary regions. Superficial layers of cortex show varicosity density marginally greater than deep layers (see text; * p = 0.0507).
Cortical NE Innervation: Primary vs Secondary Sensory and Motor Cortex
We compared varicosity density in primary (S1 + M1) vs secondary (S2 + M2) cortex using a paired t-test. The mean densities were virtually identical (2.34 vs 2.32 × 10⁶ varicosities/mm3, respectively), and were not significantly (p = 0.69) different from one another (Figure 7).
Cortical NE Innervation: Sub-regions of the Prefrontal Cortex
We quantified results from seven sub-regions of the prefrontal cortex (Figure 8). Repeated-measures ANOVA did not show a significant difference among areas (p = 0.33). Recombining data into medial prefrontal (IL + PL), orbitofrontal (MO + LO + VO + DLO), and cingulate cortex (not shown) gave a marginal result (uncorrected p = 0.041, p = 0.065 with Greenhouse-Geisser correction). Post-hoc pairwise t-tests showed that density in cingulate cortex was significantly greater than in the medial prefrontal cortex (p = 0.028).
Figure 8.

Density of noradrenergic varicosities within subdivisions of frontal cortex. There are no significant differences in the density of noradrenergic varicosities among the medial prefrontal, orbital, or anterior cingulate cortices. PL: prelimbic. ILA anterior infralimbic. MO: medial orbitofrontal. VO: ventral orbitofrontal. LO: lateral orbitofrontal. DLO: dorsolateral orbitofrontal. ACA: anterior cingulate.
NE Innervation at Different Levels of the Somatosensory System: Cortex and Thalamus
We compared the NE varicosity density within the somatosensory pathway at the level of thalamus (VPM) and cortex (S1, BF and S2). There was a significant effect of location on density (p = 0.0069). Post-hoc paired t-tests showed that density was greater in VPM than in BF (p = 0.018) and S1 (p = 0.035) but fell just short of significance compared to S2 (p = 0.057). The three cortical somatosensory areas were not significantly different from one another (0.17 < p < 0.74; Figure 9).
Figure 9.

Density of noradrenergic varicosities in somatosensory regions. VPM: ventral posterior medial thalamus. BF: barrel field cortex. S1: primary somatosensory cortex. S2: secondary somatosensory cortex. * significantly different from BF and S1 (p<0.05).
Relationship of Density to Mediolateral Position in Cortex
Figure 10 depicts the varicosity density of several dorsolateral cortical regions, arrayed in order from medial (ACA) to lateral (S2). These areas maintain a consistent positional relationship for a substantial span (~1 mm) in cross section. There is a consistent decrease in mean density from medial to lateral positions (Figure. 10), confirmed by Spearman correlation between density and positional rank (rho = −0.603; p = 0.00042).
Figure 10.

Density of noradrenergic varicosities in dorsolateral cortex arranged by distance from the midline. ACA: anterior cingulate. M2: secondary motor. M1: primary motor. S1: primary somatosensory. BF: barrel field. S2: secondary somatosensory.
Variation in Varicosity Density is Consistent with Variation in Inter-varicosity Distance
In addition to NE varicosity density, we also measured inter-varicosity distance in a subset of areas in all animals. Congruent with our density measure, noradrenergic fibers in the prefrontal cortex display a ~30% shorter mean inter-varicosity distance than sensory, motor, and piriform cortices and VPM thalamus (p = 8.9 × 10⁻⁶; post-hoc paired t-test p values: 0.0098 < p < 0.025). The latter four areas were not significantly different from one another (0.31 < p < 1). Figure 11 shows the relationship between averaged inter-varicosity distance and varicosity density for these five brain regions. The dashed line (distance × density = 6.19, fitted to pass through the coordinates for frontal cortex) shows the hyperbolic relationship to be expected if all of the observed variation in varicosity density were caused by differences in inter-varicosity distance alone, i.e., if the density of noradrenergic fibers were constant across regions, and only the spacing of varicosities along them varied (or they were relatively more tortuous in the frontal cortex than elsewhere). The line passes close to the coordinates for the other cortical areas, suggesting constant fiber density in the cortex, but is slightly to the left of the value for VPM, suggesting a greater density of fibers in thalamus.
Figure 11.
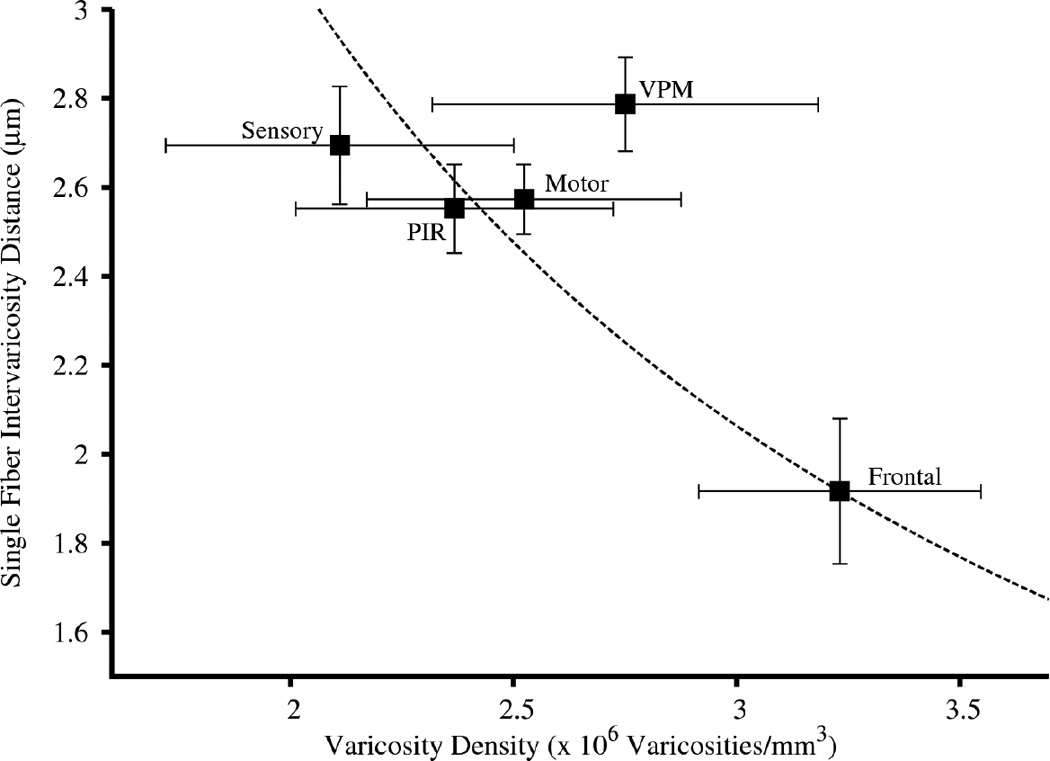
Single fiber inter-varicosity distances vs varicosity density. Means ± SEM for both x and y values. Dashed line: predicted form of the relationship (distance × density = a constant) fit to pass through the coordinates for frontal cortex (constant = 6.19), which would apply if the density of fibers were constant across regions, and differences in varicosity density were explained by differences in inter-varicosity distance alone. Motor, sensory, frontal, piriform (PIR) cortices and VPM thalamus.
Discussion
The goal of this study was to apply stereological techniques to achieve unbiased sampling of varicosities across brain regions and address the question of regional differences in the density of NE varicosities across the cerebral cortex. The absolute number of varicosities within a region was not the focus of our study but rather the density of varicosities within a region which we believe is an important indicator of noradrenergic function in cortical circuits. We observed significantly greater density of varicosities in the frontal cortex than in the other cortical areas examined. Although we did not observe robust statistical differences among frontal sub-regions, the cingulate cortex did show the greatest density, as reported by Fuxe et al. (1968). Varicosity density was greater in superficial than in deep cortical layers, in agreement with earlier reports (Fuxe et al., 1968; Audet et al., 1988). Primary sensory and motor cortex did not appear different from secondary sensorimotor cortices. The VPM thalamus showed greater density than somatosensory cortical areas, including the barrel field.
The values of density found in the present study range from 1.55 to 3.72 × 10⁶ varicosities/mm3 (Tables 2–3), with an overall average of 2.44 × 10⁶. Using autoradiography,Audet et al. (1988) report an average density of 1.2 × 10⁶ varicosities/mm3 in the anterior cortex of the rat, a figure three to ten-fold greater than earlier reports from the same laboratory (LaPierre et al., 1973; Descarries et al., 1977). We cannot discern whether the higher values in the current study are related to our use of DβH-immunohistochemistry, or to the use of the unbiased sampling. We do note that compared to the present study Meijas-Aponte et al. (2009) reported a higher range of DβH-positive varicosities in the rat midbrain.
The ability to draw statistically-supported conclusions is necessarily restricted in this type of survey study. The adjustments used to control familywise error rate in multiple comparisons (here, sequential Bonferroni) may lead to failure to detect differences that would have been readily found in specifically planned studies. For example, division of the frontal cortex into seven parts, with only five subjects, compromises the ability to detect meaningful differences in density among frontal regions (Figure 8). However, we note here that fresh investigations might want to use our observations as a basis for new hypotheses regarding the densities of NE varicosities in frontal cortex sub-regions.
In this study we used established anatomical borders and functional domains as the bases for framing questions concerning the densities of noradrenergic varicosities. We acknowledge there are many differences, functional and anatomical, between cortical regions and that differences such as the layer thickness might affect the ways in which the noradrenergic system can impact target circuit operations. In this investigation we focused our attention on the question of whether the noradrenergic innervation of the cortex was associated with modality and found evidence in favor of this point of view, e.g. frontal cortex has a higher density of varicosities than motor and sensory cortices.
Because this study was primarily designed to survey a large number of brain areas but with relatively few subjects the more complex statistical analyses required to answer questions about associations between depth and functional region could not be performed. For example, an important issue for future consideration is the potential for an association between depth and functionality for S1 vs S2, M1 vs M2, etc. We believe our results provide new information regarding the noradrenergic innervation of cortical terminal fields and set the stage for future quantitative investigations that focus on such issues.
Functional Interpretations
Throughout the years it has been challenging to obtain a holistic view of NE cortical innervation and the functional impact of the coeruleo-cortical projection. Many experimental strategies, including our own (Devilbiss and Waterhouse, 2011; Simpson et al, 1997), have been employed to address this issue and provide insight into the question of functional organization. The most consistent trend observed across fiber density studies is a gradient of noradrenergic innervation that decreases from superficial to deep cortical layers (Fuxe et al, 1968). However, fewer studies have reported differences in fiber and varicosity density across specific cortical regions in the rodent. Fuxe et al (1968) found the strongest noradrenergic innervation in the cingulate and insular cortex, while all other regions displayed a low NE innervation. In contrast, Morrison et al (1978) found comparable levels of both NE and DβH within the cingulate, primary motor, somatosensory, and visual cortices. The present investigation shows that while fiber density may remain constant across cortical regions there is a greater density of NE varicosities within frontal regions as compared to other cortical areas surveyed in the rat. Interestingly, the primate cortex has been shown to exhibit regional differences in fiber density; primary motor and somatosensory cortices are densely innervated, visual cortex shows a moderate NE fiber innervation, and temporal regions exhibit minimal NE fiber densities (Morrison et al., 1982; Levitt et al., 1984; Morrison and Foote, 1986). Therefore, while regional differentiation in NE innervation may be observed at the level of fiber density in the primate brain; a similar differentiation may be observed in the rodent brain only at the level of axonal varicosity distribution.
Additional reports using NE varicosities as markers confirmed the findings of earlier studies; i.e. the density of NE varicosities was greatest in superficial layers of cortex relative to deep layers (Lapierre et al., 1973). Later studies examining terminal distribution across cortical regions did not report differential densities of varicosities. In a study utilizing autoradiography Audet et al (1988) reported no significant differences in the density of NE terminals within several cortical regions including cingulate, agranular insular, primary motor, parietal, and piriform cortices. Interestingly, differences in NE tissue content across cortical regions have been reported. Levitt and Moore (1978) showed that sensorimotor, visual, and auditory cortices contained smaller concentrations of NE as compared to posterior cingulate cortex. In that study, the frontal region was defined as the “dorsal lateral surface of the frontal pole,” and likely contained motor cortex; no details were provided regarding the NE tissue content of the medial prefrontal regions described in the present study. A prior study by Kobayashi et al. (1974) revealed regional differences in the concentration of NE within normal adult rat brains. In that paper, entorhinal cortex was reported to have more than twice the concentration of NE as compared to occipital regions. These findings support those of the current study, suggesting a regional variation in the amount of NE available to discrete cortical regions.
The observed differences in NE varicosity density may have functional significance. Axonal varicosities, rather than synaptic terminals serve as the major release and reuptake sites of neurotransmitter in LC axons. Prior research has shown that varicosities contain NE and the proteins associated with transmitter release and reuptake (Schroeter et al., 2000; Descarries et al., 1977; Chiti and Teschemacher, 2007). Additionally, the monoaminergic system primarily operates via non-synaptic appositions (Beaudet and Descarries, 1978; Agnati et al., 1995; Zoli and Agnati, 1996; Aoki et al., 998; Zoli et al., 1998). Electrophysiological studies have shown that local application of NE or activation of the LC produces a range of modulatory actions following an inverted-U function (Berridge and Waterhouse, 2003). Together these findings suggest that for a given level of LC impulse activity the amount of NE released and therefore its modulatory action in terminal fields may be dependent upon varicosity density, as well as the density and type of receptors within range of release points.
The greater density of varicosities in the frontal cortex suggests the possibility of a different dynamic for LC-NE modulation of cognitive versus sensorimotor functions. Combined with the notion that LC cells discharge en masse (Aston-Jones and Cohen, 2005), the present result suggests that upon activation of the LC efferent path, frontal cortical areas may be subject to a relatively greater release of NE, i.e. via a greater density of varicosities. Similarly, the relatively greater density of varicosities in the VPM thalamus, compared to somatosensory cortex, argues for differences in NE modulation of early thalamic vs late cortical sensory processing. Physiological evidence from ensemble neuron recordings in the somatosensory system suggests that anatomical differences in the distribution of noradrenergic fibers and varicosities may indeed be functionally meaningful. In studies of the relative effects of LC-NE pathway stimulation on thalamic vs cortical sensory processing we noted that the somatosensory thalamic circuitry is more sensitive to LC-NE output than its corresponding cortical projection target (Devilbiss and Waterhouse, 2011). We believe that this effect, seen at two levels along an ascending sensory pathway might be duplicated in the effects of LC activation on different areas of cortex.
The potential for differential release of NE across the cortical mantle is significant in light of the dose dependency of noradrenergic effects on cells and circuits in cortical terminal fields (Devilbiss and Waterhouse, 2000, 2004; Devilbiss et al., 2006). An inverted U dose response function has been established for the effects of NE or LC activation on single neuron and ensemble neuronal responses to afferent synaptic stimuli. Thus, as a function of varicosity density, activation of the coeruleo-cortical pathway could result in different levels of NE release and different neuromodulatory outcomes across cortical regions. Such a mode of operation would provide a means for differential regulation of cognitive, sensory and motor functions by LC. The current studies do not address regional variations in receptor expression or the density of NE transporter proteins and regional capacities for NE reuptake. All of these attributes are also important determinants of LC-NE action across cortical terminal fields.
On the other hand, the medial-lateral gradient in density shown in Figure 9 suggests a simpler (although not mutually exclusive) explanation. Regional variations in NE varicosities may not be a specific adaptation to functional need, but rather merely the consequence of a system of longitudinally arranged NE-containing axons (Morrison et al., 1979) where the density of fibers or the number of varicosities per fiber decreases with lateral position.
Diversity of Adrenergic Receptors vs Varicosity Density
Adrenergic receptor subtypes are non-uniform across the cortex. The piriform cortex (PIR) expresses high levels of the alpha-1a receptor relative to other cortical regions, and other NE receptor types within PIR (Day et al., 1997). Other receptor distribution studies have shown higher levels of the alpha-1d expressed in prefrontal, cingulate, and occipital cortices, relative to temporal and piriform regions. Higher levels of alpha-2c receptors have been identified in superficial layers of cortex, relative to deep layers (Rosin et al, 1996). Conversely, alpha-2a expression is weak in superficial layers, and stronger in deep layers (Nicholas et al, 1993). Thus, an important consideration for future studies is the potential for differential expression of adrenergic receptors (and/or NE transporters) to compensate for, or interact with differential densities of varicosities in determining NE’s modulatory action within a specified terminal field.
Conclusions
The conventional view has been that noradrenergic projections from the LC are uniform across the cortical mantle. The current findings indicate that although NE fiber density may be equivalent among regions, the density of NE varicosities is not uniform. This suggests that NE may be differentially released across the cortex following activation of the LC and subsequent transmission of impulse activity to LC terminal fields, with the greatest amounts of NE released within the prefrontal cortex. Thus, the observed differences in varicosity density allow for the possibility of simultaneous release but differential effects of LC activation on cognitive, sensory and motor circuitries.
Acknowledgements
This research was supported, in part, by NIDA (DA017960) and the Pennsylvania Department of Health to BDW and a fellowship award (T32 NINDS NS 007440) to KLA.
Footnotes
Conflict of Interest Statement. The authors verify that they have no known or potential conflict of interest including any financial, personal or other relationships with other people or organizations within three years of beginning the submitted work that could inappropriately influence, or be perceived to influence, this work.
Role of Authors. All authors had full access to all the data in the study and take responsibility for the integrity of the data and the accuracy of the data analysis. Study concept and design: KLA, CAM-J, BDW. Acquisition of data: KLA, CAM-J. Analysis and interpretation of data: KLA, CAM-J, BDC, BDW. Drafting of the manuscript: KLA, CAM-J. Critical revision of the manuscript for important intellectual content: CAM-J, BDC, BDW. Statistical analysis: CAM-J, BDC. Obtained funding: KLA, BDW. Administrative, technical, and material support: KLA, CAM-J, BDC. Study supervision: BDW.
Literature Cited
- Agnati LF, Zoli M, Stromberg I, Fuxe K. Intercellular communication in the brain: wiring versus volume transmission. Neurosci. 1995;69(3):711–726. doi: 10.1016/0306-4522(95)00308-6. [DOI] [PubMed] [Google Scholar]
- Aoki C, Venkatesan C, Go CG, Forman R, Kurose H. Cellular and subcellular sites for noradrenergic action in the monkey dorsolateral prefrontal cortex as revealed by the immunocytochemical localization of noradrenergic receptors and axons. Cereb Cortex. 1998;8(3):269–277. doi: 10.1093/cercor/8.3.269. [DOI] [PubMed] [Google Scholar]
- Aston-Jones G, Cohen JD. An integrative theory of locus coeruleus-norepinephrine function: adaptive gain and optimal performance. Annu Rev Neurosci. 2005;28:403–450. doi: 10.1146/annurev.neuro.28.061604.135709. [DOI] [PubMed] [Google Scholar]
- Audet MA, Doucet G, Oleskevich S, Descarries L. Quantified regional and laminar distribution of the noradrenaline innervation in the anterior half of the adult rat cerebral cortex. J Comp Neurol. 1988;274(3):307–318. doi: 10.1002/cne.902740302. [DOI] [PubMed] [Google Scholar]
- Beaudet A, Descarries L. The monoamine innervation of rat cerebral cortex: synaptic and nonsynaptic axon terminals. Neuroscience. 1978;3(10):851–860. doi: 10.1016/0306-4522(78)90115-x. [DOI] [PubMed] [Google Scholar]
- Biegon A, Rainbow TC. Localization and characterization of [3H]desmethylimipramine binding sites in rat brain by quantitative autoradiography. J Neurosci. 1983;3:1069–1076. doi: 10.1523/JNEUROSCI.03-05-01069.1983. [DOI] [PMC free article] [PubMed] [Google Scholar]
- Berridge CW, Waterhouse BD. The locus coeruleus-noradrenergic system: modulation of behavioral state and state-dependent cognitive processes. Brain Res. Rev. 2003;42:33–84. doi: 10.1016/s0165-0173(03)00143-7. [DOI] [PubMed] [Google Scholar]
- Chiti Z, Tesmacher AG. Exocytosis of norepinephrine at axon varicosities and neuronal cell bodies in the rat brain. FASEB Journal. 2007;21(10):2540–2550. doi: 10.1096/fj.06-7342com. [DOI] [PubMed] [Google Scholar]
- Day HE, Campeau S, Watson SJ, Akil H. Distribution of alpha1a-, alpha 1b-, and alpha 1d-adrenergic receptor mRNA in the rat brain and spinal cord. J Chem Neuroanat. 1997;13:115–139. doi: 10.1016/s0891-0618(97)00042-2. [DOI] [PubMed] [Google Scholar]
- Descarries L, Watkins KC, Lapierre Y. Noradrenergic axon terminals in the cerebral cortex of rat. III. Topometric ultrastructural analysis. Brain Res. 1977;133(2):197–222. doi: 10.1016/0006-8993(77)90759-4. [DOI] [PubMed] [Google Scholar]
- Devilbiss DM, Waterhouse BD. Norepinephrine exhibits two distinct profiles of action on sensory cortical neuron responses to excitatory synaptic stimuli. Synapse. 2000;37:273–282. doi: 10.1002/1098-2396(20000915)37:4<273::AID-SYN4>3.0.CO;2-#. [DOI] [PubMed] [Google Scholar]
- Devilbiss DM, Waterhouse BD. Effects of tonic locus ceruleus output on sensory-evoked responses of ventral posterior medial thalamic and barrel field cortical neurons in the awake rat. J. Neurosci. 2004;24:10773–10785. doi: 10.1523/JNEUROSCI.1573-04.2004. [DOI] [PMC free article] [PubMed] [Google Scholar]
- Devilbiss DM, Page ME, Waterhouse BD. Locus ceruleus regulates sensory encoding by neurons and networks in waking animals. J Neurosci. 2006;26(39):9860–9872. doi: 10.1523/JNEUROSCI.1776-06.2006. [DOI] [PMC free article] [PubMed] [Google Scholar]
- Devilbiss DM, Waterhouse BD. Phasic and tonic patterns of locus coeruleus output differentially modulate sensory network function in the awake rat. J Neurophysiol. 2011;105(1):69–87. doi: 10.1152/jn.00445.2010. [DOI] [PMC free article] [PubMed] [Google Scholar]
- Doucet G, Descarries L, Audet MA, Garcia S, Berger B. Radioautographic method for quantifying regional monoamine innervations in the rat brain. Application to the cerebral cortex. Brian Res. 1988;8:125–131. doi: 10.1016/0006-8993(88)91403-5. [DOI] [PubMed] [Google Scholar]
- Foote SL, Bloom FE, Aston-Jones G. Nucleus locus ceruleus: new evidence of anatomical and physiological specificity. Physiol Rev. 1983;63(3):844–914. doi: 10.1152/physrev.1983.63.3.844. [DOI] [PubMed] [Google Scholar]
- Freedman R, Foote SL, Bloom FE. Histochemical characterization of a neocortical projection of the nucleus locus coeruleus in the squirrel monkey. J Comp Neurol. 1975;164(2):209–231. doi: 10.1002/cne.901640205. [DOI] [PubMed] [Google Scholar]
- Freedman R, Foote SL, Bloom FE. Histochemical characterization of a neocortical projection of the nucleus locus coeruleus in the squirrel monkey. J Comp Neurol. 1975;164(2):209–231. doi: 10.1002/cne.901640205. [DOI] [PubMed] [Google Scholar]
- Fox J, Sanford Weisberg S. An R Companion to Applied Regression. Second Edition. Thousand Oaks CA: Sage Publications Inc., Thousand Oaks, CA; 2010. [Google Scholar]
- Fuxe K, Hamberger B, Hokfelt T. Distribution of noradrenaline nerve terminals in cortical areas of the rat. Brain Res. 1968;8(1):125–131. doi: 10.1016/0006-8993(68)90175-3. [DOI] [PubMed] [Google Scholar]
- Gatter KC, Powell TP. The projection of the locus coeruleus upon the neocortex in the macaque monkey. Neuroscience. 1977;2(3):441–445. doi: 10.1016/0306-4522(77)90009-4. [DOI] [PubMed] [Google Scholar]
- Gundersen HJ, Jensen EB. The efficiency of systematic sampling in stereology and its prediction. J Microscopy. 1987;147(3):229–263. doi: 10.1111/j.1365-2818.1987.tb02837.x. [DOI] [PubMed] [Google Scholar]
- Holm S. A simple sequentially rejective multiple test procedure. Scand J Stat. 1979;6(2):65–70. [Google Scholar]
- Itakura T, Kasamatsu T, Pettigrew JD. Norepinephrine-containing terminals in kitten visual cortex: laminar distribution and ultrastructure. Neurosci. 1981;6(2):159–175. doi: 10.1016/0306-4522(81)90052-x. [DOI] [PubMed] [Google Scholar]
- Kobayashi RM, Palkovits M, Kopin IJ, Jacobowitz DM. Biochemical mapping of noradrenergic nerves arising from the rat locus coeruleus. Brain Res. 1974;77(2):269–279. doi: 10.1016/0006-8993(74)90790-2. [DOI] [PubMed] [Google Scholar]
- Lapierre Y, Beaudet A, Demianczuk N, Descarries L. Noradrenergic axon terminals in the cerebral cortex of rat. II. Quantitative data revealed by light and electron microscope radioautography of the frontal cortex. Brain Res. 1973;63:175–182. doi: 10.1016/0006-8993(73)90086-3. [DOI] [PubMed] [Google Scholar]
- Lapiz MD, Bondi CO, Morilak DA. Chronic treatment with desipramine improves cognitive performance of rats in an attentional set-shifting test. Neuropsychopharmacology. 2007;32(5):1000–1010. doi: 10.1038/sj.npp.1301235. [DOI] [PubMed] [Google Scholar]
- Lapiz MD, Morilak DA. Noradrenergic modulation of cognitive function in rat medial prefrontal cortex as measured by attentional set shifting capability. Neuroscience. 2006;137(3):1039–1049. doi: 10.1016/j.neuroscience.2005.09.031. [DOI] [PubMed] [Google Scholar]
- Lawrence MA. ez: Easy analysis and visualization of factorial experiments. R package version 3.0-0. 2011 http://CRAN.R-project.org/package=ez.
- Levitt P, Moore RY. Noradrenaline neuron innervation of the neocortex I the rat. Brain Res. 1978;139:219–231. doi: 10.1016/0006-8993(78)90925-3. [DOI] [PubMed] [Google Scholar]
- Levitt P, Rakic P, Goldman-Rakic P. Region-specific distribution of catecholamine afferents in primate cerebral cortex: A fluorescence histochemical analysis. J Comp Neurol. 1984;227:23–36. doi: 10.1002/cne.902270105. [DOI] [PubMed] [Google Scholar]
- McGaughy J, Ross RS, Eichenbaum H. Noradrenergic, but not cholinergic, deafferentation of prefrontal cortex impairs attentional set-shifting. Neuroscience. 2008;153(1):63–71. doi: 10.1016/j.neuroscience.2008.01.064. [DOI] [PMC free article] [PubMed] [Google Scholar]
- Meijas-Aponte C, Drouin C, Aston-Jones G. Adrenergic and noradrenergic innervation of the midbrain ventral tegmental area and retrorubral field: prominent inputs from medullary homeostatic centers. J Neurosci. 2009;29(11):3613–3626. doi: 10.1523/JNEUROSCI.4632-08.2009. [DOI] [PMC free article] [PubMed] [Google Scholar]
- Morrison JH, Foote SL. Noradrenergic and serotoninergic innervation of cortical, thalamic and tectal visual structures in old and new world monkeys. J Comp Neurol. 1986;243:117–138. doi: 10.1002/cne.902430110. [DOI] [PubMed] [Google Scholar]
- Morrison JH, Grzanna R, Molliver ME, Coyle JT. The distribution and orientation of noradrenergic fibers in neocortex of the rat: an immunofluorescence study. J Comp Neurol. 1978;181(1):17–39. doi: 10.1002/cne.901810103. [DOI] [PubMed] [Google Scholar]
- Morrison JH, Molliver ME, Grzanna R. Noradrenergic innervation of cerebral cortex: widespread effects of local cortical lesions. Science. 1979;205:313–316. doi: 10.1126/science.451605. [DOI] [PubMed] [Google Scholar]
- Morrison JH, Molliver ME, Grzanna R, Coyle JT. The intra-cortical trajectory of the coeruleo-cortical projection in the rat: a tangentially organized cortical afferent. Neuroscience. 1981;6(2):139–158. doi: 10.1016/0306-4522(81)90051-8. [DOI] [PubMed] [Google Scholar]
- Morrison JH, Foote SL, O’Connor D, Bloom FE. Laminar, tangential and regional organization of the noradrenergic innervation of monkey cortex: Dopamine-beta hydroxylase immunohistochemistry. Brain Res Bull. 1982;9:309–319. doi: 10.1016/0361-9230(82)90144-7. [DOI] [PubMed] [Google Scholar]
- Newman LA, Darling J, McGaughy J. Atomoxetine reverses attentional deficits produced by noradrenergic deafferentation of medial prefrontal cortex. Psychopharmacology (Berl) 2008;200(1):39–50. doi: 10.1007/s00213-008-1097-8. [DOI] [PMC free article] [PubMed] [Google Scholar]
- Nicholas AP, Pieribone V, Hokfeldt T. Distributions of mRNAs for alpha-2 adrenergic receptor subtypes in rat brain: An in situ hybridization study. J Comp Neurol. 1993;328:575–594. doi: 10.1002/cne.903280409. [DOI] [PubMed] [Google Scholar]
- Oleskevich S, Descarries L, Lacaille JC. Quantified distribution of the noradrenaline innervation in the hippocampus of adult rat. J Neurosci. 1989;9(11):3803–3815. doi: 10.1523/JNEUROSCI.09-11-03803.1989. [DOI] [PMC free article] [PubMed] [Google Scholar]
- Palkovits M, Zaborszky L, Brownstein MJ, Fekete MIK, Herman JP, Kanyicska B. Distribution of norepinephrine and dopamine in cerebral cortical areas of the rat. Brain Res Bull. 1979;4(5):593–601. doi: 10.1016/0361-9230(79)90099-6. [DOI] [PubMed] [Google Scholar]
- Paxinos G, Watson C. The rat brain in stereotaxic coordinates. NY: Academic Press; 1998. [DOI] [PubMed] [Google Scholar]
- R Development Core Team. R: A language and environment for statistical computing. Vienna, Austria: R Foundation for Statistical Computing; 2011. ISBN 3-900051-07-0, URL http://www.R-project.org/. [Google Scholar]
- Rinaman L. Postnatal development of catecholamine inputs to the paraventricular nucleus of the hypothalamus in rats. J Comp Neurol. 2001;438(4):411–422. doi: 10.1002/cne.1324. [DOI] [PubMed] [Google Scholar]
- Rosin DL, Talley EM, Lee A, Stornetta RL, Gaylinn BD, Guyenet PG, Lynch KR. Distribution of alpha 2C-adrenergic receptor-like immunoreactivity in the rat central nervous system. J Comp Neurol. 1996;372(1):135–165. doi: 10.1002/(SICI)1096-9861(19960812)372:1<135::AID-CNE9>3.0.CO;2-4. [DOI] [PubMed] [Google Scholar]
- Sakaguchi T, Nakamura S. The mode of projections of single locus coeruleus neurons to the cerebral cortex in rats. Neurosci. 1987;20(1):221–230. doi: 10.1016/0306-4522(87)90014-5. [DOI] [PubMed] [Google Scholar]
- Schroeter S, Apparsundaram S, Wiley RG, Miner LH, Sesack SR, Blakely RD. Immunolocalization of the cocaine- and antidepressant-sensitive l-norepinephrine transporter. J Comp Neurol. 2000;420:211–232. [PubMed] [Google Scholar]
- Simpson KL, Altman DW, Wang L, Kirifides ML, Lin RC, Waterhouse BD. Lateralization and functional organization of the locus coeruleus projection to the trigeminal somatosensory pathway in rat. J Comp Neurol. 1997;385:135–147. [PubMed] [Google Scholar]
- Tait DS, Brown VJ, Farovik A, Theobald DE, Dalley JW, Robbins TW. Lesions of the dorsal noradrenergic bundle impair attentional set-shifting in the rat. Eur J Neurosci. 2007;25(12):3719–3724. doi: 10.1111/j.1460-9568.2007.05612.x. [DOI] [PubMed] [Google Scholar]
- West MJ. New Stereological Methods for Counting Neurons. Neurobiol Aging. 1993;14:275–285. doi: 10.1016/0197-4580(93)90112-o. [DOI] [PubMed] [Google Scholar]
- Zhou M, Hank Simms H, Wang P. Increased gut-derived norepinephrine release in sepsis: up-regulation of intestinal tyrosine hydroxylase. Biochim Biophys Acta. 2004;1689:212–218. doi: 10.1016/j.bbadis.2004.03.008. [DOI] [PubMed] [Google Scholar]
- Zilles K. The Cortex of the Rat: a Stereotaxic Atlas. New York: Springer-Verlag; 1985. [Google Scholar]
- Zoli M, Agnati LF. Wiring and volume transmission in the central nervous system: the concept of closed and open synapses. Prog Neurobiol. 1996;49(4):363–380. doi: 10.1016/0301-0082(96)00020-2. [DOI] [PubMed] [Google Scholar]
- Zoli M, Torri C, Ferrari R, Jansson, Zini I, Fuxe K, Agnati LF. The emergence of the volume transmission concept. Brain Res Brain Res Rev. 1998;26(2–3):136–147. doi: 10.1016/s0165-0173(97)00048-9. [DOI] [PubMed] [Google Scholar]