Abstract
Regulated transcription controls the diversity, developmental pathways and spatial organization of the hundreds of cell types that make up a mammal. Using single-molecule cDNA sequencing, we mapped transcription start sites (TSSs) and their usage in human and mouse primary cells, cell lines and tissues to produce a comprehensive overview of mammalian gene expression across the human body. We find that few genes are truly ‘housekeeping’, whereas many mammalian promoters are composite entities composed of several closely separated TSSs, with independent cell-type-specific expression profiles. TSSs specific to different cell types evolve at different rates, whereas promoters of broadly expressed genes are the most conserved. Promoter-based expression analysis reveals key transcription factors defining cell states and links them to binding-site motifs. The functions of identified novel transcripts can be predicted by coexpression and sample ontology enrichment analyses. The functional annotation of the mammalian genome 5 (FANTOM5) project provides comprehensive expression profiles and functional annotation of mammalian cell-type-specific transcriptomes with wide applications in biomedical research.
The mammalian genome encodes the instructions to specify development from the zygote through gastrulation, implantation and generation of the full set of organs necessary to become an adult, to respond to environmental influences, and eventually to reproduce. Although the genome information is the same in almost all cells of an individual, at least 400 distinct cell types1 have their own regulatory repertoire of active and inactive genes. Each cell type responds acutely to alterations in its environment with changes in gene expression, and interacts with other cells to generate complex activities such as movement, vision, memory and immune response.
Identities of cell types are determined by transcriptional cascades that start initially in the fertilised egg. In each cell lineage, specific sets of transcription factors are induced or repressed. These factors together provide proximal and distal regulatory inputs that are integrated at transcription start sites (TSSs) to control the transcription of target genes. Most genes have more than one TSS, and the regulatory inputs that determine TSS choice and activity are diverse and complex (reviewed in ref. 2).
Unbiased annotation of the regulation, expression and function of mammalian genes requires systematic sampling of the distinct mammalian cell types and methods that can identify the set of TSSs and transcription factors that regulate their utilization. To this end, the FANTOM5 project has performed cap analysis of gene expression (CAGE)3 across 975 human and 399 mouse samples, including primary cells, tissues and cancer cell lines, using single-molecule sequencing3 (Fig. 1; see the full sample list in Supplementary Table 1).
Figure 1. Promoter discovery and definition in FANTOM5.
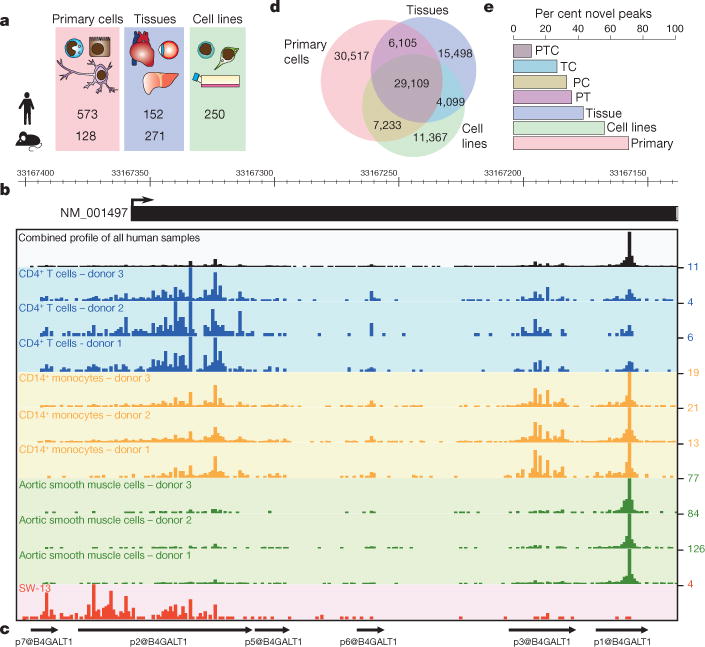
a, Samples profiled in FANTOM5. b, Reproducible cell-type-specific CAGE patterns observed for the 266 base CpG island associated B4GALT1 locus transcription initiation region hg19:chr9:33167138.33167403. CAGE profiles for CD4+ T cells (blue), CD14+ monocytes (gold), aortic smooth muscle cells (green) and the adrenal cortex adenocarcinoma cell line SW-13 (red) are shown. A combined pooled profile showing TSS distribution across the entire human collection is shown in black. Values on the y axis correspond to maximum normalized TPM for a single base in each track. c, Decomposition-based peak identification (DPI) finds 6 differentially used peaks within this composite transcription initiation region (note: peaks are labelled from p1@B4GALT1 with most tag support through to p7@B4GALT1 with the least tag support; p4@B4GALT1 is not shown and is in the 3′ UTR of the locus at position hg19::chr9:33111241.33111254−). Note in particular one large broad region on the left used in all samples and a sharp peak to the right, preferentially used in the aortic smooth muscle cells. d, Venn diagram showing DPI defined peaks expressed at ≥10 TPM in primary cells (red), tissues (blue) and cell lines (green). e, Fraction of unannotated peaks observed in subsets of d. P, primary cells, T, tissues, C, cell lines, PT, TC, PC and PTC correspond to peaks found in multiple sample types, for example, PT, found in primary cells and tissue samples.
CAGE libraries were sequenced to a median depth of 4 million mapped tags per sample (Supplementary Methods) to produce a unique gene expression profile, focused specifically on promoter utilization. CAGE has advantages over RNA-seq or microarrays for this purpose, because it permits separate analysis of multiple promoters linked to the same gene13. Moreover, we show in an accompanying manuscript4 that the data can be used to locate active enhancers, and to provide numerous insights into cell-type-specific transcriptional regulatory networks (see the FANTOM5 website http://fantom.gsc.riken.jp/5). The data extend and complement the recently published ENCODE5 data, and microarray-based gene expression atlases6 to provide a major resource for functional genome annotation and for understanding the transcriptional networks underpinning mammalian cellular differentiation.
The FANTOM5 promoter atlas
Single molecule CAGE profiles were generated across a collection of 573 human primary cell samples (~ 3 donors for most cell types) and 128 mouse primary cell samples, covering most mammalian cell steady states. This data set is complemented with profiles of 250 different cancer cell lines (all available through public repositories and representing 154 distinct cancer subtypes), 152 human post-mortem tissues and 271 mouse developmental tissue samples (Fig. 1a; see the full sample list in Supplementary Table 1). To facilitate data mining all samples were annotated using structured ontologies (Cell Ontology7, Uberon8, Disease Ontology9). The results of all analyses are summarized in the FANTOM5 online resource (http://fantom.gsc.riken.jp/5). We also developed two specialized tools for exploration of the data. ZENBU, based on the genome browser concept, allows users to interactively explore the relationship between genomic distribution of CAGE tags and expression profiles10. SSTAR, an interconnected semantic tool, allows users to explore the relationships between genes, promoters, samples, transcription factors, transcription factor binding sites and coexpressed sets of promoters. These and other ways to access the data are described in more detail in Supplementary Note 1.
CAGE peak identification and thresholding
To identify CAGE peaks across the genome we developed decomposition-based peak identification (DPI; described in Supplementary Methods; Extended Data Fig. 1). This method first clusters CAGE tags based on proximity. For clusters wider than 49 base pairs (bp) it attempts to decompose the signal into non-overlapping sub-regions with different expression profiles using independent component analysis11. Sample-and genome-wide, DPI identified 3,492,729 peaks in human and 2,088,255 peaks in mouse. To minimize the fraction of peaks3 that map to internal exons (which could exist due to post-transcriptional cleavage and recapping of RNAs12), and enrich for TSSs, we applied tag evidence thresholds to define robust and permissive subsets (described in more detail in Supplementary Methods and summarized in Table 1). Specifically the robust threshold, which is used for most of the analyses presented here, enriched for peaks at known 5′ ends compared to known internal exons by twofold (that is, two-thirds of the peaks hitting known full-length transcript models hit the 5′ end). A flow diagram showing the relationship between samples, peaks, thresholding and subsets used in each analysis is provided in the Supplementary Figure 1. Supporting evidence that the peaks are genuine TSSs, based upon support from expressed sequence tags (ESTs), histone H3 lysine 4 trimethylation (H3K4Me3) marks and DNase hypersensitive sites is provided in Supplementary Note 2.
Table 1.
Summary of peaks, coverage and genes hit in FANTOM5
| Human
|
Mouse
|
|||||||||||||
|---|---|---|---|---|---|---|---|---|---|---|---|---|---|---|
| Peaks | Stranded genome coverage (bp) | Number of aligned reads | Genes hit | Peaks per gene | Peaks | Stranded genome coverage (bp) | Number of aligned reads | Genes hit | Peaks per gene | |||||
| The whole genome | – | 6.2 × 10⁹ | 100% | 4.5 × 10⁹ | 100% | – | – | – | 5.3 3109 | 100% | 1.9 × 10⁹ | 100% | – | – |
|
| ||||||||||||||
| ‘Permissive’ CAGE peaks | 1,048,124 | 1.4 × 10⁷ | 0.22% | 3.6 × 10⁹ | 80% | 20,808 | – | 652,860 | 8.4 3106 | 0.16% | 1.5 × 10⁹ | 79% | 20,480 | – |
| (A) Within 500bp of annotated 5′ | 245,514 | 4.3 × 10⁶ | 0.07% | 3.0 × 10⁹ | 68% | 20,808 | 11.8 | 146,185 | 2.5 3106 | 0.05% | 1.3 × 10⁹ | 69% | 20,480 | 7.1 |
| (B) TSS classifier positive | 217,572 | 4.0 × 10⁶ | 0.06% | 2.9 × 10⁹ | 64% | 18,503 | – | 129,466 | 2.4 3106 | 0.05% | 1.0 × 10⁹ | 52% | 17,088 | – |
| (A or B) Likely TSS | 308,214 | 5.3 × 10⁶ | 0.09% | 3.2 × 10⁹ | 72% | 20,808 | – | 173,564 | 3.0 3106 | 0.06% | 1.4 × 10⁹ | 70% | 20,480 | – |
|
| ||||||||||||||
| ‘Robust’ CAGE peaks | 184,827 | 3.9 × 10⁶ | 0.06% | 3.5 × 10⁹ | 77% | 18,961 | – | 116,277 | 2.5 3106 | 0.05% | 1.4 × 10⁹ | 75% | 19,001 | – |
| (A) Within 500bp of annotated 5′ | 82,150 | 2.2 × 10⁶ | 0.04% | 3.0 × 10⁹ | 66% | 18,961 | 4.3 | 61,134 | 1.6 3106 | 0.03% | 1.3 × 10⁹ | 68% | 19,001 | 3.2 |
| (B) TSS classifier positive | 76,445 | 2.1 × 10⁶ | 0.03% | 2.9 × 10⁹ | 63% | 17,285 | – | 51,611 | 1.4 3106 | 0.03% | 9.9 × 10⁸ | 51% | 16,028 | – |
| (A or B) Likely TSS | 92,783 | 2.4 × 10⁶ | 0.04% | 3.2 × 10⁹ | 70% | 18,961 | – | 77674 | 1.7 3106 | 0.03% | 1.3 × 10⁹ | 69% | 19,001 | – |
|
| ||||||||||||||
| Cross-species projected robust peaks | 70,351 | 1.6 × 10⁶ | 0.03% | – | – | – | – | 105,157 | 2.4 3106 | 0.04% | – | – | – | – |
| ’Homologous’ robust peaks | 34,041 | 1.0 × 10⁶ | 0.02% | – | – | – | – | 42,423 | 1.3 3106 | 0.02% | – | – | – | – |
Figure 1b illustrates the 266 bp spanning transcription initiation region of B4GALT1, where 6 independent robust peaks were identified by DPI, each with a unique regulatory pattern (Fig. 1c). A total of 58% of human and 56% of mouse robust peaks occur in such composite transcription initiation regions, defined as clusters of robust peaks within 100 bases of each other. More than half of these contain peaks with statistically significant differences in expression profiles (63% of human and 54% of mouse composite transcription initiation regions; likelihood ratio test, false discovery rate (FDR) < 1%, Extended Data Fig. 1d). Supplementary Tables 2 and 3 summarize public domain EST evidence that these independent peaks contained within composite transcription initiation regions give rise to long RNAs.
Known gene coverage in FANTOM5
To provide annotation of the CAGE peaks, the distance between individual peaks and the 5′ ends of known full-length transcripts was determined and then peaks within 500 bases of the 5′ end of known transcript models were assigned to that gene (see Supplementary Methods, Table 1). To provide names for each TSS region, peaks identified at the permissive threshold were ranked by the total number of tags supporting each and then sequentially numbered (for example, p1@GFAP corresponds to the promoter of GFAP which has the highest tag support). From these annotations, TSS for 91% of human protein coding genes (as defined by the HUGO Gene Nomenclature Committee) were supported by robust CAGE peaks, and 94% at the permissive threshold (Supplementary Note 3). The atlas also detected signals from the promoters of short RNA primary transcripts, and long non-coding RNAs. In comparison to the previous FANTOM3 and 4 projects, FANTOM5 measured expression at an additional 4,721 human and 5,127 mouse RefSeq genes. The inclusion of primary cells, cell lines and tissues in the atlas provided greater coverage than any of the sample types alone (Fig. 1d) and the primary cell samples in particular were a rich source of unannotated peaks (Fig. 1e).
Mammalian promoter architectures
Mammalian promoters can be classified as broad or sharp types, based upon local spread of TSSs along the genome13. The FANTOM5 data confirmed this general observation (Extended Data Fig. 2), however, for the first time the greater depth of sequencing enabled identification of the preferred TSS within broad promoters. Taking each library in turn, using the location of the dominant TSS (that is, the TSS with the highest number of tags), we searched for phased WW dinucleotides (AA/AT/TA/TT) associated with nucleosome location14 (Extended Data Fig. 2). Remarkably, on a genome-wide scale, there was a periodic spacing of WW motifs with a 10.5 bp repeat downstream of the dominant TSS, exactly as shown previously for well-phased H2A.Z nucleosomes14 (Extended Data Fig. 2d). The precise phasing was supported further by the pattern of H2A.Z and H3K4me3 chromatin immunoprecipitation sequencing (ChIP-seq) signal seen around TSS in CD14+ monocytes and frontal lobe respectively (Extended Data Fig. 2e, f). This observation indicates that the positioned nucleosome is a key indicator of start site preference in broad promoters.
Expression levels and tissue specificity
The raw tag counts under the DPI peak coordinates were used to generate an expression table across the entire collection. Normalized tags per million (TPM) were then calculated using the relative log expression (RLE) method in edgeR15. Almost all peaks (96%) were reproducibly detected above 1 TPM in at least two samples, but most were detected in less than half the samples. Examining the distribution of expression level and breadth across the collection, we classified the 185K robust human peak expression profiles as non-ubiquitous (cell-type-restricted, 80%), ubiquitous-uniform (‘housekeeping’, 6%) or ubiquitous-non-uniform (14%) (Fig. 2a, b). We define ubiquitous as detected in more than 50% of samples (median >0.2 TPM) and uniform as a less than tenfold difference between maximum and median expression. Estimation using the smaller mouse expression data set or human primary cell, cell line or tissue data subsets resulted in different fractions, yet in all cases ubiquitous-uniform expression profiles were in the minority (Extended Data Fig. 3a–e). Alternative measures such as richness index and Shannon entropy confirm that only a minor fraction of transcripts can be considered as genuine housekeeping genes with broad and uniform expression (Supplementary Note 4 and Supplementary Table 4 for a list of housekeeping genes). In addition many of the 1,225 known genes that were missed in the collection are known to be specifically expressed in cell types that are not easily procured; indicating that even more of the mammalian transcriptome has a cell-type-restricted expression pattern (Supplementary Note 3). In overview, the data confirm the argument that most genes are regulated in a tissue-dependent manner16. According to Gene Ontology enrichment analysis17 of genes within each of the three classes (Supplementary Table 5), the non-ubiquitous genes were enriched for proteins involved in cell–cell signalling, plasma membrane receptors, cell adhesion molecules and signal transduction, whereas genes in the housekeeping set were enriched for components of the ribonucleoprotein complex and RNA processing. The ubiquitous-non-uniform set was enriched for cell cycle genes, with 204 of the 268 human genes annotated with the ‘mitotic cell cycle’ term, a reflection of the fact that the fraction of actively proliferating cells inevitably varies greatly across the collection.
Figure 2. Cell-type-restricted and housekeeping transcripts encoded in the mammalian genome.
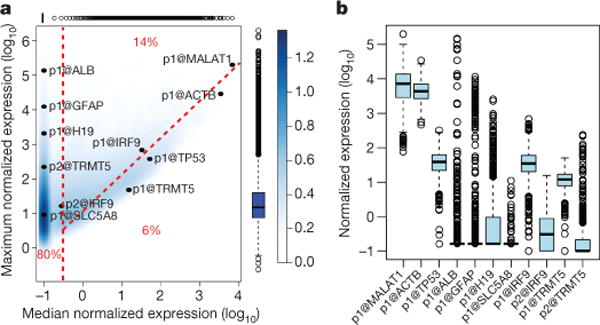
a, Density plot summarizing the distribution of relative log expression (RLE) normalized maximum and median TPM expression values for the 185K robustly detected human peaks identified by FANTOM5 (colour bar on right indicates relative density). Box and whiskers plots above and to right show distribution of median and maximum values in the data set (box shows the interquartile range). Promoters of named genes are highlighted to show extremes of expression level and expression breadth, note the alternative promoters of IRF9 and TRMT5 have different maximums and breadths of expression (see Extended Data Fig. 10). Fraction on left of the red vertical dashed line corresponds to peaks detected in less than 50% of samples with non-ubiquitous (cell-type-restricted) expression patterns (median < 0.2 TPM). Fraction below the red diagonal dashed line corresponds to ubiquitous-uniform (housekeeping) expression profiles (maximum < 10× median). Fraction above diagonal and to the right of the vertical dashed lines corresponds to ubiquitous-non-uniform expression profiles (maximum > 10× median). b, Box and whisker plots showing the distribution of expression levels for the same peaks as in a across the 889 samples (box shows the interquartile range).
Finally, of the 104, 859 peaks expressed at 10 TPM (~ 3 copies per cell18) or greater, an average primary cell sample expressed a median of 8, 757 including peaks for 430 transcription factor mRNAs (Extended Data Fig. 3f, g).
Promoter conservation between human and mouse
Regulatory regions such as transcription factor binding sites are often, but not always, located in conserved and orthologous regions19. Overall human TSSs were significantly enriched in evolutionarily conserved regions compared to the genome-wide null expectation, with 38% overlapping previously defined mammalian constrained elements (Fisher’s exact test, odds ratio 10.2, P value < 2.2 × 10⁻¹⁶; see Supplementary Methods). Despite this general level of conservation, there is evidence of extensive evolutionary remodelling of transcription initiation. For example, 43% (79,670 out of 184,476) of human TSSs could not be aligned to the mouse genome, and 39% (45,926 out of 116,277) of mouse TSSs could not be aligned to the human genome (Supplementary Methods). Alignment between species decayed as a function of neutral sequence divergence (Fig. 3). Housekeeping TSSs showed highest TSS conservation, whereas the TSSs of non-coding RNAs were less conserved than those of protein-coding TSSs. Indeed, the alignment of promoters of broadly expressed non-coding transcripts was not greatly different from randomly selected genomic sites (Fig. 3a). However, it is important to note that the random permutations inevitably overlap constrained elements, so cannot be considered representative of neutral evolution.
Figure 3. TSS conservation as a function of expression properties and functional annotation.
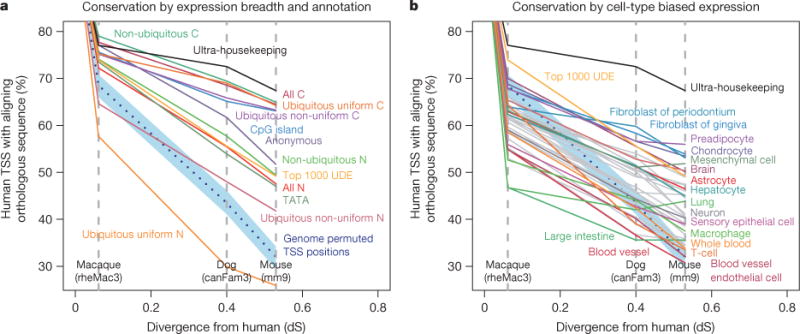
a, b, Human robust TSS coordinates were projected through EPO12 whole genome multiple sequence alignments (Supplementary Methods). The y-axis values show the fraction of human TSSs that align to an orthologous position in the indicated species. The x axis shows the relative divergence of macaque, dog and mouse genomes as the substitution rate at fourfold degenerate sites in protein coding sequence. The TSS locations were genome permuted (Supplementary Methods) and then projected through EPO12 alignments to give the null expectation (dashed blue line). The 95% confidence intervals of 1, 000 samples of 1, 000 TSS are shown (blue shading). a, TSS mapped to the 5′ ends of protein coding and non-coding transcripts are labelled (C and N, respectively), those that do not map to a known transcript 5′ end are shown as the ‘anonymous’ category. With the exception of anonymous, all robust TSSs represented in both panels are associated with the 59 ends of previously annotated transcripts. Non-ubiquitous (cell-type-restricted), ubiquitous-uniform (housekeeping) and non-uniform-ubiquitous were defined as in Fig. 2. Ultra-housekeeping TSSs were defined as those with less than fivefold difference between maximum and median. The category top 1000 UDE represents the 1,000 ubiquitous TSSs that are most differentially expressed4. There are 1,016 ultra-housekeeping TSSs, 276 ubiquitous-uniform non-coding TSSs and all other categories contain over 2, 000 TSSs. b, Same axes as panel a showing TSSs with expression that is biased towards a single expression facet (larger mutually exclusive grouping of the primary cell and tissue samples based on the sample ontologies CO and UBERON, defined in ref. 4). Only expression facets with greater than 250 enriched TSSs are shown. For clarity, only a subset of expression facets are coloured and labelled.
TSSs that were highly-restricted or biased in their expression to a single cell type or tissue were more likely to be gained or lost through evolution (Fig. 3a). TSSs preferentially expressed in fibroblasts, chondrocytes and pre-adipocytes were among the most conserved, whereas those enriched in T-cells, macrophages, dendritic cells, whole blood and endothelial cells were the most likely to be gained or lost (Fig. 3b). This suggests a more rapidly evolving immune system. It also suggests contributions of relaxed constraint and positive selection to the remodelling of transcription initiation through the insertion and deletion of promoter sequences.
To enable comparative analysis, we projected the expression patterns from one species to the other (Extended Data Fig. 4) and provide the peak position and orthologous expression profile through a cross-species track in ZENBU10. Only 54% and 61% of human and mouse conserved TSSs (of protein coding genes) had an orthologous peak in the other species. This increased to 61% and 63% respectively for TSSs from well matched samples (for example, human and mouse hepatocytes), however, surprisingly, almost 40% of conserved TSS do not appear to be used even in the matched cells (Supplementary Table 6).
Features of cell-type-specific promoters
Carrying out a systematic de novo motif discovery analysis in cell-type-specific promoters, recovered motifs similar to the binding motifs of transcription factors known to be relevant to the corresponding cellular states (Extended Data Fig. 5a–c and described in Supplementary Note 5). Examining general promoter features many CpG island (CGI) based promoters (54%) and most non-CGI-non-TATA promoters (92%) had non-ubiquitous expression profiles (Extended Data Fig. 3k–n). Although CGI promoters are generally associated with housekeeping genes, we observed a subset with highly cell-type-restricted expression profiles (right tail of Extended Data Fig. 6a). Examining CGI and non-CGI promoters separately we find that cell-type-specific promoters of both classes were enriched for binding of cell-type-specific transcription factors (evidenced by over-representation of motifs and bound sites in public ChIP-seq data sets). For the human hepatocellular carcinoma cell line HepG2 we observed enrichment of liver-specific transcription factors (HNF4, FOXA2, and TCF7L2) at both CGI and non-CGI HepG2 specific promoters (Extended Data Fig. 6b, c; similar examples are shown in Extended Data Figs 5d and 7). As noted in the accompanying analysis4, both cell-type-specific CGI and non-CGI promoters tend to have proximal high-specificity enhancers (Extended Data Fig. 6d). This indicates that specific expression at CGI promoters uses the same type of signals as non-CGI promoters: proximal transcription factor motifs and high-specificity enhancers.
Of note, a small number of highly abundant RNAs account for 20% or more of the reads in some libraries: HBB, SMR3B, STATH, PRB4, CLPS, HTN3, SERPINA1, CTRB2, CPB1, CPA1 and MALAT1. Although the abundance of these transcripts is a function of their relatively stability as well as rate of initiation, a modest but significant over representation of ETS and YY1 sites was found in highly expressed promoters compared to weakly expressed ones (Extended Data Fig. 5g). Although the different motif composition may contribute to expression levels, the accompanying manuscript4 shows that arrays of enhancers with similar usage20 probably contribute to the higher maximal expression rate.
Key cell-type-specific transcription factors
Among 1,762 human and 1,516 mouse transcription factors compiled from the literature21–23, promoter level expression profiles for 1,665 human transcription factors (94%) and 1,382 mouse transcription factors (91%) were obtained (Supplementary Tables 7, 8 and 9 and Supplementary Note 6). The distribution of expression levels and cell-type or tissue-specificity of transcription factors (Extended Data Fig. 3f–j) and the number of robust promoter peaks per transcription factor gene was similar to coding genes in general (4.8 compared to 4.6). In any given primary cell type, a median of 430 (306 to 722) transcription factors were expressed at 10 TPM or above (~ 3 copies per cell based on 300,000 mRNAs per cell18) (Extended Data Fig. 3g).
Clustering transcription factors by expression profile revealed sets of transcription factors specifically enriched in each cell type (Extended Data Fig. 8). For each primary cell sample we have made available ranked lists of transcription factors based on their promoter expression in the sample relative to the median across the collection (http://fantom.gsc.riken.jp/5/sstar/Browse_samples). For most cell types we found one transcription factor that was very highly enriched (≥100-fold), 23 highly enriched transcription factors (≥ tenfold) and 82 moderately enriched transcription factors (≥ fivefold) (numbers of transcription factors are based on median number of transcription factors observed at each enrichment threshold across the primary cell samples). To demonstrate their likely relevance we systematically reviewed phenotypes of transcription factor knockout mice at the MGI (see Supplementary Note 7). The clear connection between tissue-specific expression profiles and relevant knockout phenotypes is summarized in Supplementary Table 10. For example, in mouse inner ear hair cells, knockout of six of the top 20 most enriched transcription factor genes in mouse (Pou3f4 (ref. 24), Sox2 (ref. 25), Egr2, Six1 (ref. 26), Fos27, Tbx18 (ref. 28)) as well as patient mutations in a further four top transcription factor genes (POU4F3 (ref. 29), ZIC2 (ref. 30), SOX10 (ref. 31), FOXF2 (ref. 32)) resulted in hearing-related defects. Similarly, mouse knockouts or patients with mutations in the transcription factors enriched in osteoblasts (CREB3L1 (ref. 33), DLX5 (ref. 34), EBF2 (ref. 35), HAND2 (ref. 36), HOXC5 (ref. 37), NFIX38, PRRX1 (ref. 39), PRRX2 (ref. 40), SIX1 (ref. 41), TWIST1 (ref. 42), SHOX43, Six2 (ref. 44)) had bone and osteoblast phenotypes. A substantial fraction of top transcription factors (61% of mouse and 40% of human transcription factors) have relevant phenotypes recorded in knockout mice (Supplementary Table 10).
Inferring function from expression profiles
Taking a pair-wise Pearson correlation matrix of the promoter expression profiles we carried out MCL clustering45 (Supplementary Methods) to group promoters that share similar expression profiles across the atlas. Figure 4 shows a graphical overview of the structure of the data (and the mouse counterpart is shown in Extended Data Fig. 9). We find 6,030 cases of named genes with alternative promoters participating in two or more coexpression clusters (Extended Data Fig. 10). To evaluate and annotate these coexpressed groups, we tested for enrichment in specific Gene Ontology terms and in a curated database of 489 biological pathways. Of these, 356 pathways (174 KEGG, 114 WikiPathways, 46 Reactome, 22 Netpath) were significantly enriched in at least one human coexpression group (FDR < 0.05). Using this approach, 38% of the unannotated robust peaks (35,082 out of 91,269) were within a cluster with a significant association to a pathway. The annotated coexpression groups are summarized in the website (http://fantom.gsc.riken.jp/5/sstar/Browse_coexpression_clusters) and a detailed example identifying genes putatively involved in influenza A pathogenesis is shown in Extended Data Fig. 10a.
Figure 4. Coexpression clustering of human promoters in FANTOM5.
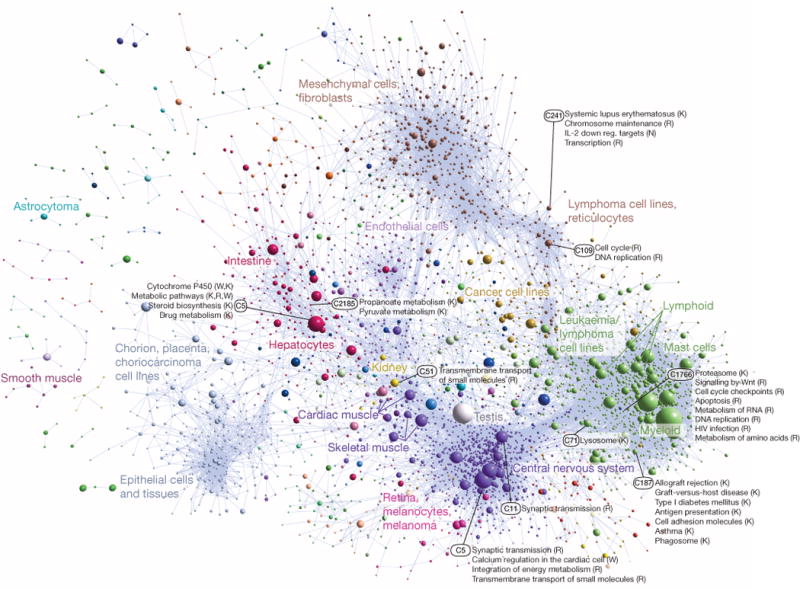
Collapsed coexpression network derived from 4,882 coexpression groups (one node is one group of promoters; 4,664 groups are shown here) derived from expression profiles of 124,090 promoters across all primary cell types, tissues and cell lines (visualized using Biolayout Express3D (ref. 45), r > 0.75, MCLi = 2.2). For display, each group of promoters is collapsed into a sphere, the radius of which is proportional to the cube root of the number of promoters in that group. Edges indicate r > 0.6 between the average expression profiles of each cluster. Colours indicate loosely-associated collections of coexpression groups (MCLi = 1.2). Labels show representative descriptions of the dominant cell type in coexpression groups in each region of the network, and a selection of highly-enriched pathways (FDR < 10−4) from KEGG (K), WikiPathways (W), Netpath (N) and Reactome (R). Promoters and genes in the coexpression groups are available online at (http://fantom.gsc.riken.jp/5/data/).
Introducing sample ontology enrichment analysis (SOEA), we show that expression profiles can also be associated with cell, anatomical and disease ontology terms by testing for overrepresentation of terms in ranked lists of systematically annotated samples expressing each peak (Extended Data Fig. 11 and Supplementary Methods). Novel peaks can be annotated in this way. For example, an un-annotated DPI peak at hg19::chr18:3659943.3659972, + is linked to the terms classical monocyte (CL:0000860; P value = 6.35 × 10−124, Extended Data Fig. 11h) and bone marrow (UBERON:0002371; P value = 2.7 × 10−80). Manual examination of the profile confirms the transcript is predominantly expressed in myeloid cells with higher levels in CD14+ monocytes. Applied to all CAGE peaks, 127,645 human and 44,449 mouse robust peaks were annotated as enriched in at least one CL, DOID or UBERON term (Extended Data Fig. 11i, j). The most commonly-enriched terms at a P value threshold of 10−20 were classical monocyte (CL:0000860; 26,634 peaks, 14%), bone marrow (UBERON:0002371; 22,387 peaks, 12%) and neural tube (UBERON:0001049; 20,484 peaks, 11%) (Supplementary Table 13). This is consistent with the coexpression clustering in Fig. 4 (green and purple spheres correspond to leukocyte and central nervous system enriched expression profiles) and indicates that a large fraction of the mammalian genome is dedicated to immune and nervous system specific functions.
Conclusion
The FANTOM5 promoter atlas is a natural extension of earlier maps of active transcripts and promoters complementing the sequencing of mammalian genomes46, 47. It represents an advance in an order of magnitude in the wide range of cell types and the amount of data produced per sample, and using single-molecule sequencing avoided polymerase chain reaction (PCR), digestion and cloning bias48. We have identified and quantified the activity of at least one promoter for more than 95% of annotated protein-coding genes in the human reference genome; only the activity of 1,225 promoters remains uncharacterized. Some of these may not actually be expressed. Some cannot be unambiguously measured with CAGE due to copy number variants or closely related multigene families. The remaining promoters are probably expressed in rare cell types or during windows of development or states of cellular activation that are not readily accessible and remain to be sampled. A continued effort to add profiles from these cells will make it possible to integrate them with the FANTOM5 data, and to extract metadata to identify those regulatory elements that are new and lineage-specific.
The FANTOM5 data highlights the value in profiling primary cells as opposed to whole tissues. It also highlights the weakness of using cancer cell lines. The cancer cell lines generally fail to cluster in a sample-to-sample correlation graph with their supposed cell type or tissue of origin (Extended Data Fig. 12) and express more transcription factors than primary cells (Extended Data Fig. 3g). The mutations and chromosomal rearrangements that occur in cancer result in unique transcriptional networks that do not exist in the untransformed state and do not necessarily generalize across multiple tumours of the same type. In terms of building mammalian transcriptional regulatory network models that reflect the normal untransformed state, primary cells are the logical choice. They have normal genomes, and express in the order of 430 transcription factors at appreciable levels, ranking of which can be used to reduce the complexity further and identify key known regulators of cellular phenotypes. Focusing on these key regulators and motif searching in the corresponding cell-type-specific promoters provides the data to build cell-type-specific regulatory network models and support a rational approach to identification of drivers required to reprogram cells from one lineage to another. Promoter-based expression data also has direct practical applications in the interpretation (and re-interpretation) of the function of single nucleotide polymorphisms (SNPs) in genome-wide association studies (GWAS), which commonly occur in non-coding sequences. In accompanying manuscripts, reanalysis of several GWAS data sets uncovered new disease associations in FANTOM5 promoters and identification of regulatory SNPs within enhancers that were active in medically relevant samples (ref. 4 and manuscript in preparation). Accordingly, the data will enable the design of genotyping arrays and sequence-capture systems to target regulatory variation, and the design of promoter constructs allowing researchers to specify the cell-type-specificity and absolute expression levels of their constructs (particularly for Cre-conditional knockouts49 and gene therapy vectors50). In all these respects, the FANTOM5 data set greatly extends the data generated by ENCODE5 to further our knowledge of genome function.
METHODS SUMMARY
All Methods are described in full in the Supplementary Information.
Extended Data
Extended Data Figure 1. Decomposition-based peak identification (DPI).
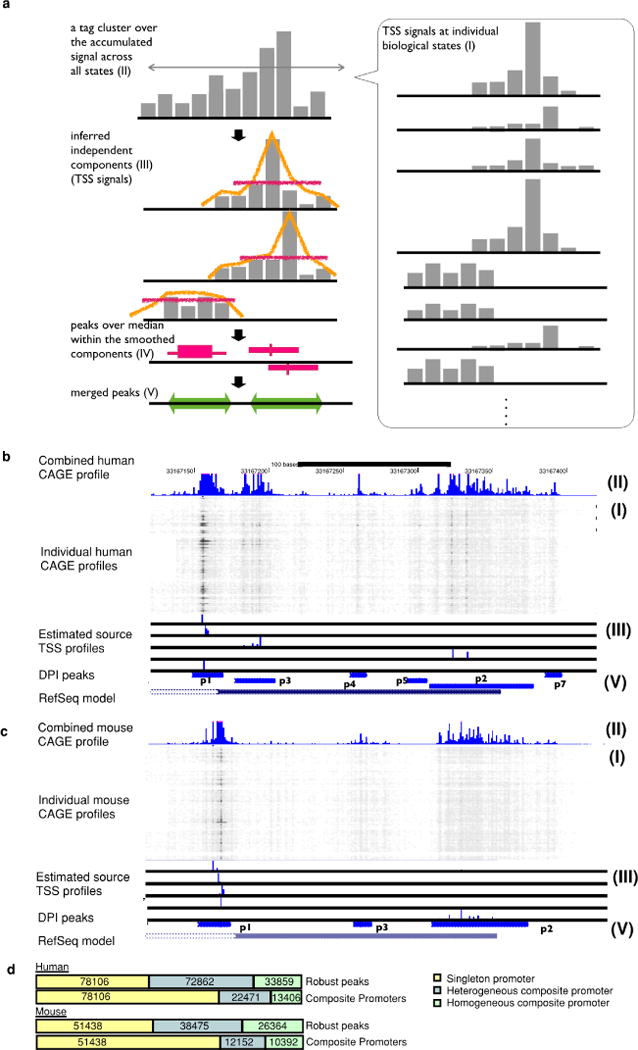
a, Schematic representation of each step in the peak identification. This starts from CAGE profiles at individual biological states (I), subsequently defines tag clusters (consecutive genomic region producing CAGE signals) over the accumulated CAGE profiles across all the states (II). Within each of the tag cluster, it infers up to five underlying signals (independent components) by using ICA independent component analysis (ICA) (III). It smoothens each of the independent components and finds peaks where signal is higher than the median (IV). The peaks along the individual components are finally merged if they are overlapping each other (V). b, c, Genomic view of actual examples (B4GALT1 locus) for human and mouse. CAGE profiles across the biological states (I) are shown as a greyscale plot, in which the x axis represents the genomic coordinates and individual rows represent individual biological states. Dark (or black) dots indicate frequent observation of transcription initiation (that is, larger number of CAGE read counts) and light dots (white) indicate less frequency. The blue histogram on the top indicates the accumulated CAGE read counts, and the entire region shown represents a single tag cluster (II). The histograms below the greyscale plot indicate the independent components of the CAGE signals inferred by ICA (III), and the resulting CAGE peaks are shown at the blue bars closest to the bottom (V). The bottom track indicates a gene model in RefSeq. The figures overall indicate that only one TSS is defined by RefSeq gene models in this locus, however, transcription starts from slightly different regions depending on the context, and the DPI method successfully captured the different initiation events. d, Breakdown of singleton and composite transcription initiation regions with homogenous or heterogeneous expression patterns according to likelihood ratio test (see Supplementary Methods).
Extended Data Figure 2. Broad and sharp promoters.
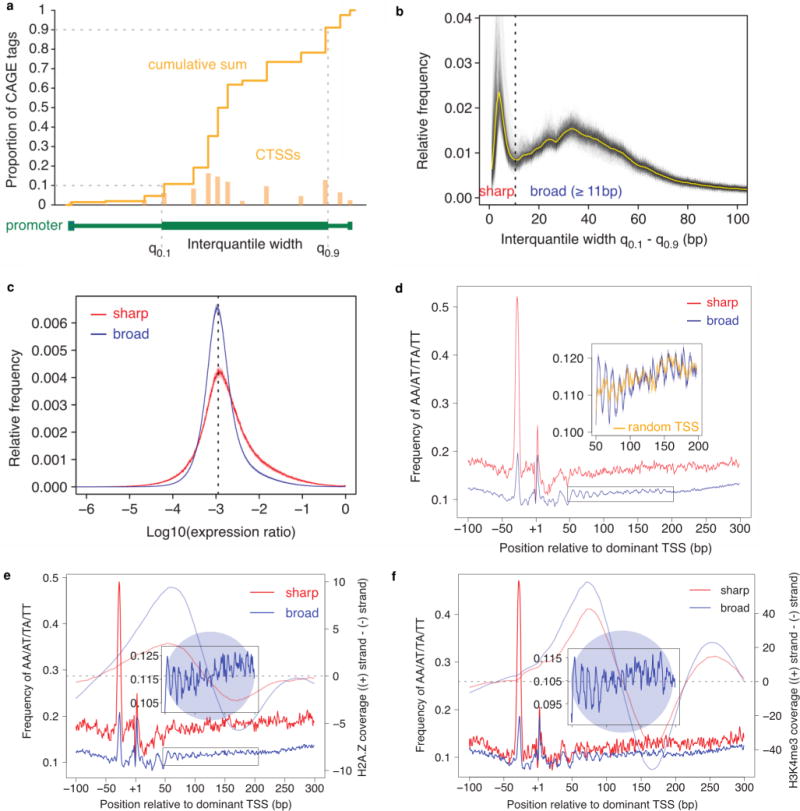
DPI peaks from the permissive set were aggregated by grouping neighbouring peaks less than 100 bp apart. Cumulative distribution of CAGE signal along each region was calculated and positions of 10th and 90th percentiles were determined. a, Schematic representation of CAGE signal within promoter region and calculation of interquantile width. Signal from CAGE transcription start sites (CTSS) is shown. Distance between these two positions (interquantile width) was used as a measure of promoter width. b, Distribution of promoter interquantile width across all 988 human samples. Individual grey lines show distribution in each sample and the average distribution is shown in yellow. For each sample only promoters with > = 5 TPM were selected. Distribution of obtained interquantile width was clearly bimodal and allowed us to set the empirical threshold at 10.5 bp that separates the best sharp from broad promoters. c, Distribution of expression specificity. The distribution of log ratios of expression in individual samples against the median expression across all samples is shown separately for sharp and broad promoters. Solid line shows the average distribution for all samples and the semi-transparent band denotes the 99% confidence interval. The dashed line corresponds to an expected log ratio if all samples contributed equally to the total expression. d, Average frequency of AA/AT/TA/TT (WW) dinucleotides around dominant TSS of sharp (red) and broad (blue) promoters across all human samples. Lines show the average signal and semi-transparent bands indicate the 99% confidence interval. Closer view of WW dinucleotide frequency displaying 10 bp periodicity is shown in the inset and indicates the likely position of the +1 nucleosome. For comparison, the signal aligned to randomly chosen TSS in broad promoters is shown in orange. e, As in a but for promoters in CD14+ monocytes. H2A.Z signal (subtracted coverage − plus strand coverage − minus strand coverage) around sharp and broad promoters is shown in corresponding semi-transparent colours (data from ref. 51). Transition point in subtracted coverage from positive to negative values indicates the most likely position of the nucleosome (shown as semitransparent blue circle) centre. f, As in b but for promoters in frontal lobe. H3K4me3 signal (subtracted coverage = plus strand coverage – minus strand coverage) around sharp and broad promoters is shown in corresponding semi-transparent colours (data from ref. 52).
Extended Data Figure 3. Density plots of DPI peaks maximum and median expression.
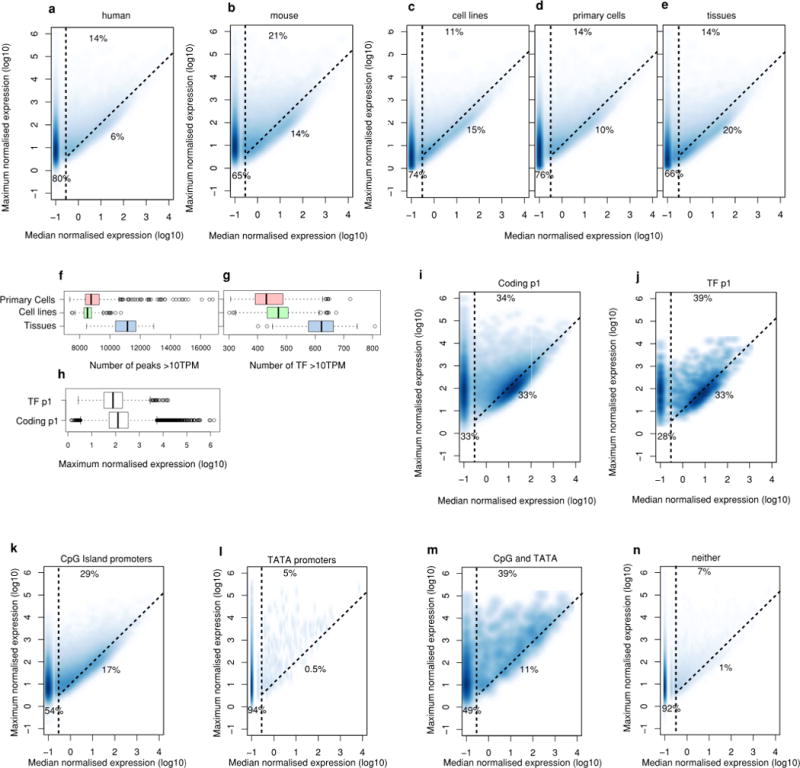
a, Distribution for all human robust peaks. b, Distribution for all mouse robust peaks. Fraction on left of vertical dashed line corresponds to peaks with non-ubiquitous (cell-type-restricted) expression patterns (median < 0.2 TPM). Fraction below the diagonal dashed line corresponds to ubiquitous-uniform (housekeeping) expression profiles (less than tenfold difference between maximum and median). Fraction in top-middle corresponds to ubiquitous-non-uniform expression profiles (maximum > tenfold median). c–e Show distibutions based on cell line, primary cell and tissue data, respectively. The mixture of cells in tissues may overestimate the fraction of ubiquitously expressed genes. f, Boxplot showing the number of peaks and detected > = 10 TPM in primary cells, cell lines or tissues. g, As in a but showing transcription factor p1 peaks only. h, Boxplot showing maximum expression of the main promoter for transcription factors or all coding genes. i, Density plots of human robust DPI peaks maximum and median expression for the main promoter of coding genes. j, As in d but showing the main promoter of transcription factors. Fraction on the left of the vertical dashed line corresponds to peaks with non-ubiquitous (cell-type-restricted) expression patterns (median < 0.2 TPM). Fraction below the diagonal dashed line corresponds to ubiquitous-uniform (housekeeping) expression profiles (less than tenfold difference between max and median). Fraction above the diagonal and to the right of the vertical dashed lines corresponds to ubiquitous-non-uniform expression profiles (maximum > tenfold median). k, Distribution for peaks with CpG island only (n = 55,897). l, Distribution for peaks with only a TATA motif (n = 3,933). m, Distribution for peaks with both CpG islands and TATA box motifs (n = 834). n, Distribution for DPI peaks with neither a TATA motif nor CpG island (n = 124,152). Fraction on the left of the vertical dashed line corresponds to peaks with non-ubiquitous (cell-type-restricted) expression patterns (median < 0.2 TPM). Fraction below the diagonal dashed line corresponds to ubiquitous-uniform (housekeeping) expression profiles (less than tenfold difference between max and median). Fraction above diagonal and to right of vertical dashed lines corresponds to ubiquitous-non-uniform expression profiles (maximum > tenfold median).
Extended Data Figure 4. Cross-species projected super-clusters.
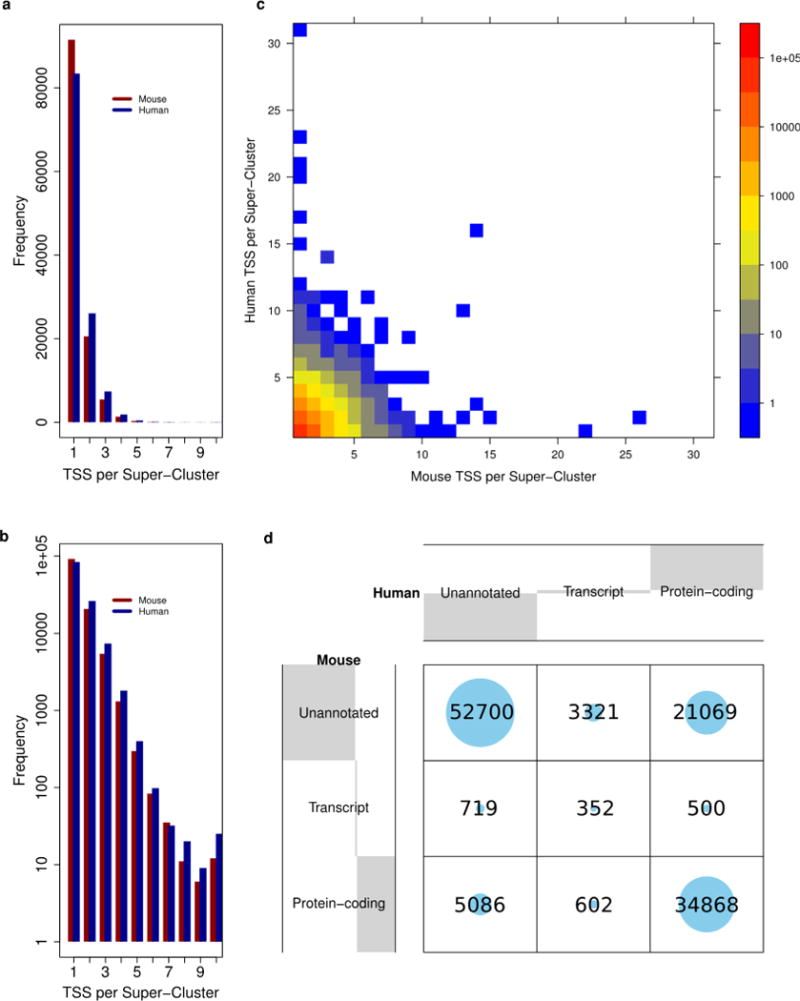
a, The number of mouse and human TSSs (both permissive and robust) per projected super-cluster. b, Same data as presented in panel a, with the y axis on a log scale. There is a slight tendency for more human TSSs per super-cluster than mouse TSSs. c, The number of human and mouse TSSs per projected super-cluster, density of data points indicated by log-scaled colour gradient shown on the right. Most super-clusters contain < = 4 DPI defined TSSs in both species. d, Evaluating the conservation of TSS annotation between species. Projected super-clusters are annotated by the most functional contributing TSS from each species (see Methods). Grey shading in the margins summarizes the proportion of super-clusters with each category of annotation in both mouse (y axis) and human (x axis). Numbers and volumes of circles represent counts of projected super-clusters, for example there are 34,868 super-clusters in which > = 1 human and > = 1 mouse component TSS are annotated as protein coding and 719 super-clusters in which the human TSSs are unannotated and at least one of the mouse TSSs are annotated as the 5′ end of a non-coding transcript.
Extended Data Figure 5. De novo derived, cell-state-specific motif signatures.
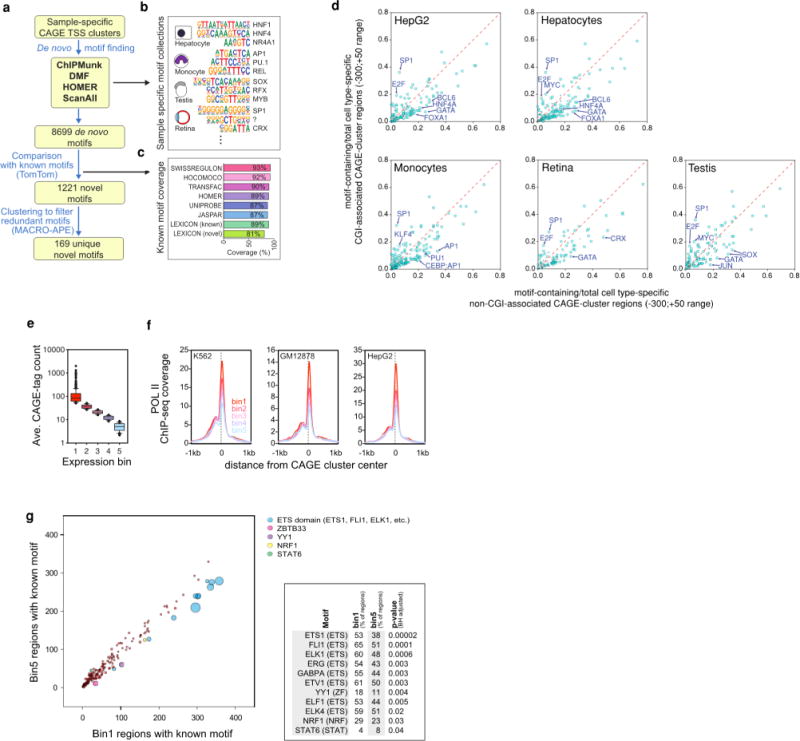
a–c, The de novo motif discovery tools DMF, HOMER, ChIPMunk and ScanAll were applied to detect sequence motifs enriched in the vicinity of sample-specific peaks (a), yielding 8,699 de novo motifs (b). The coverage of known motif space by the de novo motifs was evaluated by comparing them to the SWISSREGULON, HOCOMOCO, TRANSFAC, HOMER, JASPAR, and ENCODE LEXICON motif collections. c, The remaining 1,221 de novo motifs that were not similar to known motifs were then clustered using MACRO-APE, resulting in 169 unique novel motifs. d, Known motifs from the HOMER database were annotated and counted in around cell-type-specific TSSs (−300 to +50 bp) associated with CpG islands (CGI) or non-CGI regions. e–g, RNA Pol II ChIP-seq signal and motif finding in ‘housekeeping gene’ promoters with different absolute expression levels. Human housekeeping gene promoters were defined as (log10(max + 0.1) − log10(median + 0.1) < = 1). The resulting clusters were then extended by −300 and +50. Overlapping extended clusters were removed by only keeping those with the highest expression. e, Extended clusters were then split into 5 equal sized bins with decreasing absolute expression. f, RNA Pol II occupancy at binned clusters in ENCODE cell lines (highly expressed genes show the highest occupancy, but even bin5 clusters showing very low tag counts are still highly occupied). g, Bubble plot representation comparing known motif enrichments in bin1 (high expression) and bin5 (low expression) extended CAGE clusters. The bubble plots encode two quantitative parameters per motif: difference in motif occurrence between bin1 (x axis) and bin5 (y axis) as well as the adjusted P values for enrichment (bubble diameter). Colouring indicates significantly differentially distributed motifs (5% FDR). The right panel additionally summarizes the fraction of clusters in each bin that contain the indicated motifs along with the Benjamini Hochberg adjusted hypergeometric P value for differential enrichment.
Extended Data Figure 6. Features of cell-type-specific promoters.
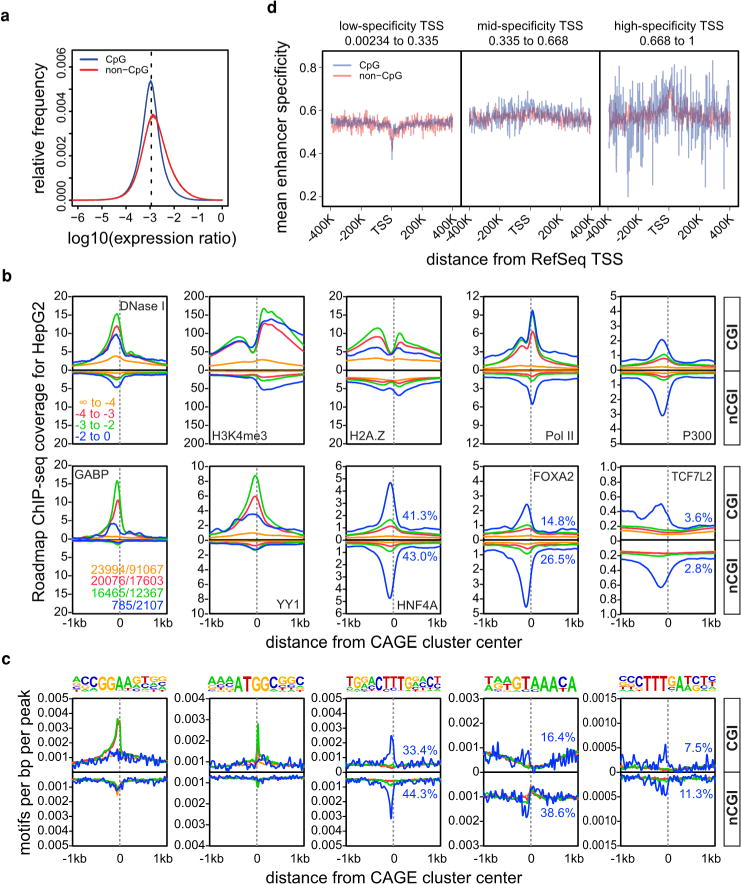
a, The distribution of expression log ratios of all individual samples against the median of all samples is shown separately for CGI-associated and non-CGI-associated CAGE clusters. The dashed line corresponds to an expected log ratio if all samples contribute equally to the total expression. b, Histograms for genomic distance distributions of HepG2 DNase I hypersensitivity, H3K4me3, H2A.Z, POL2, P300, GABP, YY1, HNF4A, FOXA1 and FOXA2 ChIP-seq tag counts centred across CGI-associated and non-CGI-associated CAGE clusters (separated according to expression specificities) across a 2 kilobase (kb) genomic region. Expression specificity bins are colour-coded (as indicated in the DNase I panel) with blue representing the highest degree of specificity. Numbers of regions in bins are given in the GABP panel (CGI no. / nCGI no., colour coding as above). c, Histograms for genomic distance distributions of ChIP-seq-derived sequence motifs for GABP, YY1, HNF4A, FOXA1 and FOXA2 (corresponding to the samples in the lower panel of c) centred across CGI-associated and non-CGI-associated CAGE clusters (separated according to expression specificities) across a 2 kb genomic region. Motifs are shown on top. The percentage of promoters overlapping with ChIP-seq peaks (b) or consensus sequences (c) for transcription factors binding the highest specificity clusters (HNF4A, FOXA2, TCF7L2) is also given in blue. d, Plots showing mean expression specificity (high values indicate more constrained expression over cells, see the accompanying manuscript4) in enhancers close to RefSeq promoters as a function of promoter CpG content and three classes of promoter expression specificity.
Extended Data Figure 7. Extended features of cell-type-specific promoters.
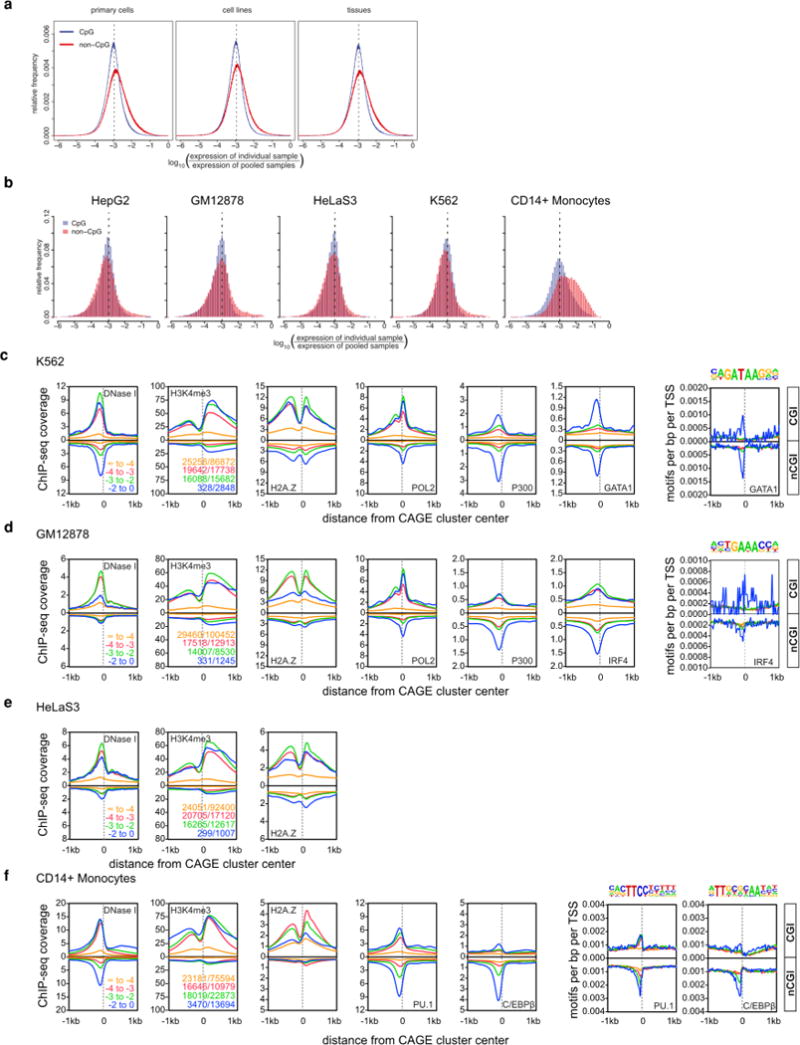
a, Distribution of global expression specificity estimated using primary cells, cell lines or tissues only. b, Distribution of expression specificity for HepG2, GM12878, HeLaS3, K562 and CD14+ monocytes (distribution of expression log ratios of all individual samples against the median of all samples is shown separately for CGI-associated and nonCGI-associated CAGE clusters. The dashed line corresponds to an expected log ratio if all samples contribute equally to the total expression). c, Histograms for genomic distance distributions of K562 DNase I hypersensitivity, H3K4me3, H2A.Z, POL2, P300, GATA1 ChIP-seq tag counts centred across CGI-associated and non-CGI-associated CAGE clusters (separated according to expression specificities) across a 2 kb genomic region. Expression specificity bins are colour-coded with blue representing the highest degree of specificity. d, DNase I hypersensitivity, H3K4me3, H2A.Z, POL2, P300 and IRF4 in GM12878. e, DNase I hypersensitivity, H3K4me3, H2A.Z in HeLaS3. f, DNase I hypersensitivity, H3K4me3, H2A.Z, PU.1 and CEBPB in CD14+ monocytes.
Extended Data Figure 8. Transcription factor promoter expression profile clustering.
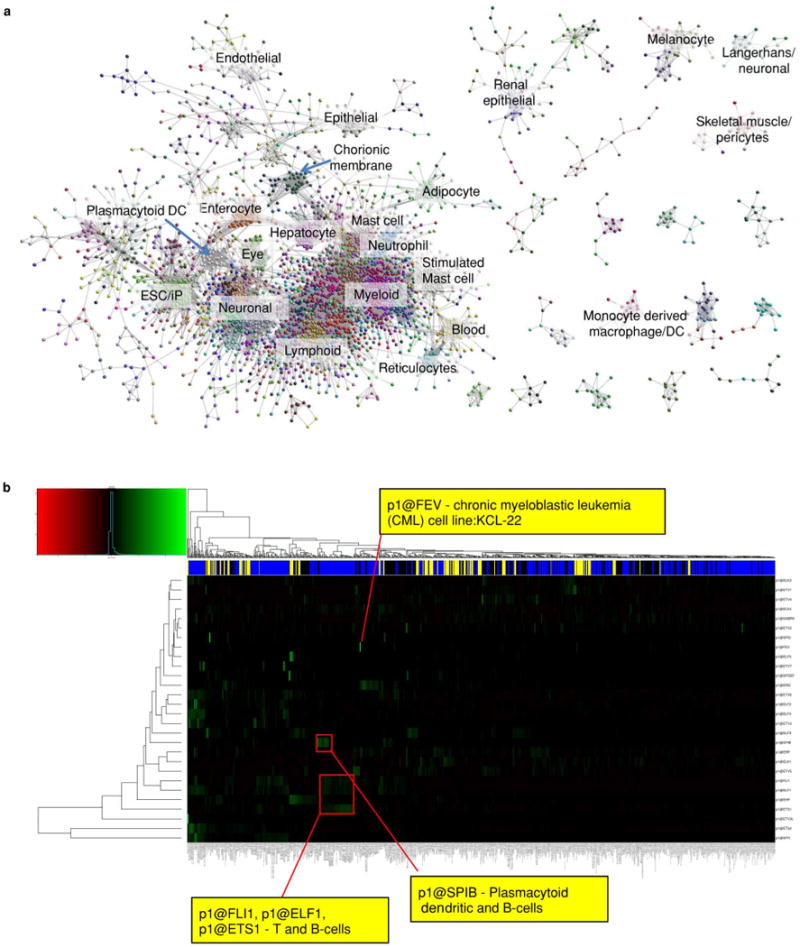
a, Biolayout visualization of transcription factor coexpression in human primary cells (3,775 nodes, 54,892 edges r > 0.70, MCL2.2). b, Hierarchical coexpression clustering and heatmap of ETS family transcription factors across the entire human collection (only promoter1(p1) data shown).
Extended Data Figure 9. Collapsed coexpression network for mouse coexpression groups.
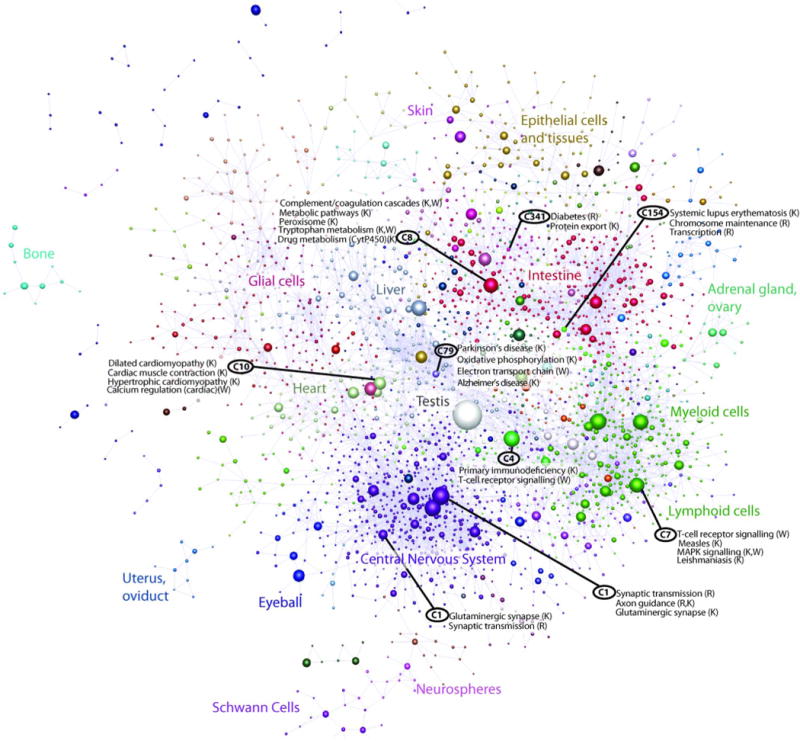
One node is one group of promoters. Derived from expression profiles of 116, 277 promoters across 402 primary cell types, tissues and cell lines (r > 0.75, MCLi = 2.2). For display, each group of promoters is collapsed into a sphere, the radius of which is proportional to the cube root of the number of promoters in that group. Edges indicate r > 0.6 between the average expression profiles of each cluster. Colours indicate loosely-associated collections of coexpression groups (MCLi = 1.2). Labels show representative descriptions of the dominant cell type in coexpression groups in each region of the network, and a selection of highly-enriched pathways (FDR < 10−4) from KEGG (K), WikiPathways (W), Netpath (N) and Reactome (R).
Extended Data Figure 10. Annotated expression profiles of alternative promoters.
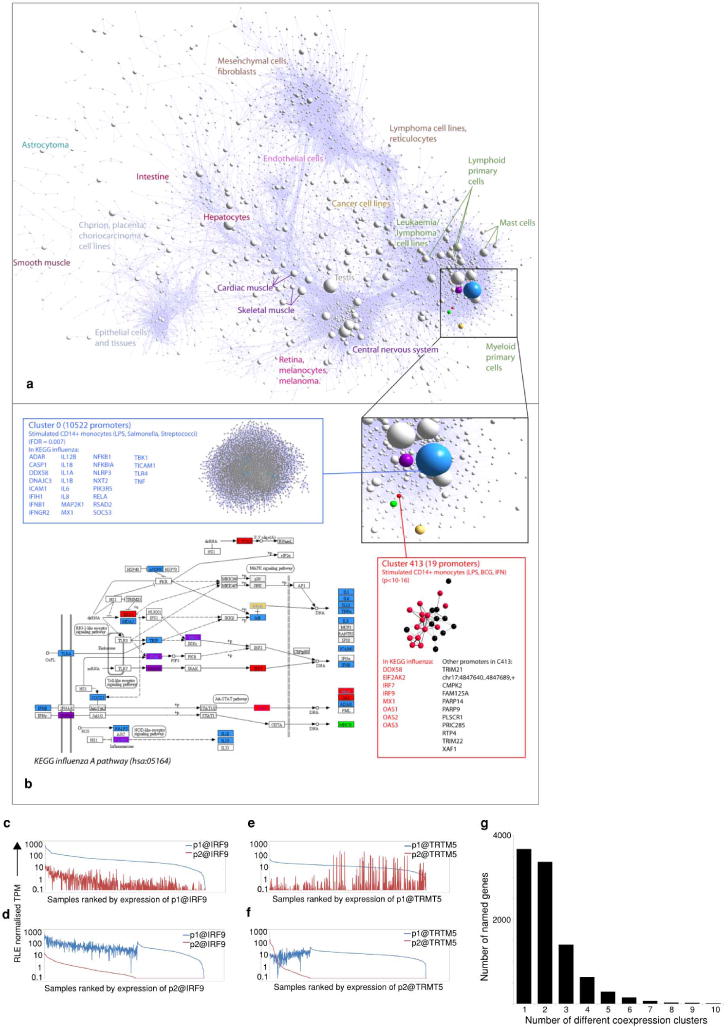
Overlay of coexpression groups enriched for genes involved in the KEGG pathway for influenza A pathogenesis (hsa:05164; FDR < 0.1, n > 2). a, Collapsed coexpression network showing 5 groups enriched for influenza pathogenesis genes: C0 (blue), C26 (purple), C61 (yellow), C187 (green) and C413 (red). b, Excerpt from KEGG pathway diagram showing positions of genes in each coexpression group (background colours as in a). Pathway entities that map to two coexpression groups have the background colour of the smaller group, and the text/border colour of the larger group. Details and promoter-level displays (edges indicate r > 0.75) for two coexpression groups are displayed with transcripts mapping to KEGG pathway highlighted (inset). In this example the KEGG pathway for influenza A pathogenesis (hsa:05164) was strikingly over-represented in one small coexpression group in particular (C413, P value < 10−11, FDR = 4.5 × 10⁻¹⁰). Of 19 promoters in coexpression group 413, eight were present in the KEGG pathway, including RIG-I (DDX58), the gene encoding the receptor for the mitochondrial antiviral signalling pathway53. Four of the remaining genes (TRIM21, TRIM22, RTP4 and XAF1) were found to be key host determinants of influenza virus replication in a high-throughput short interfering RNA (siRNA) screen54, whereas another, PLSCR1, is required for a normal interferon response to influenza A55. The top five transcription factor expression profiles most correlated with C413 were IRF7, IRF9, STAT1, SP100 and ZNFX1, and from motif enrichment analysis, the most frequent motifs found in promoters of cluster C413 were potential IRF-binding motifs. c, p1@IRF9 and p2@IRF9 expression ranked by the ubiquitously expressed p1@IRF9 promoter. d, As in a but ranked by expression of p2@IRF9. e, f, Similar to a and b but showing expression of p1@TRMT5 (housekeeping profile) and p2@TRMT5 (expressed in pathogen challenged monocytes). g, Histogram showing the number of different coexpression clusters (see Fig. 4) in which named genes with alternative promoters participate. The majority of genes with alternative promoters participate in more than one cluster; 17 genes participate in more than 10 different clusters and are not shown on this graph.
Extended Data Figure 11. Sample ontology enrichment analysis (SOEA).
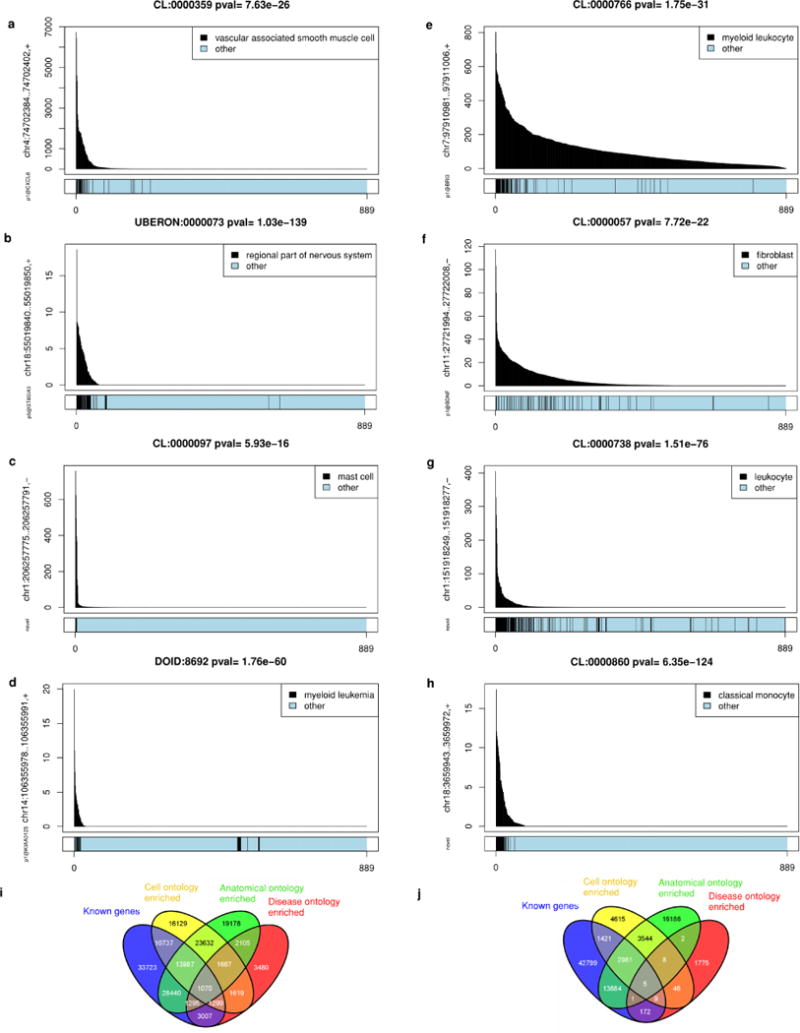
Expression profile-sample ontology associations were tested by Mann–Whitney rank sum test to identify cell, disease or anatomical ontology terms over-represented in ranked lists of samples expressing each peak. a, p1@CXCL6 enriched in vascular associated smooth muscle cells. b, p5@ST8SIA3 enriched in brain tissues. c, Novel peak enriched in mast cells. d, p1@KIAA0125 enriched in myeloid leukaemia. e, p1@BRI3 enriched in myeloid leukaemia. f, p1@BDNF enriched in fibroblasts. g, Novel peak enriched in leukocytes. h, Novel peak enriched in classical monocytes. i, j, Venn diagrams showing degree of overlap between peaks associated to known genes (blue), cell ontology enriched (yellow), Uberon anatomical ontology enriched (green) and disease ontology (red). i, At a threshold of 10−20 (Mann–Whitney rank sum test), 64% (59, 835 out of 93, 558) of the expression profiles of human known transcripts and 74% (67, 810 out of 91, 269) of the expression profiles for novel transcripts show enrichment for one or more sample ontologies. j, Mouse sample ontology enrichment 10−20 threshold. 30% (18, 273 out of 61, 134) known are enriched and 47% (26, 176 out of 55, 143) novel are enriched.
Extended Data Figure 12. Sample-to-sample correlation graph.
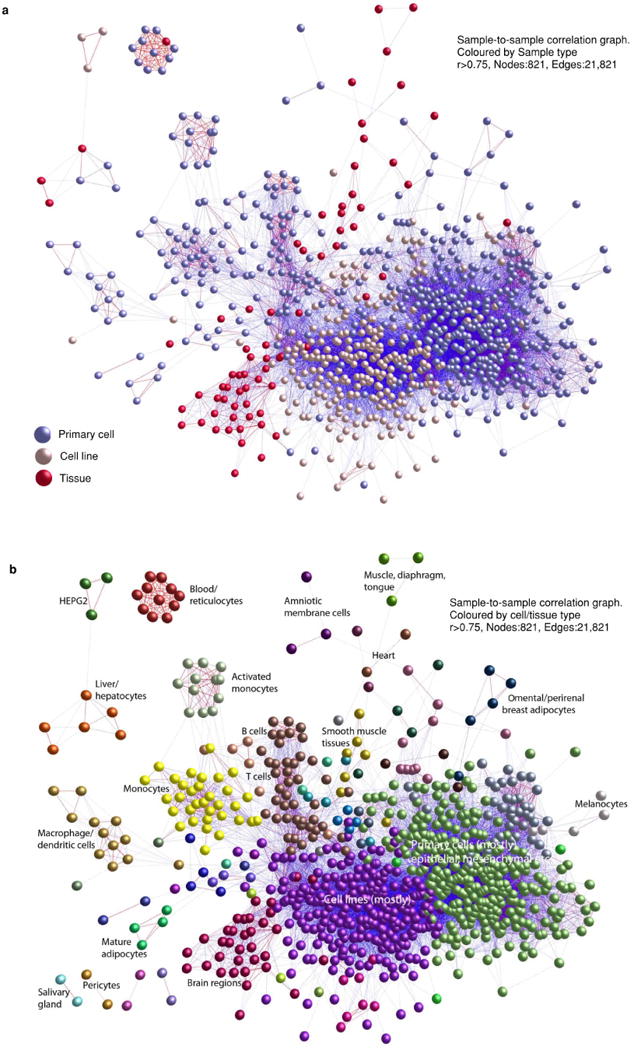
821 nodes are shown, 21,821 edges shown (r>0.75). a, Samples are coloured by sample type (primary cell, cell line or tissue). Note the separation of cell lines and primary cells. b, As in a, except major subgroups are coloured and labelled separately.
Supplementary Material
Acknowledgments
FANTOM5 was made possible by a Research Grant for RIKEN Omics Science Center from MEXT to Y. Hayashizaki and a grant of the Innovative Cell Biology by Innovative Technology (Cell Innovation Program) from the MEXT, Japan to Y. Hayashizaki. It was also supported by Research Grants for RIKEN Preventive Medicine and Diagnosis Innovation Program (RIKEN PMI) to Y. Hayashizaki and RIKEN Centre for Life Science Technologies, Division of Genomic Technologies (RIKEN CLST (DGT)) from the MEXT, Japan. Extended acknowledgements are provided in the Supplementary Information.
The FANTOM Consortium and the RIKEN PMI and CLST (DGT)
Alistair R. R. Forrest1,2*, Hideya Kawaji1,2,3*, Michael Rehli4,5*, J. Kenneth Baillie6*, Michiel J. L. de Hoon1,2, Vanja Haberle7,8, Timo Lassmann1,2, Ivan V. Kulakovskiy9,10, Marina Lizio1,2, Masayoshi Itoh1,2,3, Robin Andersson11, Christopher J. Mungall12, Terrence F. Meehan13, Sebastian Schmeier14,15, Nicolas Bertin1,2, Mette Jørgensen11, Emmanuel Dimont16, Erik Arner1,2, Christian Schmidl4, †, Ulf Schaefer14, Yulia A. Medvedeva10,14, †, Charles Plessy1,2, Morana Vitezic1,17, Jessica Severin1,2, Colin A. Semple18, Yuri Ishizu1,2, Robert S. Young18, Margherita Francescatto19,20, Intikhab Alam14, Davide Albanese21, Gabriel M. Altschuler16, Takahiro Arakawa1,2, John A. C. Archer14, Peter Arner22, Magda Babina23, Sarah Rennie18, Piotr J. Balwierz24, Anthony G. Beckhouse25,26, Swati Pradhan-Bhatt27, Judith A. Blake28, Antje Blumenthal26,29, Beatrice Bodega30, Alessandro Bonetti1,2, James Briggs25,†, Frank Brombacher31,32, A. Maxwell Burroughs1, Andrea Califano33,34,35,36, Carlo V. Cannistraci37,38, †, Daniel Carbajo39, Yun Chen11, Marco Chierici21, Yari Ciani40, Hans C. Clevers41,42,43, Emiliano Dalla40, Carrie A. Davis44, Michael Detmar45, Alexander D. Diehl46, Taeko Dohi47, Finn Drabløs48, Albert S. B. Edge49, Matthias Edinger4,5, Karl Ekwall50, Mitsuhiro Endoh51,52, Hideki Enomoto53, Michela Fagiolini54, Lynsey Fairbairn6, Hai Fang55, Mary C. Farach-Carson56, Geoffrey J. Faulkner57, Alexander V. Favorov10,58,59, Malcolm E. Fisher6, Martin C. Frith60, Rie Fujita61, Shiro Fukuda1, Cesare Furlanello21, Masaaki Furuno1,2, Jun-ichi Furusawa51,52,62, Teunis B. Geijtenbeek63, Andrew P. Gibson64, Thomas Gingeras44, Daniel Goldowitz65, Julian Gough55, Sven Guhl23, Reto Guler31,32, Stefano Gustincich66, Thomas J. Ha65, Masahide Hamaguchi67, Mitsuko Hara68, Matthias Harbers1, Jayson Harshbarger1,2, Akira Hasegawa1,2, Yuki Hasegawa1,2, Takehiro Hashimoto1, Meenhard Herlyn69, Kelly J. Hitchens25,26, Shannan J. Ho Sui16, Oliver M. Hofmann16, Ilka Hoof11, Fumi Hori1,2, Lukasz Huminiecki17, Kei Iida70, Tomokatsu Ikawa51,52, Boris R. Jankovic14, Hui Jia71, Anagha Joshi6, Giuseppe Jurman21, Bogumil Kaczkowski1,2, Chieko Kai72, Kaoru Kaida1,2, Ai Kaiho1, Kazuhiro Kajiyama1,2, Mutsumi Kanamori-Katayama1, Artem S. Kasianov10, Takeya Kasukawa2, Shintaro Katayama1, Sachi Kato1,2, Shuji Kawaguchi70, Hiroshi Kawamoto51, Yuki I. Kawamura47, Tsugumi Kawashima1,2, Judith S. Kempfle49, Tony J. Kenna29, Juha Kere50,73, Levon M. Khachigian74, Toshio Kitamura75, S. Peter Klinken76, Alan J. Knox77, Miki Kojima1,2, Soichi Kojima68, Naoto Kondo1,2, Haruhiko Koseki51,52, Shigeo Koyasu51,52,62, Sarah Krampitz45, Atsutaka Kubosaki1, Andrew T. Kwon1,2, Jeroen F. J. Laros64, Weonju Lee78, Andreas Lennartsson50, Kang Li11, Berit Lilje11, Leonard Lipovich71, Alan Mackay-sim79, Ri-ichiroh Manabe1,2, Jessica C. Mar39, Benoit Marchand14, Anthony Mathelier65, Niklas Mejhert22, Alison Meynert18, Yosuke Mizuno80, David A. de Lima Morais81, Hiromasa Morikawa67, Mitsuru Morimoto53, Kazuyo Moro51,52,62,82, Efthymios Motakis1,2, Hozumi Motohashi83, Christine L. Mummery84, Mitsuyoshi Murata1,2, Sayaka Nagao-Sato1, Yutaka Nakachi80,85, Fumio Nakahara75, Toshiyuki Nakamura72, Yukio Nakamura86, Kenichi Nakazato1, Erik van Nimwegen24, Noriko Ninomiya1, Hiromi Nishiyori1,2, Shohei Noma1,2, Tadasuke Nozaki87, Soichi Ogishima88, †, Naganari Ohkura67, Hiroko Ohmiya1,2, †, Hiroshi Ohno51,52, Mitsuhiro Ohshima89, Mariko Okada-Hatakeyama51,52, Yasushi Okazaki80,85, Valerio Orlando30,37, Dmitry A. Ovchinnikov25, Arnab Pain14,37, Robert Passier84, Margaret Patrikakis74, Helena Persson50, Silvano Piazza40, James G. D. Prendergast18, Owen J. L. Rackham55, Jordan A. Ramilowski1,2, Mamoon Rashid14,37, Timothy Ravasi37,38, Patrizia Rizzu19, Marco Roncador21, Sugata Roy1,2, Morten B. Rye48, Eri Saijyo1, Antti Sajantila90, Akiko Saka1, Shimon Sakaguchi67, Mizuho Sakai1,2, Hiroki Sato72, Hironori Satoh61, Suzana Savvi31,32, Alka Saxena1, †, Claudio Schneider40,91, Erik A. Schultes64, Gundula G. Schulze-Tanzil92, Anita Schwegmann31,32, Thierry Sengstag1, Guojun Sheng53, Hisashi Shimoji1, Yishai Shimoni36, Jay W. Shin1,2, Christophe Simon1,2, Daisuke Sugiyama93, Takaaki Sugiyama72, Masanori Suzuki1, Naoko Suzuki1,2, Rolf K. Swoboda69, Peter A. C. ’t Hoen64, Michihira Tagami1,2, Naoko Takahashi1,2, Jun Takai61, Hiroshi Tanaka88, Hideki Tatsukawa94, Zuotian Tatum64, Mark Thompson64, Hiroo Toyoda87, Tetsuro Toyoda70, Eivind Valen95, Marc van de Wetering41, Linda M. van den Berg63, Roberto Verardo40, Dipti Vijayan25,26, Ilya E. Vorontsov10, Wyeth W. Wasserman65, Shoko Watanabe1, Christine A. Wells25,26, Louise N. Winteringham76, Ernst Wolvetang25, Emily J. Wood71, Yoko Yamaguchi96, Masayuki Yamamoto61, Misako Yoneda72, Yohei Yonekura53, Shigehiro Yoshida1,2, Susan E. Zabierowski69, Peter G. Zhang65, Xiaobei Zhao11, Silvia Zucchelli66, Kim M. Summers6, Harukazu Suzuki1,2, Carsten O. Daub1, Jun Kawai1,3, Peter Heutink19, Winston Hide16, Tom C. Freeman6, Boris Lenhard8,97, Vladimir B. Bajic14, Martin S. Taylor18, Vsevolod J. Makeev9,10,98, Albin Sandelin11, David A. Hume6, Piero Carninci1,2, Yoshihide Hayashizaki1,3
1RIKEN Omics Science Center (OSC), 1-7-22 Suehiro-cho, Tsurumi-ku, Yokohama 230-0045, Japan. 2RIKEN Center for Life Science Technologies (Division of Genomic Technologies) (CLST (DGT)), 1-7-22 Suehiro-cho, Tsurumi-ku, Yokohama, Kanagawa 230-0045, Japan. 3RIKEN Preventive Medicine and Diagnosis Innovation Program (PMI), 2-1 Hirosawa, Wako-shi, Saitama 351-0198, Japan. 4Department of Internal Medicine III, University Hospital Regensburg, F.-J.-Strauss Allee 11, D-93042 Regensburg, Germany. 5Regensburg Centre for Interventional Immunology (RCI), D-93042 Regensburg, Germany. 6The Roslin Institute and Royal (Dick) School of Veterinary Studies, University of Edinburgh, Easter Bush, Edinburgh, Midlothian EH25 9RG, UK. 7Department of Biology, University of Bergen, Thormøhlensgate 53, NO-5006 Bergen, Norway. 8Faculty of Medicine, Institute of Clinical Sciences, MRC Clinical Sciences Centre, Imperial College London, Hammersmith Hospital Campus, London W12 0NN, UK. 9Engelhardt Institute of Molecular Biology, Russian Academy of Sciences, Vavilovstr. 32, Moscow 119991, Russia. 10Vavilov Institute of General Genetics, Russian Academy of Sciences, Gubkin str. 3, Moscow 119991, Russia. 11The Bioinformatics Centre, Department of Biology and BRIC, University of Copenhagen, Ole Maaloes Vej 5, DK 2200 Copenhagen, Denmark. 12Genomics Division, Lawrence Berkeley National Laboratory, 84R01, 1 Cyclotron Road, Berkeley, California 94720, USA. 13Mouse Informatics, European Molecular Biology Laboratory, European Bioinformatics Institute, Wellcome Trust Genome Campus, Hinxton, Cambridge CB10 1SD, UK. 14Computational Bioscience Research Center, King Abdullah University of Science and Technology (KAUST), Ibn Al-Haytham Building -2, Thuwal 23955-6900, Kingdom of Saudi Arabia. 15Institute of Natural and Mathematical Sciences, Massey University, Private Bag 102-904, North Shore Mail Centre, 0745 Auckland, New Zealand. 16Department of Biostatistics, Harvard School of Public Health, 655 Huntington Ave, Boston, Massachusetts 02115, USA. 17Department of Cell and Molecular Biology, Karolinska Institutet, P.O. Box 285, SE-171 77 Stockholm, Sweden. 18MRC Human Genetics Unit, MRC Institute of Genetics and Molecular Medicine (MRC-IGMM), University of Edinburgh, Western General Hospital, Crewe Road, Edinburgh EH4 2XU, UK. 19Department of Clinical Genetics, VU University Medical Center Amsterdam, Van der Boechorststraat 7, 1081 BT Amsterdam, The Netherlands. 20Graduate Program in Areas of Basic and Applied Biology, Abel Salazar Biomedical Sciences Institute, University of Porto, Rua de Jorge Viterbo Ferreira n. 228, 4050-313 Porto, Portugal. 21Predictive Models for Biomedicine and Environment, Fondazione Bruno Kessler, via Sommarive 18, 38123 Trento, Italy. 22Department of Medicine, Karolinska Institutet at Karolinska University Hospital, Huddinge, SE-141 86 Huddinge, Sweden. 23Department of Dermatology and Allergy, Charité Campus Mitte, Universitätsmedizin Berlin, Chariteplatz 1, 10117 Berlin, Germany. 24Biozentrum, University of Basel, Klingelbergstrasse 50-70, 4056 Basel, Switzerland. 25Australian Institute for Bioengineering and Nanotechnology (AIBN), University of Queensland, Brisbane St Lucia, Queensland 4072, Australia. 26Australian Infectious Diseases Research Centre (AID), University of Queensland, Brisbane St Lucia, Queensland 4072, Australia. 27Department of Biological Sciences, University of Delaware, Newark, Delaware 19713, USA. 28Bioinformatics and Computational Biology, The Jackson Laboratory, 600 Main Street, Bar Harbor, Maine 04609, USA. 29Diamantina Institute, University of Queensland, Brisbane St Lucia, Queensland 4072, Australia. 30IRCCS Fondazione Santa Lucia, via del Fosso di Fiorano 64, 00143 Rome, Italy. 31Immunology and Infectious Disease, International Centre for Genetic Engineering & Biotechnology (ICGEB) Cape Town component, Anzio Road, Observatory 7925, Cape Town, South Africa. 32Division of Immunology, Institute of Infectious Diseases and Molecular Medicine (IDM), University of Cape Town, Anzio Road, Observatory 7925, Cape Town, South Africa. 33Department of Systems Biology, Columbia University Medical Center, 1130 St. Nicholas Avenue, New York, New York 10032, USA. 34Department of Biochemistry and Molecular Biophysics, Columbia University Medical Center, 701 West 168th Street, New York, New York 10032, USA. 35Department of Biomedical Informatics, Columbia University Medical Center, 622 West 168th Street, VC5, New York, New York 10032, USA. 36Institute of Cancer Genetics, Columbia University Medical Center, Herbert Irving Comprehensive Cancer Center, 1130 St. Nicholas Avenue, New York, New York 10032, USA. 37Biological and Environmental Sciences and Engineering Division, King Abdullah University of Science and Technology (KAUST), Ibn Al-Haytham Building -2, Thuwal 23955-6900, Kingdom of Saudi Arabia. 38Applied Mathematics and Computational Science Program, King Abdullah University of Science and Technology (KAUST), Thuwal 23955-6900, Kingdom of Saudi Arabia. 39Department of Systems and Computational Biology, Albert Einstein College of Medicine, The Bronx, New York, New York 10461, USA. 40Laboratorio Nazionale del Consorzio Interuniversitario per le Biotecnologie (LNCIB), Padriciano 99, 34149 Trieste, Italy. 41Hubrecht Institute, Uppsalalaan 8, 3584 CT Utrecht, The Netherlands. 42The Royal Netherlands Academy of Arts and Sciences, P.O. Box 19121, NL-1000 GC Amsterdam, The Netherlands. 43University Medical Centre Utrecht, Postbus 85500, 3508 GA Utrecht, The Netherlands. 44Cold Spring Harbor Laboratory, 1 Bungtown Road, Cold Spring Harbor, New York 11797, USA. 45Institute of Pharmaceutical Sciences, ETH Zurich, Vladimir-Prelog-Weg 3, HCIH 303, 8093 Zurich, Switzerland. 46Department of Neurology, University at Buffalo School of Medicine and Biomedical Sciences, New York State Center of Excellence in Bioinformatics and Life Sciences, 701 Ellicott Street, Buffalo, New York 14203, USA. 47Gastroenterology, Research Center for Hepatitis and Immunology Research Institute, National Center for Global Health and Medicine, 1-7-1 Kohnodai, Ichikawa, Chiba 272-8516, Japan. 48Department of Cancer Research and Molecular Medicine, Norwegian University of Science and Technology (NTNU), P.O. Box 8905, NO-7491 Trondheim, Norway. 49Department of Otology and Laryngology, Harvard Medical School, Massachusetts Eye and Ear Infirmary, Eaton-Peabody Lab, 243 Charles Street, Boston, Massachusetts 02114, USA. 50Department of Biosciences and Nutrition, Center for Biosciences, Karolinska Institutet, Hälsovägen 7-9, SE-141 83 Huddinge, Sweden. 51RIKEN Research Center for Allergy and Immunology (RCAI), 1-7-22 Suehiro-cho, Tsurumi-ku, Yokohama, Kanagawa 230-0045, Japan. 52RIKEN Center for Integrative Medical Sciences, 1-7-22 Suehiro-cho, Tsurumi-ku, Yokohama, Kanagawa 230-0045, Japan. 53RIKEN Center for Developmental Biology (CDB), 2-2-3 Minatojima-minamimachi, Chuo-ku, Kobe, Hyogo 650-0047, Japan. 54FM Kirby Neurobiology Center, Children’s Hospital Boston, Harvard Medical School, 300 Longwood Avenue, Boston, Massachusetts 02115, USA. 55Department of Computer Science, University of Bristol, Merchant Venturers Building, Woodland Road, Bristol BS8 1UB, UK. 56Department of Biochemistry and Cell Biology, Rice University, Houston, Texas 77251-1892, USA. 57Cancer Biology Program, Mater Medical Research Institute, Raymond Terrace, South Brisbane, Queensland 4101, Australia. 58Department of Oncology, Division of Oncology, Biostatistics and Bioinformatics, Johns Hopkins University School of Medicine, 550 North Broadway, Baltimore, Maryland 21205, USA. 59State Research Institute of Genetics and Selection of Industrial Microorganisms GosNIIgenetika, 1-st Dorozhniy pr., 1, 117545 Moscow, Russia. 60Computational Biology Research Center, National Institute of Advanced Industrial Science and Technology (AIST), 2-4-7 Aomi, Koto-ku, Tokyo 135-0064, Japan. 61Department of Medical Biochemistry, Tohoku University Graduate School of Medicine, 2-1 Seiryo-machi, Aoba-ku, Sendai, Miyagi 980-8575, Japan. 62Department of Microbiology and Immunology, Keio University School of Medicine, 35 Shinanomachi, Shinjuku, Tokyo 160-8582, Japan. 63Experimental Immunology, Academic Medical Center, University of Amsterdam, Meibergdreef 9, 1105 AZ Amsterdam, The Netherlands. 64Department of Human Genetics, Leiden University Medical Center, Einthovenweg 20, 2333 ZC Leiden, The Netherlands. 65Department of Medical Genetics, Centre for Molecular Medicine and Therapeutics, Child and Family Research Institute, University of British Columbia, 950 West 28th Avenue, Vancouver, British Columbia V5Z 4H4, Canada. 66Neuroscience, SISSA, via Bonomea 265, 34136 Trieste, Italy. 67Experimental Immunology, Immunology Frontier Research Center, Osaka University, 3-1 Yamadaoka, Suita, Osaka 565-0871, Japan. 68RIKEN Advanced Science Institute (ASI), 2-1 Hirosawa, Wako, Saitama 351-0198, Japan. 69Melanoma Research Center, The Wistar Institute, 3601 Spruce Street, Philadelphia, Pennsylvania 19104, USA. 70RIKEN Bioinformatics And Systems Engineering Division (BASE), 1-7-22 Suehiro, Tsurumi, Yokohama, Kanagawa 230-0045, Japan. 71Center for Molecular Medicine and Genetics, Wayne State University, 3228 Scott Hall, 540 East Canfield Street, Detroit, Michigan 48201-1928, USA. 72Laboratory Animal Research Center, Institute of Medical Science, The University of Tokyo, 4-6-1 Shirokanedai, Minato-ku, Tokyo 108-8639, Japan. 73Science for Life Laboratory, Box 1031, SE-171 21 Solna, Sweden. 74Centre for Vascular Research, University of New South Wales, Sydney, New South Wales 2052, Australia. 75Division of Cellular Therapy and Division of Stem Cell Signaling, Institute of Medical Science, University of Tokyo, Tokyo 108-8639, Japan. 76Harry Perkins Institute of Medical Research, and the Centre for Medical Research, University of Western Australia, QQ Block, QEII Medical Centre, Nedlands, Perth, Western Australia 6009, Australia. 77Respiratory Medicine, University of Nottingham, Clinical Sciences Building, City Hospital, Hucknall Road, Nottingham NG5 1PB, UK. 78Department of Dermatology, Kyungpook National University School of Medicine, 130 Dongdeok-ro Jung-gu, Daegu 700-721, South Korea. 79National Centre for Adult Stem Cell Research, Eskitis Institute for Cell and Molecular Therapies, Griffith University, Brisbane, Queensland 4111, Australia. 80Division of Functional Genomics and Systems Medicine, Research Center for Genomic Medicine, Saitama Medical University, 1397-1 Yamane, Hidaka, Saitama 350-1241, Japan. 81Faculty of Engineering, University of Bristol, Merchant Venturers Building, Woodland Road, Clifton BS8 1UB, UK. 82PRESTO, Japanese Science and Technology Agency (JST), 7 Gobancho, Chiyodaku, Tokyo 102-0076, Japan. 83Center for Radioisotope Sciences, Tohoku University Graduate School of Medicine, 2-1 Seiryo-machi, Aoba-ku, Sendai, Miyagi 980-8575, Japan. 84Anatomy and Embryology, Leiden University Medical Center, Einthovenweg 20, P.O. Box 9600, 2300 RC Leiden, The Netherlands. 85Division of Translational Research, Research Center for Genomic Medicine, Saitama Medical University, 1397-1 Yamane, Hidaka, Saitama 350-1241, Japan. 86RIKEN BioResource Center (BRC), Koyadai 3-1-1, Tsukuba, Ibaraki 305-0074, Japan. 87Department of Clinical Molecular Genetics, School of Pharmacy, Tokyo University of Pharmacy and Life Sciences, 1432-1 Horinouchi, Hachioji, Tokyo 192-0392, Japan. 88Department of Bioinformatics, Medical Research Institute, Tokyo Medical and Dental University, 1-5-45 Yushima, Bunkyo-ku, Tokyo 113-8510, Japan. 89Department of Biochemistry, Ohu University School of Pharmaceutical Sciences, Misumido 31-1, Tomitamachi, Koriyama, Fukushima 963-8611, Japan. 90Hjelt Institute, Department of Forensic Medicine, University of Helsinki, Kytosuontie 11, 003000 Helsinki, Finland. 91DSMB Dipartimento Scienze Mediche e Biologiche University of Udine, P.le Kolbe 3, 33100 Udine, Italy. 92Department of Orthopedic, Trauma and Reconstructive Surgery, Charité Universitätsmedizin Berlin, Garystrasse 5, 14195 Berlin, Germany. 93Center for Clinical and Translational Reseach, Kyushu University Hospital, Station for Collaborative Research1 4F, 3-1-1 Maidashi, Higashi-Ku, Fukuoka 812-8582, Japan. 94Graduate School of Pharmaceutical Sciences, Nagoya University, Furo-cho, Chikusa, Nagoya, Aichi 464-8601, Japan. 95Department of Molecular and Cellular Biology, Harvard University, 16 Divinity Avenue, Cambridge, Massachusetts 02138, USA. 96Department of Biochemistry, Nihon University School of Dentistry, 1-8-13, Kanda-Surugadai, Chiyoda-ku, Tokyo 101-8310, Japan. 97Department of Informatics, University of Bergen, Høgteknologisenteret, Thormøhlensgate 53, NO-5008 Bergen, Norway. 98Department of Biological and Medical Physics, Moscow Institute of Physics and Technology (MIPT) 9, Institutsky Per., Dolgoprudny, Moscow Region 141700, Russia.
†Present addresses: Institute of Predictive and Personalized Medicine of Cancer, Ctra. de Can Roti, cami de les escoles, s/n, 08916 Badalona (Barcelona), Spain (Y.A.M.); Biomedical Cybernetics Group, Biotechnology Center (BIOTEC), Technische Universität Dresden, Dresden, Germany (C.V.C.); Genomics Core Facility, Biomedical Research Centre, Guy’s Hospital, London SE1 9RT, UK (A. Saxena); RIKEN Advanced Center for Computing and Communication (ACCC), 1-7-22 Suehiro-cho, Tsurumi-ku, Yokohama, Kanagawa, 230-0045 Japan (H. Ohmiya); Research Center for Molecular Medicine of the Austrian Academy of Sciences (CeMM), 1090 Vienna, Austria (C. Schmidl); Department of Biological and Biomedical Sciences, Harvard University, Cambridge, Massachusetts 02138, USA (J.B.); Department of Bioclinical Informatics, Tohoku Medical Megabank Organization, Tohoku University. Sendai 980-8573, Japan (S.O.).
*These authors contributed equally to this work.
Footnotes
Supplementary Information is available in the online version of the paper.
Online Content Any additional Methods, Extended Data display items and Source Data are available in the online version of the paper; references unique to these sections appear only in the online paper.
Author Contributions The core members of FANTOM5 phase 1 were Alistair R. R. Forrest, Hideya Kawaji, Michael Rehli, J. Kenneth Baillie, Michiel J. L. de Hoon, Timo Lassmann, Masayoshi Itoh, Kim M. Summers, Harukazu Suzuki, Carsten O. Daub, Jun Kawai, Peter Heutink, Winston Hide, Tom C. Freeman, Boris Lenhard, Vladimir B. Bajic, Martin S. Taylor, Vsevolod J. Makeev, Albin Sandelin, David A. Hume, Piero Carninci and Yoshihide Hayashizaki. Samples were provided by: A. Blumenthal, A. Bonetti, A. Mackay-sim, A. Sajantila, A. Saxena, A. Schwegmann, A.G.B., A.J.K., A.L., A.R.R.F., A.S.B.E., B.B., C. Schmidl, C. Schneider, C.A.D., C.A.W., C.K., C.L.M., D.A.H., D.A.O., D.G., D.S., D.V., E.W., F.B., F.N., G.G.S., G.J.F., G.S., H. Kawamoto, H. Koseki, H. Morikawa, H. Motohashi, H. Ohno, H. Sato, H. Satoh, H. Tanaka, H. Tatsukawa, H. Toyoda, H.C.C., H.E., J. Kere, J.B., J.F., J.K.B., J.S.K., J.T., J.W.S., K.E., K.J.H., K.M., K.M.S., L.F., L.M.K., L.M.vdB., L.N.W., M. Edinger, M. Endoh, M. Fagiolini, M. Hamaguchi, M. Hara, M. Herlyn, M. Morimoto, M. Rehli, M. Yamamoto, M. Yoneda, M.B., M.C.F.C., M.D., M.E.F., M.O., M.O.H., M.P., M.vdW., N.M., N.O., N.T., P.A., P.G.Z., P.H., P.R., R.F., R.G., R.K.S., R.P., R.V., S. Guhl, S. Gustincich, S. Kojima, S. Koyasu, S. Krampitz, S. Sakaguchi, S. Savvi, S.E.Z., S.O., S.P.B., S.P.K., S. Roy., S.Z., T. Kitamura, T. Nakamura, T. Nozaki, T. Sugiyama, T.B.G., T.D., T.G., T.I., T.J.H., T.J.K., V.O., W.L., Y. Hasegawa, Y. Nakachi, Y. Nakamura, Y. Yamaguchi, Y. Yonekura, Y.I., Y.I.K., Y.M. and Y.O. Analyses were carried out by: A. Mathelier, A. Meynert, A. Sandelin, A.C., A.D.D., A.P.G., A.H., A.J., A.M.B., A.P., A.R.R.F., A.S.K., A.T.K., A.V.F., B. Lenhard, B. Lilje, B.D., B.K., B.M., B.R.J., C. Schmidl, C. Schneider, C.A.S., C.F., C.J.M., C.O.D., C.P., C.V.C., D.A., D.A.M., D.C., E. Dalla, E. Dimont, E.A., E.A.S., E.J.W., E.M., E.V., Ev.N., F.D., G.J., G.J.F., G.M.A., H. Kawaji, H. Ohmiya, H. Shimoji, H.F., H.J., H.P., I.A., I.E.V., I.H., I.V.K., J.A.B., J.A.C.A., J.A.R., J.C.M., J.F.J.L., J.G., J.G.D.P., J.H., J.K.B., J.S., K. Kajiyama, K.I., K.L., L.H., L.L., M. Francescatto, M. Rashid, M. Rehli, M. Roncador, M. Thompson, M.B.R., M.C., M.C.F., M.J., M.J.L.dH., M.L., M.S.T., M.V., N.B., O.J.L.R., O.M.H., P.A.C.tH., P.J.B, R.A., R.S.Y., S. Katayama, S. Kawaguchi, S. Schmeier, S. Rennie, S.F., S.J.H.S., S.P., T. Sengstag, T.C.F., T.F.M., T.H., T.K., T.L., T.R., T.T., U.S., V.B.B., V.H., V.J.M., W.H., W.W.W., X.Z., Y. Chen, Y. Ciani, Y.A.M., Y.S., Z.T. Libraries were generated by: A. Kaiho, A. Kubosaki, A. Saka, C. Simon, E.S., F.H., H.N., J. Kawai, K. Kaida, K.N., M. Furuno, M. Murata, M. Sakai, M. Tagami, M.I., M.K., M.K.K., N.K., N.N., N.S., P.C., R.M., S. Kato, S.N., S.N.-S., S.W., S.Y., T.A., T. Kawashima. The manuscript was written by A.R.R.F. and D.A.H. with help from A. Sandelin, J.K.B., M. Rehli, H.K., M.J.L.dH., V.H., I.V.K., M.T. and K.M.S. with contributions, edits and comments from all authors. The project was managed by Y. Hayashizaki, A.R.R.F., P.C., M.I., M.S., J. Kawai, C.O.D., H. Suzuki, T.L. and N.K. The scientific coordinator was A.R.R.F and the general organizer was Y. Hayashizaki.
Author Information All CAGE data has been deposited at DDBJ DRA under accession number DRA000991.
The authors declare no competing financial interests. Readers are welcome to comment on the online version of the paper.
References
- 1.Vickaryous MK, Hall BK. Human cell type diversity, evolution, development, and classification with special reference to cells derived from the neural crest. Biol Rev Camb Philos Soc. 2006;81:425–455. doi: 10.1017/S1464793106007068. [DOI] [PubMed] [Google Scholar]
- 2.Lenhard B, Sandelin A, Carninci P. Metazoan promoters: emerging characteristics and insights into transcriptional regulation. Nature Rev Genet. 2012;13:233–245. doi: 10.1038/nrg3163. [DOI] [PubMed] [Google Scholar]
- 3.Kanamori-Katayama M, et al. Unamplified cap analysis of gene expression on a single-molecule sequencer. Genome Res. 2011;21:1150–1159. doi: 10.1101/gr.115469.110. [DOI] [PMC free article] [PubMed] [Google Scholar]
- 4.Andersson R, et al. An atlas of active enhancers across human cell types and tissues. Nature. doi: 10.1038/nature12787. http://dx.doi.org/10.1038/nature12787 (this issue) [DOI] [PMC free article] [PubMed]
- 5.The ENCODE Project Consortium. An integrated encyclopedia of DNA elements in the human genome. Nature. 2012;489:57–74. doi: 10.1038/nature11247. [DOI] [PMC free article] [PubMed] [Google Scholar]
- 6.Su AI, et al. A gene atlas of the mouse and human protein-encoding transcriptomes. Proc Natl Acad Sci USA. 2004;101:6062–6067. doi: 10.1073/pnas.0400782101. [DOI] [PMC free article] [PubMed] [Google Scholar]
- 7.Meehan TF, et al. Logical development of the cell ontology. BMC Bioinformatics. 2011;12:6. doi: 10.1186/1471-2105-12-6. [DOI] [PMC free article] [PubMed] [Google Scholar]
- 8.Mungall CJ, Torniai C, Gkoutos GV, Lewis SE, Haendel MA. Uberon, an integrative multi-species anatomy ontology. Genome Biol. 2012;13:R5. doi: 10.1186/gb-2012-13-1-r5. [DOI] [PMC free article] [PubMed] [Google Scholar]
- 9.Osborne JD, et al. Annotating the human genome with Disease Ontology. BMC Genomics. 2009;10(Suppl 1):S6. doi: 10.1186/1471-2164-10-S1-S6. [DOI] [PMC free article] [PubMed] [Google Scholar]
- 10.Severin J, et al. Interactive visualization and analysis of large-scale NGS data-sets using ZENBU. Nature Biotechnol. 2014 doi: 10.1038/nbt.2840. http://dx.doi.org/10.1038/nbt.2840. [DOI] [PubMed]
- 11.Oja E, Hyvarinen A, Karhunen J. Independent Component Analysis. John Wiley & Sons; 2001. [Google Scholar]
- 12.Affymetrix/Cold Spring Harbor Laboratory ENCODE Transcriptome Project. Post-transcriptional processing generates a diversity of 5′-modified long and short RNAs. Nature. 2009;457:1028–1032. doi: 10.1038/nature07759. [DOI] [PMC free article] [PubMed] [Google Scholar]
- 13.Carninci P, et al. Genome-wide analysis of mammalian promoter architecture and evolution. Nature Genet. 2006;38:626–635. doi: 10.1038/ng1789. [DOI] [PubMed] [Google Scholar]
- 14.Ioshikhes I, Hosid S, Pugh BF. Variety of genomic DNA patterns for nucleosome positioning. Genome Res. 2011;21:1863–1871. doi: 10.1101/gr.116228.110. [DOI] [PMC free article] [PubMed] [Google Scholar]
- 15.Robinson MD, McCarthy DJ, Smyth GK. edgeR: a bioconductor package for differential expression analysis of digital gene expression data. Bioinformatics. 2010;26:139–140. doi: 10.1093/bioinformatics/btp616. [DOI] [PMC free article] [PubMed] [Google Scholar]
- 16.Schug J, et al. Promoter features related to tissue specificity as measured by Shannon entropy. Genome Biol. 2005;6:R33. doi: 10.1186/gb-2005-6-4-r33. [DOI] [PMC free article] [PubMed] [Google Scholar]
- 17.Beissbarth T, Speed TP. GOstat: find statistically overrepresented Gene Ontologies within a group of genes. Bioinformatics. 2004;20:1464–1465. doi: 10.1093/bioinformatics/bth088. [DOI] [PubMed] [Google Scholar]
- 18.Velculescu VE, et al. Analysis of human transcriptomes. Nature Genet. 1999;23:387–388. doi: 10.1038/70487. [DOI] [PubMed] [Google Scholar]
- 19.Schmidt D, et al. Five-vertebrate ChIP-seq reveals the evolutionary dynamics of transcription factor binding. Science. 2010;328:1036–1040. doi: 10.1126/science.1186176. [DOI] [PMC free article] [PubMed] [Google Scholar]
- 20.Barolo S. Shadow enhancers: frequently asked questions about distributed cis-regulatory information and enhancer redundancy. Bioessays. 2012;34:135–141. doi: 10.1002/bies.201100121. [DOI] [PMC free article] [PubMed] [Google Scholar]
- 21.Roach JC, et al. Transcription factor expression in lipopolysaccharide-activated peripheral-blood-derived mononuclear cells. Proc Natl Acad Sci USA. 2007;104:16245–16250. doi: 10.1073/pnas.0707757104. [DOI] [PMC free article] [PubMed] [Google Scholar]
- 22.Vaquerizas JM, Kummerfeld SK, Teichmann SA, Luscombe NM. A census of human transcription factors: function, expression and evolution. Nature Rev Genet. 2009;10:252–263. doi: 10.1038/nrg2538. [DOI] [PubMed] [Google Scholar]
- 23.Wingender E, Schoeps T, Dönitz J. TFClass: an expandable hierarchical classification of human transcription factors. Nucleic Acids Res. 2013;41:D165–D170. doi: 10.1093/nar/gks1123. [DOI] [PMC free article] [PubMed] [Google Scholar]
- 24.de Kok YJ, et al. Association between X-linked mixed deafness and mutations in the POU domain gene POU3F4. Science. 1995;267:685–688. doi: 10.1126/science.7839145. [DOI] [PubMed] [Google Scholar]
- 25.Kiernan AE, et al. Sox2 is required for sensory organ development in the mammalian inner ear. Nature. 2005;434:1031–1035. doi: 10.1038/nature03487. [DOI] [PubMed] [Google Scholar]
- 26.Zheng W, et al. The role of Six1 in mammalian auditory system development. Development. 2003;130:3989–4000. doi: 10.1242/dev.00628. [DOI] [PMC free article] [PubMed] [Google Scholar]
- 27.Paylor R, Johnson RS, Papaioannou V, Spiegelman BM, Wehner JM. Behavioral assessment of c-fos mutant mice. Brain Res. 1994;651:275–282. doi: 10.1016/0006-8993(94)90707-2. [DOI] [PubMed] [Google Scholar]
- 28.Trowe MO, Maier H, Schweizer M, Kispert A. Deafness in mice lacking the T-box transcription factor Tbx18 in otic fibrocytes. Development. 2008;135:1725–1734. doi: 10.1242/dev.014043. [DOI] [PubMed] [Google Scholar]
- 29.Vahava O, et al. Mutation in transcription factor POU4F3 associated with inherited progressive hearing loss in humans. Science. 1998;279:1950–1954. doi: 10.1126/science.279.5358.1950. [DOI] [PubMed] [Google Scholar]
- 30.Chabchoub E, Willekens D, Vermeesch JR, Fryns JP. Holoprosencephaly and ZIC2 microdeletions: novel clinical and epidemiological specificities delineated. Clin Genet. 2012;81:584–589. doi: 10.1111/j.1399-0004.2011.01684.x. [DOI] [PubMed] [Google Scholar]
- 31.Pingault V, et al. SOX10 mutations in patients with Waardenburg-Hirschsprung disease. Nature Genet. 1998;18:171–173. doi: 10.1038/ng0298-171. [DOI] [PubMed] [Google Scholar]
- 32.Kapoor S, Mukherjee SB, Shroff D, Arora R. Dysmyelination of the cerebral white matter with microdeletion at 6p25. Indian Pediatr. 2011;48:727–729. doi: 10.1007/s13312-011-0108-8. [DOI] [PubMed] [Google Scholar]
- 33.Murakami T, et al. Signalling mediated by the endoplasmic reticulum stress transducer OASIS is involved in bone formation. Nature Cell Biol. 2009;11:1205–1211. doi: 10.1038/ncb1963. [DOI] [PubMed] [Google Scholar]
- 34.Acampora D, et al. Craniofacial, vestibular and bone defects in mice lacking the Distal-less-related gene Dlx5. Development. 1999;126:3795–3809. doi: 10.1242/dev.126.17.3795. [DOI] [PubMed] [Google Scholar]
- 35.Kieslinger M, et al. EBF2 regulates osteoblast-dependent differentiation of osteoclasts. Dev Cell. 2005;9:757–767. doi: 10.1016/j.devcel.2005.10.009. [DOI] [PubMed] [Google Scholar]
- 36.Funato N, et al. Hand2 controls osteoblast differentiation in the branchial arch by inhibiting DNA binding of Runx2. Development. 2009;136:615–625. doi: 10.1242/dev.029355. [DOI] [PubMed] [Google Scholar]
- 37.McIntyre DC, et al. Hox patterning of the vertebrate rib cage. Development. 2007;134:2981–2989. doi: 10.1242/dev.007567. [DOI] [PubMed] [Google Scholar]
- 38.Driller K, et al. Nuclear factor I X deficiency causes brain malformation and severe skeletal defects. Mol Cell Biol. 2007;27:3855–3867. doi: 10.1128/MCB.02293-06. [DOI] [PMC free article] [PubMed] [Google Scholar]
- 39.Lu MF, et al. prx-1 functions cooperatively with another paired-related homeobox gene, prx-2, to maintain cell fates within the craniofacial mesenchyme. Development. 1999;126:495–504. doi: 10.1242/dev.126.3.495. [DOI] [PubMed] [Google Scholar]
- 40.Ten Berge D, Brouwer A, Korving J, Martin JF, Meijlink F. Prx1 and Prx2 in skeletogenesis: roles in the craniofacial region, inner ear and limbs. Development. 1998;125:3831–3842. doi: 10.1242/dev.125.19.3831. [DOI] [PubMed] [Google Scholar]
- 41.Laclef C, et al. Altered myogenesis in Six1-deficient mice. Development. 2003;130:2239–2252. doi: 10.1242/dev.00440. [DOI] [PubMed] [Google Scholar]
- 42.Lee MS, Lowe GN, Strong DD, Wergedal JE, Glackin CA. TWIST, a basic helix-loop-helix transcription factor, can regulate the human osteogenic lineage. J Cell Biochem. 1999;75:566–577. doi: 10.1002/(sici)1097-4644(19991215)75:4<566::aid-jcb3>3.0.co;2-0. [DOI] [PubMed] [Google Scholar]
- 43.Clement-Jones M, et al. The short stature homeobox gene SHOX is involved in skeletal abnormalities in Turner syndrome. Hum Mol Genet. 2000;9:695–702. doi: 10.1093/hmg/9.5.695. [DOI] [PubMed] [Google Scholar]
- 44.He G, et al. Inactivation of Six2 in mouse identifies a novel genetic mechanism controlling development and growth of the cranial base. Dev Biol. 2010;344:720–730. doi: 10.1016/j.ydbio.2010.05.509. [DOI] [PubMed] [Google Scholar]
- 45.Freeman TC, et al. Construction, visualisation, and clustering of transcription networks from microarray expression data. PLoS Comput Biol. 2007;3:e206. doi: 10.1371/journal.pcbi.0030206. [DOI] [PMC free article] [PubMed] [Google Scholar]
- 46.The FANTOM Consortium. The transcriptional landscape of the mammalian genome. Science. 2005;309:1559–1563. doi: 10.1126/science.1112014. [DOI] [PubMed] [Google Scholar]
- 47.Suzuki H, et al. The transcriptional network that controls growth arrest and differentiation in a human myeloid leukemia cell line. Nature Genet. 2009;41:553–562. doi: 10.1038/ng.375. [DOI] [PMC free article] [PubMed] [Google Scholar]
- 48.Kawaji H, et al. Comparison of CAGE and RNA-seq transcriptome profiling using a clonally amplified and single molecule next generation sequencing. Genome Res. 2014 doi: 10.1101/gr.156232.113. http://dx.doi.org/10.1101/gr.156232.113. [DOI] [PMC free article] [PubMed]
- 49.Heffner CS, et al. Supporting conditional mouse mutagenesis with a comprehensive cre characterization resource. Nature Commun. 2012;3:1218. doi: 10.1038/ncomms2186. [DOI] [PMC free article] [PubMed] [Google Scholar]
- 50.Pringle IA, et al. Rapid identification of novel functional promoters for gene therapy. J Mol Med. 2012;90:1487–1496. doi: 10.1007/s00109-012-0928-6. [DOI] [PubMed] [Google Scholar]
- 51.Pham TH, et al. Dynamic epigenetic enhancer signatures reveal key transcription factors associated with monocytic differentiation states. Blood. 2012;119:e161–e171. doi: 10.1182/blood-2012-01-402453. [DOI] [PubMed] [Google Scholar]
- 52.Shulha HP, et al. Epigenetic signatures of autism; trimethylated H3K4 landscapes in prefrontal neurons. Arch Gen Psychiatry. 2012;69:314–324. doi: 10.1001/archgenpsychiatry.2011.151. [DOI] [PubMed] [Google Scholar]
- 53.Yoneyama M, et al. The RNA helicase RIG-I has an essential function in double-stranded RNA-induced innate antiviral responses. Nature Immunol. 2004;5:730–737. doi: 10.1038/ni1087. [DOI] [PubMed] [Google Scholar]
- 54.Shapira SD, et al. A physical and regulatory map of host-influenza interactions reveals pathways in H1N1 infection. Cell. 2009;139:1255–1267. doi: 10.1016/j.cell.2009.12.018. [DOI] [PMC free article] [PubMed] [Google Scholar]
- 55.Talukder AH, et al. Phospholipid scramblase 1 regulates Toll-like receptor 9-mediated type I interferon production in plasmacytoid dendritic cells. Cell Res. 2012;22:1129–1139. doi: 10.1038/cr.2012.45. [DOI] [PMC free article] [PubMed] [Google Scholar]
Associated Data
This section collects any data citations, data availability statements, or supplementary materials included in this article.


