

Abstract
Objectives. We examined the effects of a 2009 increase in alcohol taxes in Illinois on alcohol-related fatal motor vehicle crashes.
Methods. We used an interrupted time-series design, with intrastate and cross-state comparisons and measurement derived from driver alcohol test results, for 104 months before and 28 months after enactment. Our analyses used autoregressive moving average and generalized linear mixed Poisson models. We examined both population-wide effects and stratifications by alcohol level, age, gender, and race.
Results. Fatal alcohol-related motor vehicle crashes declined 9.9 per month after the tax increase, a 26% reduction. The effect was similar for alcohol-impaired drivers with positive alcohol levels lower than 0.15 grams per deciliter (−22%) and drivers with very high alcohol levels of 0.15 or more (−25%). Drivers younger than 30 years showed larger declines (−37%) than those aged 30 years and older (−23%), but gender and race stratifications did not significantly differ.
Conclusions. Increases in alcohol excise taxes, such as the 2009 Illinois act, could save thousands of lives yearly across the United States as part of a comprehensive strategy to reduce alcohol-impaired driving.
Effects of alcohol tax rates on drinking and alcohol-related problems have been extensively studied over the past half century. A 2009 meta-analysis found 112 studies containing more than 1000 estimates of the relationship of alcohol taxes and prices to drinking.1 Results show that a 10% increase in the price of alcoholic beverages is associated with a 5% to 8% decrease in drinking. A similar systematic review of 50 articles containing 340 estimates of alcohol price and tax effects on a wide range of social and health problems associated with drinking found that alcohol tax increases result in significant declines in chronic disease (e.g., cirrhosis, esophageal cancer), sexually transmitted infections, injuries, violence, and motor vehicle crashes.2 The US Department of Health and Human Services Community Preventive Services Task Force also reviewed this evidence and recommended increasing alcohol taxes to reduce excessive drinking and related harms.3 However, the great majority of the studies that have evaluated the effects of alcohol tax changes date from the 1970s, 1980s, and 1990s, and their results have not been reflected in public policy in the United States—when inflation is taken into account, real alcohol tax rates are only about half what they were in the 1960s.4
Lower real tax rates, along with broader economic changes in recent decades, have made alcoholic beverages much more affordable than in times past. For example, drinking 1 drink per day of the cheapest spirits required 15 times the fraction of income in 1950 that it did in 2011.5 Even more noteworthy, the cost of very heavy drinking (≥ 10 drinks/day) required 45% of mean disposable income in 1950, but only 3% in 2011. One result of such dramatically increased affordability of alcohol is that the small alcohol tax increases that have been implemented in the United States recently cause price increases for alcoholic beverages that are a much smaller fraction of personal income than would have occurred in previous decades, when most previous evaluations of alcohol tax increases were conducted. The potential importance of affordability was recently reinforced by Room et al., who reported that tax reductions in Denmark and Sweden did not result in expected increases in alcohol consumption, a result the authors attributed to the level of affluence of these countries, where alcohol was already highly affordable.6 In short, recent economic and social changes emphasize the importance of evaluating the effect of recent increases in alcohol taxes on excessive alcohol use and related harms.
The mechanisms by which alcohol taxes reduce motor vehicle crash rates are well established: tax rates affect retail price, and price affects amount and patterns of drinking, including excessive drinking, which affect the risk of alcohol-related motor vehicle crashes.1,3,7 Drinking by motorists increases risk of serious car crashes, with risks rising exponentially beyond 1 or 2 drinks.8 A systematic review of 21 studies containing 34 independent estimates of tax and price effects on crash rates reveals a significant inverse variance–weighted overall effect (r = −0.112).2 Two studies published since that systematic review largely confirm alcohol tax effects on crash rates, although the consistency and magnitude of observed effects varies.9,10 Replication studies are important because alcohol-related motor vehicle crashes continue to result in more than 10 000 deaths and half a million injuries annually, representing a leading public health problem associated with alcohol use that is deserving of continued policymaker attention.7,11
Although the population-wide effect of alcohol taxes on excessive alcohol consumption and alcohol-impaired driving is well established, Elder et al. note that research to date has paid little attention to possible differences in alcohol tax effects in different segments of the population; they call for additional analyses of demographic subgroups.3 Staras et al. recently highlighted the potential importance of subgroup analyses in an evaluation of the effects of an alcohol tax increase in Illinois on sexually transmitted infection rates.12 They found noticeably larger effects (i.e., reductions in infection rates after the tax increase) among Blacks than Whites, perhaps because of differing exposure risks, levels of disposable income, and other factors.
To address the need for more current data on the effects of alcohol taxes on alcohol-related motor vehicle crashes as well as the need to better characterize the effects of alcohol taxes on specific subgroups, we evaluated the effects of a September 2009 increase in alcohol excise taxes on beer, wine, and spirits in the State of Illinois on fatal alcohol-related motor vehicle crashes. We assessed the overall effect of the tax increase on fatal motor vehicle crashes, as well as effects on major population subgroups.
METHODS
We used an interrupted time-series quasi-experimental design to examine the effects of the 2009 Illinois alcohol excise tax increase on alcohol-related fatal motor vehicle crashes and to ascertain whether effects of the tax change differed by driver’s age, gender, race, and breath or blood alcohol concentration (BAC). The number of fatal crashes and driver characteristics for each fatal crash are collected by the National Highway Traffic Safety Administration and reported in the Fatality Analysis Reporting System.13 We analyzed counts of alcohol-related fatal motor vehicle crashes from January 2001 through December 2011, covering 104 baseline months before and 28 months following the enactment of the Illinois alcohol excise tax increase. We used a comparison group of Illinois non–alcohol-related fatal motor vehicle crashes to control for the many other factors in Illinois (e.g., traffic safety programs, weather, economic conditions) that could have affected crash rates independently of alcohol consumption. In addition, we examined alcohol-related fatal crashes in Wisconsin as a second design comparison, to ensure that observed effects were not attributable to broader cross-state factors.
Illinois 2009 Alcohol Excise Tax Increase
Illinois imposes an excise tax on businesses engaged in the distribution of alcoholic beverages containing 0.5% or greater alcohol by volume.14 From July 1, 1999, to August 31, 2009, Illinois taxed beer at a rate of $0.185 per gallon, wine at a rate of $0.730 per gallon, and distilled spirits at a rate of $4.50 per gallon.15 Effective September 1, 2009, the excise tax on beer increased to $0.231 per gallon (an increase of 4.6 cents/gallon), the tax on wine increased to $1.39 per gallon (an increase of 66 cents/gallon), and the tax on distilled spirits increased to $8.55 per gallon (an increase of $4.05/gallon).15
In terms of a standard drink,16 and assuming a 1-to-1 pass-through rate of tax to retail price,17 this tax increased the average retail price per drink in Illinois by 0.4 cents for beer, 0.5 cents for wine, and 4.8 cents for spirits. In addition, alcoholic beverages in Illinois are taxed with a 6.25% sales tax that has remained constant since January 1, 1990.18 In Illinois, counties and municipalities may levy general sales taxes as well as alcohol-specific ad valorem or excise taxes. Because the statewide excise tax increases for the 3 beverage types were implemented simultaneously, we could not assess the differential effects across beer, wine, and spirits; we therefore calculated the combined effect of the 3 simultaneous tax rate changes.
Data
We obtained records on all fatal motor vehicle crashes in the State of Illinois occurring on roads open to the public, as well as driver characteristics (age, gender, race) and BAC from the Fatality Analysis Reporting System. In addition to including available BAC test results on all drivers, pedestrians, and cyclists who were involved in a fatal crash, the Fatality Analysis Reporting System provides well-designed multiple imputation estimates of driver alcohol concentration for cases where BAC test results are not recorded. We used BAC test results and imputed BAC estimates to classify fatal crashes as alcohol related (BAC > 0 g/dL for ≥ 1 involved drivers, pedestrians, or cyclists) or not alcohol related.
To test whether the alcohol excise tax increase had differential effects by subgroup, we generated monthly time series of the count of alcohol-related and non–alcohol-related fatal crashes by gender, age (driver aged ≥ 30 years or < 30 years), race (White or other), and driver BAC (0.01–0.14 g/dL or ≥ 0.15 g/dL). The use of such binary subgroups was necessary to maintain an adequate number of crashes per month (n = 20 on average) for subgroup analyses. A BAC of 0.15 grams per deciliter or greater is often used in the literature to indicate high levels of alcohol consumption and impairment prior to a crash and is an indicator of particularly heavy drinking.19 The Fatality Analysis Reporting System records race only for drivers who die, limiting analyses by race to driver deaths only.
Statistical Analysis
To account for autocorrelation and seasonality in the crash outcomes, we used Box–Jenkins autoregressive moving average (ARIMA) models with structural parameters. We estimated models of the following form:
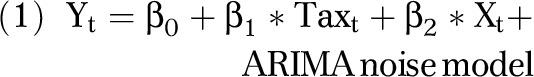 |
separately for the overall population-level effect as well as for the gender, age, and BAC subgroups. Yt represents the count of alcohol-related motor vehicle crashes at month t. Taxt is an indicator of the presence of the tax increase in month t. Xt is the count of non–alcohol-related crashes in month t. Xt controls for secular trends in fatal crashes and all the other factors affecting the number of motor vehicle crashes independent of alcohol involvement (economic conditions, weather, traffic enforcement levels, safety policies, and programs, etc.). The ARIMA noise model for all series is of the form (0,0,2)(0,0,0)12. In this case, the well-known seasonality in fatal crash counts was adequately controlled via the non–alcohol-related crash covariate, obviating the need for seasonal ARIMA parameters. We assumed that residuals were normally distributed, which is justified when the mean count of events per observation time unit is approximately 20, as was the case here. We analyzed each of the 10 BAC imputations separately, and combined the results from each imputation with PROC MIANALYZE in SAS version 9.3 (SAS Institute Inc, Cary, NC) to obtain the correct (i.e., larger) standard error estimates after taking into account the imputations.
To estimate the percentage change in number of fatal motor vehicle crashes, we also estimated models with log-transformed crash frequencies as the outcome. We used the β1 estimate from the log-transformed model to calculate the percentage change with 100*(eβ1−1). We ran all models with PROC ARIMA in SAS 9.3.
We ran a second set of models, restricted to crashes with a driver (as opposed to passenger) fatality, to examine the possibility of differential effects by race. We estimated all models with an ARIMA model with structural parameters of the same form used in the full sample analyses. For consistency, we also reestimated the population-level effect as well as the age, gender, and BAC subgroup-specific effects with only driver fatalities (instead of all drivers involved in fatal crashes) to facilitate comparison of the race-specific results to the other estimates.
In sensitivity analyses, we reestimated the overall effects while incorporating alcohol-related crashes in Wisconsin as a comparison, and we conducted post hoc analyses on whether a portion of the estimated alcohol tax effect was potentially attributable to the implementation of a 2008 smoke-free indoor air law in Illinois (as suggested by one of the reviewers) or affected by the Great Recession of 2008, when the economy sharply contracted to a greater degree than had occurred since 1929.
We tested the statistical significance of the differential effects of the Illinois excise tax increase by subgroup with a z test comparing the differences between the estimated percentage change for each set of subgroups.20 For subgroup models with low mean monthly crashes, the assumption of normally distributed residuals might be violated. To test the robustness of the results, we also estimated a parallel set of generalized linear mixed models, assuming a Poisson-distributed outcome and an AR(1) covariance structure with PROC GLIMMIX in SAS 9.3. We observed no substantive differences between the ARIMA and Poisson models; thus, only ARIMA model results are shown.
RESULTS
Analyses revealed a statistically significant reduction in fatal alcohol-related motor vehicle crashes of 9.9 per month after the September 2009 Illinois alcohol excise tax increase, representing a 26% reduction from the number expected had the tax rate not changed (Table 1, Figure 1). The effect was larger among drivers younger than 30 years (–37%) than among those aged 30 years and older (–23%). The effect of the tax appeared to be larger among men than women, but the difference was not statistically significant. A baseline mean of only 5 crashes per month among women (vs 30 for men) illustrates the dramatically reduced statistical power to measure effects among women separately and the limited power to assess whether effects for men and women differed significantly.
TABLE 1—
Effect of 2009 Illinois Alcohol Excise Tax Increase on Fatal Alcohol-Related Motor Vehicle Crashes
| Baseline Mean Monthly Crashes, No. | Change in Monthly Crashes,a No. (95% CI) | Net change, % (95% CI) | Subgroup Difference, P | |
| Overall | 43.3 | −9.9 (−14.9, −5.0) | −26.4 (−35.8, −15.6) | |
| Age, y | ||||
| < 30 | 16.7 | −5.3 (−7.9, −2.7) | −37.2 (−48.0, −24.2) | .05 |
| ≥ 30 | 18.4 | −3.7 (−6.0, −1.4) | −23.2 (−34.0, −10.7) | |
| Gender | ||||
| Male | 30.0 | −7.7 (−11.0, −4.4) | −29.7 (−38.3, −19.9) | .18 |
| Female | 5.2 | −1.1 (−2.2, 0.1) | −19.0 (−37.9, 5.7) | |
| Alcohol concentration | ||||
| Elevated (< 0.15 g/dL) | 18.0 | −3.0 (−5.4, −0.5) | −21.7 (−33.5, −7.8) | .37 |
| Very high (≥ 0.15 g/dL) | 25.3 | −5.7 (−8.9, −2.4) | −24.5 (−34.9, −12.4) |
Note. CI = confidence interval.
Stratum-specific estimates do not sum to the overall estimate because of missing data on the stratifying variables.
FIGURE 1—

Fatal alcohol-related motor vehicle crashes per month: Illinois, 2001–2011.
Note. Alc = alcohol.
The tax increase significantly reduced crashes both among drivers with somewhat elevated BACs (< 0.15 g/dL) and among those with very high BACs (≥ 0.15 g/dL), and the magnitude of effect was the same for these 2 groups (22%–25% reductions).
Analyses restricted to the set of fatal crashes where a driver died showed no substantive differences from the patterns of effects seen with the full data set (Table 2). The sole purpose of the restricted data set was to enable analyses by race, which is recorded only for dead drivers. Results suggested a larger tax effect among White than non-White drivers, but the difference was not statistically significant. However, because the diverse group of non-White drivers only accounted for a third of the driver deaths, statistical power to evaluate the race-specific effects of the tax increase was limited.
TABLE 2—
Effect of 2009 Illinois Alcohol Excise Tax Increase on Alcohol-Related Motor Vehicle Crashes Resulting in Driver Fatalities
| Baseline Mean Monthly Crashes, No. | Change in Monthly Crashes,a No. (95% CI) | Net change, % (95% CI) | Subgroup Difference, P | |
| Overall | 30.1 | −6.1 (−10.7, −1.37) | −19.0 (−31.3, −4.5) | |
| Age, y | .15 | |||
| < 30 | 9.9 | −2.6 (−4.7, −0.5) | −25.8 (−42.7, −4.1) | |
| ≥ 30 | 12.5 | −1.8 (−4.1, 0.5) | −11.1 (−29.0, 11.5) | |
| Gender | .13 | |||
| Male | 19.3 | −4.7 (−7.7, −1.6) | −23.5 (−35.6, −9.2) | |
| Female | 3.3 | −0.3 (−1.2, 0.6) | −5.9 (−30.1, 26.7) | |
| Alcohol concentration | .4 | |||
| Elevated (< 0.15 g/dL) | 11.6 | −1.8 (−3.8, 0.3) | −17.2 (−32.6, 1.8) | |
| Very high (≥ 0.15 g/dL) | 18.6 | −3.8 (−6.7, −0.9) | −19.9 (−32.9, −4.4) | |
| Race | .13 | |||
| White | 19.7 | −4.6 (−7.8, −1.4) | −23.4 (−36.4, −7.9) | |
| Other | 10.5 | −1.0 (−2.8, 0.7) | −10.7 (−26.4, 8.4) |
Note. CI = confidence interval.
Stratum-specific estimates do not sum to the overall estimate because of missing data on the stratifying variables.
All these analyses included Illinois non–alcohol-related fatal crashes as a control, ensuring that observed effects were not attributable to any of the many other intrastate factors that could affect crash rates. To ensure that observed effects were not confounded by other unmeasured cross-state factors affecting alcohol-related crash rates specifically, we reestimated the model, incorporating Wisconsin alcohol-related fatal crashes as the control (Wisconsin did not change alcohol tax rates during the study period). Results showed a virtually identical estimated effect of the Illinois tax increase of −9.7 (95% confidence interval [CI] = −14.0, −5.4) crashes per month, representing a 26% (95% CI = −33.5%, −16.6%) reduction, which provided further evidence that the observed effect in Illinois was attributable to the tax change and not to other regional factors affecting alcohol-related crash rates.
Two additional model specifications provided further confirmation of a causal interpretation of the alcohol tax effect. Simultaneously controlling for both the intrastate and cross-state comparison time series produced an estimated effect of −7.6 (95% CI = −11.6, −3.5) crashes per month, representing a −21% (95% CI = −29.4%, −12.5%) change. Applying the Illinois tax change variable to the comparison state outcome series produced no significant effect, as expected.
Finally, we and the reviewers noticed post hoc from Figure 1 an apparent significant reduction in Illinois alcohol-related crashes in 2008. A reviewer suggested that this might be attributable to the implementation of a statewide smoke-free indoor air law in January 2008, although it must be noted that previous research in other states found no significant effect of smoke-free laws on alcohol-related crashes.21 Nevertheless, addition of a dummy variable for the 2008 Illinois smoke-free law as suggested by the reviewer showed a significant decline in alcohol-related crashes in Illinois of −20% (95% CI = −29.2%, −10.4%) starting in January 2008; the estimated effect of the September 2009 alcohol tax increase remained significant but the magnitude decreased to −15% (95% CI = −24.5%, −3.3%). However, when we applied this post hoc model, including the January 2008 dummy variable, to the Wisconsin comparison state data series, we found an almost identical estimated significant effect of −19.9% (95% CI = −28.4%, −10.4%) in Wisconsin. Wisconsin did not implement a similar smoke-free law until 2.5 years later (July 5, 2010), so the observed decline in alcohol-related crashes starting in early 2008 in both states cannot be attributed to smoke-free laws. Employment and incomes contracted sharply and suddenly starting in 2008 in both states, and observed declines in alcohol-related crashes at this time were likely an effect of the Great Recession.
DISCUSSION
Our study extends previous findings by confirming statistically significant and sizable effects of increasing alcohol excise taxes on fatal motor vehicle crashes, a leading cause of alcohol-attributable deaths. Specifically, the September 2009 Illinois alcohol tax increase reduced fatal alcohol-related motor vehicle crashes by 119 per year from September 2009 through December 2011, a 26% decrease from what would have been expected to occur during this period without the tax change. This reduction in crash deaths occurred despite the fact that the expected increase in the retail price of beer and wine following the tax increase was less than 1 cent per drink, and the expected increase in the retail price of liquor was less than 5 cents per drink. Our results indicated that modest increases in alcohol taxes can reduce alcohol-related crash deaths, despite the long-standing and widespread secular trend toward reduced alcohol taxes (adjusted for inflation) and thus increased alcohol affordability.
Our study also contributes to inference regarding the dose–response effect of alcohol taxes. Although cross-elasticity estimates across the range of alcohol products remain undeveloped in the literature, we know that when the price of one type of beverage goes up, consumers shift some of that consumption to other types of alcohol whose prices have remained constant.22 In a situation where only one type of alcohol is subject to a tax increase (e.g., only beer or only spirits), one would therefore expect the change in total ethanol intake to be smaller than in a situation where taxes are simultaneously increased on all types of alcohol, as occurred in Illinois.23,24
The quite large effects we found represented the first 28 months' experience after the tax change. Effects of this particular policy change might be expected to dissipate slowly over the coming decade, because the Illinois excise tax is not currently indexed for inflation, and thus the real value of the tax decreases gradually over time, reducing its restraint on drinking. Another factor that might have contributed to our larger-than-expected effects was the special situation commonly called the Great Recession. Any alcohol tax increase reduces the affordability of alcoholic beverages to some degree, but the effects we observed were likely larger than expected because they occurred during a period of particularly severe contraction in disposable incomes. Controlling for this apparent Great Recession effect reduced the magnitude of the estimated alcohol tax effect from −26% to −15%. Final resolution of the question of how much of the effects we observed was attributable to the special Great Recession conditions will require longer follow-up studies of Illinois and replications in other states.
Our study also illustrates practical limits on recent calls for more analyses of demographic subgroup differences in alcohol tax policy effects.3 The core issue is reduced statistical power to accurately measure policy effects on smaller segments of the population, exacerbated by limited collection of relevant variables (e.g., race collected only for some drivers involved in fatal crashes). Nevertheless, our findings suggested that the differential effects of the 2009 alcohol tax increase in Illinois on various demographic groups, though often not statistically significant, appeared to be broadly consistent with known differences in the risk of alcohol-related crashes in these populations. For example, point estimates suggested that male drivers were affected by the tax increase more than were female drivers, which is logical, because, on average, men drink at higher rates.25 But reliably assessing gender differences in tax effects is difficult because exposure to crash risk by women, as measured by annual vehicle miles traveled, is only two thirds that of men.26 Similarly, our point estimates suggested that White drivers were more affected by the tax change than were other drivers. However, exposure to crash risk is lower among drivers from other racial groups.26
Differential alcohol tax effects across subgroups also appear to vary by health outcome examined, probably because risk exposure profiles by group also vary by outcome. For example, another study evaluated the same 2009 Illinois tax increase, except that the outcome measured was sexually transmitted infections rather than traffic crash outcomes; much larger reductions in sexually transmitted infections attributable to the tax increase occurred among Blacks than Whites, probably in part because of the much higher risk (and rates) of such infections among Blacks than Whites.12
Analyses stratified by alcohol concentration are fundamentally different than stratifications by demographics, because alcohol concentration results can indicate how alcohol taxes affect individuals with different drinking patterns. We dichotomized crash-involved drivers such that a sizable proportion fell into each of the 2 groups. Our cutpoint, therefore, was at a high BAC of 0.15 grams per deciliter, which requires ingesting about 6 drinks in 1 hour for most adults,27 far exceeding typical cutpoints used to define binge drinking (≥ 4 alcoholic drinks on 1 occasion for women and ≥ 5 drinks on 1 occasion for men).28 A portion of these drivers with BACs above 0.15 grams per deciliter likely represented dependent drinkers,19 but a larger group of binge drinkers average 4 episodes a month, consuming an average of 8 drinks each time,28 and 85% of self-reported alcohol-impaired driving episodes in the United States involve such binge drinkers.29 Therefore, our results suggest that increasing alcohol excise taxes reduces alcohol consumption among binge drinkers and thus reduces the risk of alcohol-impaired driving and alcohol-related crash deaths following binge drinking as well.
Our observation of essentially equal effects of the tax change on lighter- and heavier-drinking drivers is noteworthy, because the conventional view among economists is that heavy drinkers, although still responding somewhat to price changes, are less responsive than those who drink in moderation.30
The 2009 increase in beverage alcohol excise taxes in the State of Illinois significantly reduced fatal alcohol-related motor vehicle crashes, with slightly larger effects on younger drivers than older drivers and equal effects on the heaviest drinkers and those who drank less. Replication of similar alcohol tax increases in other states could prevent thousands of car crash deaths annually, complementing other evidence-based strategies for reducing alcohol-impaired driving.
Acknowledgments
This study was conducted as part of contract number 200-2011-40800 funded by the US Centers for Disease Control and Prevention (prime grant for the coordinating center was the Johns Hopkins University School of Public Health). It was also supported in part by a grant from the National Institutes of Health to the University of Florida (K01 AA018255).
Note. Views expressed here are solely those of the authors. Staff from the Centers for Disease Control and Prevention reviewed, commented on, and approved an early draft of this article. They had neither involvement in nor approval of the revised article after peer review.
Human Participant Protection
This study was approved by the University of Florida institutional review board. The study involved no contact with participants and relied solely on publicly available data sets on fatal motor vehicle crashes.
References
- 1.Wagenaar AC, Salois MJ, Komro KA. Effects of beverage alcohol price and tax levels on drinking: a meta-analysis of 1003 estimates from 112 studies. Addiction. 2009;104(2):179–190. doi: 10.1111/j.1360-0443.2008.02438.x. [DOI] [PubMed] [Google Scholar]
- 2.Wagenaar AC, Tobler AL, Komro KA. Effects of alcohol tax price policies on morbidity and mortality: a systematic review. Am J Public Health. 2010;100(11):2270–2278. doi: 10.2105/AJPH.2009.186007. [DOI] [PMC free article] [PubMed] [Google Scholar]
- 3.Elder RW, Lawrence B, Ferguson A et al. The effectiveness of tax policy interventions for reducing excessive alcohol consumption and related harms. Am J Prev Med. 2010;38(2):217–229. doi: 10.1016/j.amepre.2009.11.005. [DOI] [PMC free article] [PubMed] [Google Scholar]
- 4. Chaloupka F, Grossman M, Saffer H. The effects of price on the consequences of alcohol use and abuse. In: Galanter M, ed. The Consequences of Alcohol. New York, NY: Plenum Press; 1998:331–346. Recent Developments in Alcoholism; vol 14. [DOI] [PubMed]
- 5.Kerr WC, Patterson D, Greenfield TK et al. U.S. alcohol affordability and real tax rates, 1950–2011. Am J Prev Med. 2013;44(5):459–464. doi: 10.1016/j.amepre.2013.01.007. [DOI] [PMC free article] [PubMed] [Google Scholar]
- 6.Room R, Bloomfield K, Gmel G et al. What happened to alcohol consumption and problems in the nordic countries when alcohol taxes were decreased and borders opened? Int J Alcohol Drug Res. 2013;2(1):77–87. [Google Scholar]
- 7.Flowers NT, Naimi TS, Brewer R, Elder R, Shults RA, Jiles R. Patterns of alcohol consumption and alcohol-impaired driving in the United States. Alcohol Clin Exp Res. 2008;32(4):639–644. doi: 10.1111/j.1530-0277.2008.00622.x. [DOI] [PubMed] [Google Scholar]
- 8.Taylor B, Rehm J. The relationship between alcohol consumption and fatal motor vehicle injury: high risk at low alcohol levels. Alcohol Clin Exp Res. 2012;36(10):1827–1834. doi: 10.1111/j.1530-0277.2012.01785.x. [DOI] [PMC free article] [PubMed] [Google Scholar]
- 9.Son CH, Topyan K. The effect of alcoholic beverage excise tax on alcohol-attributable injury mortalities. Eur J Health Econ. 2011;12(2):103–113. doi: 10.1007/s10198-010-0231-9. [DOI] [PubMed] [Google Scholar]
- 10.Sen B, Campbell CM. Alcohol prevalence, alcohol policies, and child fatal injury rates from motor vehicle crashes. Contemp Econ Policy. 2010;28(3):392–405. [Google Scholar]
- 11.Pacific Institute of Research and Evaluation. Impaired driving in the United States. Available at: http://www.nhtsa.gov/people/injury/alcohol/impaired_driving_pg2/us.htm. Accessed March 14, 2014.
- 12.Staras SAS, Livingston MD, Christou AM, Jernigan DH, Wagenaar AC. Heterogeneous population effects of an alcohol excise tax increase on sexually transmitted infections morbidity. Addiction. 2014;109(6):904–912. doi: 10.1111/add.12493. [DOI] [PMC free article] [PubMed] [Google Scholar]
- 13.National Highway Traffic Safety Administration. Fatality Analysis Reporting System Data Files 2001–2011. Washington, DC: National Center for Statistics and Analysis; 2013. [Google Scholar]
- 14. 235 Ill Comp Stat/Art VIII; 2011.
- 15. 235 Ill Comp Stat 5/ 8–1, 235 Ill Comp Stat 5/ 1–3.02-/1–3.04; 2011.
- 16.Centers for Disease Control and Prevention. Fact sheets—alcohol use and health. Available at: http://www.cdc.gov/alcohol/fact-sheets/alcohol-use.htm. Accessed May 24, 2013.
- 17.Siegel M, Grundman J, DeJong W et al. State-specific liquor excise taxes and retail prices in eight U.S. states, 2012. Subst Abus. 2013;34(4):415–421. doi: 10.1080/08897077.2013.792314. [DOI] [PMC free article] [PubMed] [Google Scholar]
- 18. Ill Adm Code tit 86, § 130.101; 2011.
- 19.Gijsbers AJ, Raymond A, Whelan G. Does a blood alcohol level of 0.15 or more identify accurately problem drinkers in a drink-driver population? Med J Aust. 1991;154(7):448–452. doi: 10.5694/j.1326-5377.1991.tb121173.x. [DOI] [PubMed] [Google Scholar]
- 20.Paternoster R, Brame R, Mazerolle P, Piquero A. Using the correct statistical test for the equality of regression coefficients. Criminology. 1998;36(4):859–866. [Google Scholar]
- 21.Bernat DH, Maldonado-Molina MM, Hyland A, Wagenaar AC. Effects of smoke-free laws on alcohol-related car crashes in California and New York: time series analyses from 1982 to 2008. Am J Public Health. 2013;103(2):214–220. doi: 10.2105/AJPH.2012.300906. [DOI] [PMC free article] [PubMed] [Google Scholar]
- 22.Meier PS, Purshouse R, Brennan A. Policy options for alcohol price regulation: the importance of modeling population heterogeneity. Addiction. 2010;105(3):383–393. doi: 10.1111/j.1360-0443.2009.02721.x. [DOI] [PubMed] [Google Scholar]
- 23.Kisely SR, Pais J, White A et al. Effect of the increase in “alcopops” tax on alcohol-related harms in young people: a controlled interrupted time series. Med J Aust. 2011;195(11):690–693. doi: 10.5694/mja10.10865. [DOI] [PubMed] [Google Scholar]
- 24.Müller S, Piontek D, Pabst A, Baumeister SE, Kraus L. Changes in alcohol consumption and beverage preference among adolescents after the introduction of the alcopops tax in Germany. Addiction. 2010;105(7):1205–1213. doi: 10.1111/j.1360-0443.2010.02956.x. [DOI] [PubMed] [Google Scholar]
- 25.Schoenborn CA, Adams PF, Peregoy JA. Health behaviors of adults: United States, 2008–2010. Vital Health Stat. 2013;10(257):1–184. [PubMed] [Google Scholar]
- 26.Santos A, McGuckin N, Nakamoto HY, Gray D, Liss S. Summary of Travel Trends: 2009 National Household Travel Survey. Washington, DC: Federal Highway Administration; 2011. [Google Scholar]
- 27.Fisher HR, Simpson RI, Kapur BM. Calculation of blood alcohol concentration (BAC) by sex, weight, number of drinks and time. Can J Public Health. 1987;78(5):300–304. [PubMed] [Google Scholar]
- 28.Kanny D, Liu Y, Brewer RD, Lu H Centers for Disease Control and Prevention. Binge drinking—United States, 2011. MMWR Surveill Summ. 2013;62(suppl 3):77–80. [PubMed] [Google Scholar]
- 29.Centers for Disease Control and Prevention. Vital signs: alcohol-impaired driving among adults—United States, 2010. MMWR Morb Mortal Wkly Rep. 2011;60(39):1351–1356. [PubMed] [Google Scholar]
- 30.Manning WG, Blumberg L, Moulton LH. The demand for alcohol—the differential response to price. J Health Econ. 1995;14(2):123–148. doi: 10.1016/0167-6296(94)00042-3. [DOI] [PubMed] [Google Scholar]