

Abstract
MicroRNAs constitute an important class of noncoding, single-stranded, ~22 nucleotide long RNA molecules encoded by endogenous genes. They play an important role in regulating gene transcription and the regulation of normal development. MicroRNAs can be associated with disease; however, only a few microRNA-disease associations have been confirmed by traditional experimental approaches. We introduce two methods to predict microRNA-disease association. The first method, KATZ, focuses on integrating the social network analysis method with machine learning and is based on networks derived from known microRNA-disease associations, disease-disease associations, and microRNA-microRNA associations. The other method, CATAPULT, is a supervised machine learning method. We applied the two methods to 242 known microRNA-disease associations and evaluated their performance using leave-one-out cross-validation and 3-fold cross-validation. Experiments proved that our methods outperformed the state-of-the-art methods.
1. Introduction
MicroRNAs constitute a class of non-protein-coding small RNAs, 20 to 25 nucleotides long, that bind to the 3′ untranslated region of target mRNAs to regulate mRNA turnover and translation. There are many biological processes, which are regulated by microRNAs, such as development, differentiation, apoptosis, and diseases [1–3]. Many studies have found that microRNAs play an important role in cellular signaling networks [4], tissue development, [5–7] and cell growth [8]. They are also associated with various diseases [9, 10], including breast cancer [11, 12], lung cancer [13, 14], cardiomyopathy [15], and cell lymphoma [16]. If the microRNA abnormality causes the disease, the abnormal microRNA and the disease are associated by the causal relationship. And the microRNA-disease association is what we aim to predict. Predicting microRNA-disease associations has emerged as an important strategy in understanding disease mechanisms [17]. For example, dysregulation of microRNAs can affect apoptosis signaling pathways and cell cycle regulation in cancer [18].
The importance of microRNA-disease association prediction has been appreciated for some time [19]. However, most of the techniques that have been developed to achieve this suffer several inherent weaknesses; in particular, traditional experimental approaches are time-consuming and expensive. It is necessary to employ the bioinformatics analysis, which could make use of databases and the potential inferences. For bioinformatics approaches, it is important to measure the functional similarities among microRNAs in order to construct networks based on functional similarity [20–24]. The construction of functional similarity networks for genes encoding proteins has produced significant results [25–32]; however, the methods used to analyze protein-encoding genes are not always adaptable to enable use with microRNAs because the correlation between the functional similarities of genes and gene sequences or expression similarities may not exist for microRNAs [5, 6, 33, 34]. MicroRNAs directly adjust the one-third of the human genes. The genes targeted by miRNAs identified are recognized from directed biological process. However, the previous published methods to find gene used bio-experiment or the characteristics of protein sequence. However, gene and miRNA identification is quite inefficient. Another issue is that there are not many validated associations between microRNAs and diseases. For studying microRNA-disease association, there are two well-known databases: the human microRNA-associated disease database (HMDD) and the miR2Disease database of differentially expressed MiRNAs in human cancers (dbDEMC). The data in HMDD and dbDEMC are manually collected and archived from publications [10, 21, 22, 35]. The last main challenge is that it is difficult to select negative samples as there are no verified negative microRNA-disease associations. It is therefore difficult to conduct biological experiments without such controls. Hence, it is necessary to develop effective computational methods to detect potential microRNA-disease associations.
To overcome the above challenges and to effectively predict associations, we explored the computational method KATZ [36] and the machine learning method CATAPULT [5, 6] to predict microRNA-disease associations. The two methods can succeed to overcome the challenges above. The highlight work is to discover unknown associations through known associations, including microRNA-microRNA associations, a small quantity of microRNA-disease associations, and disease-disease associations. Previous studies show that one or more mutations from the same functional module can give rise to diseases with overlapping clinical features [1, 37–39]. Biological experiments of human disease show that microRNAs causing similar diseases often interact with each other directly or indirectly [40–45]. Hence, we learn from the idea of social network. This is an integrated network composed of microRNA-microRNA association networks, known microRNA-disease association networks, and disease-disease association networks and is similar to social networks used to predict the relationship between two individuals [40, 46–49]. In this paper, we take full advantage of relationships among microRNAs and diseases to predict the association between microRNA and disease. Each predicted microRNA-disease association is denoted by a score. For each disease, we rank the microRNA on the basis of a score. For a disease, if a microRNA is ranked in the top k, the microRNA is expected to have a high probability of association with the disease [50, 51]. We show that KATZ and CATAPULT are superior to current methods by cross-validation. KATZ and CATAPULT are able to propose many potential associations, which is of great value for future studies.
2. Datasets
We used three types of data, microRNA-microRNA association, microRNA-disease association, and disease-disease association data. The microRNA-microRNA association dataset includes 271 microRNAs, and the association is denoted by a functional similarity score. The dataset was downloaded from http://www.webcitation.org/query.php [5, 6]. The disease-disease association dataset, including 5080 diseases, was downloaded from MimMiner [52], which provides a similarity score for each phenotype pair by text mining analysis of their phenotype descriptions in the Online Mendelian Inheritance in Man (OMIM) database [53]. The disease-disease similarity scores have been successfully used to predict or prioritize disease related genes [54, 55]. The microRNA-disease association dataset contained 271 microRNAs and 5080 diseases. Furthermore, there are 242 microRNA-disease associations. It means there are 242 nonzero elements in the matrix of microRNA-disease association. The microRNA-disease association dataset was downloaded from [56]. In addition, we verified that the 242 nonzero elements consisted of 99 microRNAs and 51 diseases. The details of the datasets are shown in Table 1.
Table 1.
Distribution of the three datasets.
| Dataset | Matrix | Similarity score >0 |
|---|---|---|
| MicroRNA-microRNA association dataset | 271 × 271 | 56289 |
| Disease-disease association dataset | 5080 × 5080 | 20285172 |
| MicroRNA-disease association dataset | 271 × 5080 | 242 |
With the above datasets, we could construct a microRNA-microRNA network, a disease-disease network, and a microRNA-disease network using a bipartite graph. For example, Figure 1 denotes the bipartite graph of the microRNA-disease network. In the graph, the nodes denote microRNAs or diseases and the lines correspond to associations between microRNAs and diseases. If there is an association between a microRNA and a disease, there must be a line between the microRNA and the disease.
Figure 1.
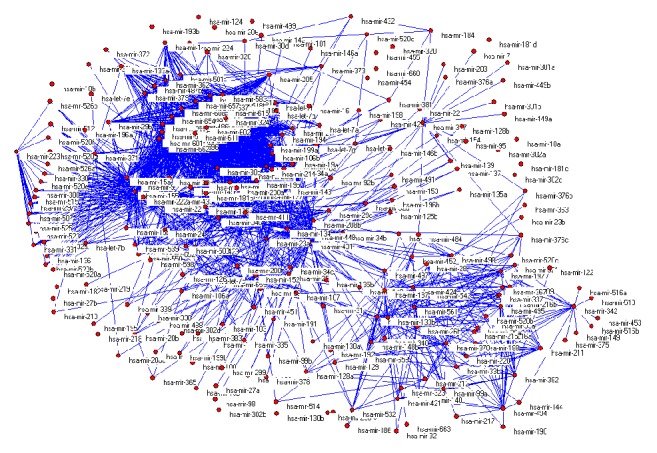
Bipartite graph of the microRNA-disease association network.
The degree distributions of microRNAs and diseases in the bipartite graph of the microRNA-disease association network are illustrated in Figure 2. The microRNA degree is defined as the number of diseases that connect with a microRNA. In the same way, the disease degree is defined as the number of microRNAs that connect with a disease. The node degree can show the activeness or status of the node (microRNA or disease) in the entire network.
Figure 2.
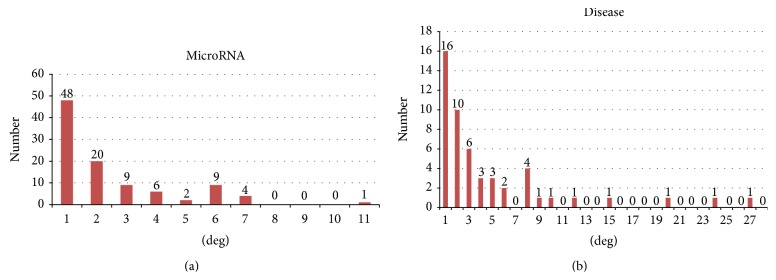
Degree distributions of microRNAs and diseases in the bipartite graph of the microRNA-disease association network.
We propose to compare our methods with the previously described microRNA-based similarity inference (MBSI), phenotype-based similarity inference (PBSI), and network-consistency-based inference (NetCBI) methods [55]. Hence, we used the same datasets as them and we present Table 2 to clearly describe the statistical data for the bipartite graph of the microRNA-disease association network. Table 2 illustrates that there are few known microRNA-disease associations for a disease. For example, it should have 271∗5080 microRNA-disease associations, but known associations are only 242.
Table 2.
Statistical data for the bipartite graph of the microRNA-disease association network.
| Title | Number |
|---|---|
| MicroRNAs | 271 |
| Diseases | 5080 |
| Known-associating microRNAs | 99 |
| Known-associating diseases | 51 |
| Known-associations | 242 |
| Average number of microRNA degrees | 2.44 |
| Average number of disease degrees | 4.75 |
3. Methods and Algorithm
We introduce two different computational methods, which were presented by [36] to predict microRNA-disease associations. The first method, KATZ [57], has been shown to be successful at predicting links in a social network. When KATZ is applied to predict microRNA-disease associations, it uses the functional similarity score to denote the associations. KATZ computes the similarity score based on walks of different lengths between the microRNA and disease nodes. The second method, CATAPULT, is a supervised learning method. For the supervised learning method, features must be offered that are derived from hybrid walks through the microRNA-disease association network. However, CATAPULT is a transformation of a general supervised learning method. For the problem of microRNA-disease association, there are only positive examples and unlabeled examples, which CATAPULT is able to overcome. Algorithm part will detailedly present KATZ and CATAPULT.
3.1. KATZ
KATZ is similar to classical approaches, such as random walk [58], Prince [59], and CIPHER [60]. The essence of these approaches is a ranking algorithm. For example, the KATZ method computes the functional similarity score for microRNA-disease node pairs based on the microRNA-disease association network and ranking the diseases for a microRNA on the basis of the functional similarity score [57]. KATZ was successfully applied to predict social associations based on a social network [60]. Predicting microRNA-disease associations on the basis of a microRNA-disease association network is equivalent to predicting associations in a social network. KATZ results show that it can also adapt to predict associations between microRNAs and diseases.
For the known associations between microRNAs and diseases, we constructed an unweighted, undirected graph and derived a corresponding adjacency matrix of the graph. To vividly describe the method, we illustrate a simple unweighted, undirected graph, in Figure 3. Suppose the corresponding adjacency matrix of Figure 1 is A; the adjacency matrix A can be written with A ij = 1, if microRNA node i and disease node j are connected, and A ij = 0, if there is no line between microRNA node i and disease node j. However, there are not many direct lines linking microRNA and disease; therefore, it is difficult to denote the microRNA-disease association through the adjacency matrix A. Thus, we counted the number of walks of different lengths, which link microRNA node i and disease node j to signify the association between microRNA and disease. (A l)ij denotes the number of walks of length l that link node i and node j.
Figure 3.
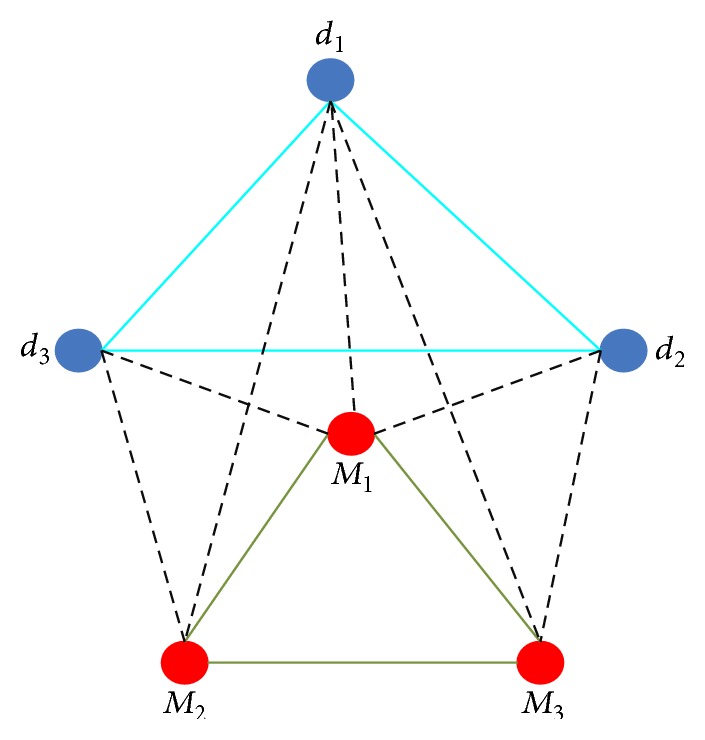
Unweighted, undirected graph.
Next, we integrated different walks of different length to obtain a comprehensive association measure. We introduced a nonnegative coefficient β l, whose function is to control the contribution of different length walks. If l1 is larger than l2, β l1 is smaller than β l2. Suppose microRNA node i and disease node j are not connected in the unweighted, undirected graph; then A ij = 0 and the microRNA i and disease j association can be computed through
| (1) |
From formula (1), we can draw the conclusion that higher order paths contribute much less to microRNA-disease association. Formula (2) can process the entire unweighted, undirected graph:
| (2) |
where if l → ∞, β l → 0. In KATZ, if β l is replaced by β l, KATZ can be written as
| (3) |
where β is chosen on the basis of β < 1/‖A‖2. For the choice of value k, the sum over infinitely many path lengths is not necessarily considered. According to the experimental results, small values of k (k = 3 or k = 4) obtain good performance in the task of recommending linked nodes. We have carried out the experiments for the other values of k. When k < 3, the experimental results are worse. However, for k > 4, the results are no better than k = 3 or 4. In addition, when k > 4 or bigger, the experimental time is much longer.
To use KATZ, we need a microRNA-disease association adjacent matrix A, which is the adjacent matrix of the microRNA-disease association network and is denoted as follows:
| (4) |
where G MM is the adjacent matrix of the microRNA-microRNA association network, G MD is the adjacent matrix of the microRNA-disease association network, and G DD is the adjacent matrix of the disease-disease association network. We substituted the adjacent matrix A into formula (3) to obtain the association score matrix of microRNAs and diseases.
Setting k = 3, the correlation score matrix S KATZ(A) denoting the association between microRNAs and diseases can be written as expression (5). Here we use KATZ with k = 3 to obtain the correlation score matrix. Consider
| (5) |
One of the advantages of KATZ is that it can study human microRNA-disease association and association for other species. In KATZ, this is achieved simply by changing the submatrix of adjacent matrix A, denoted as
| (6) |
where D PHS and D PS represent human disease and disease of other species, respectively. G HS and G S are microRNA-disease association of human and other species, respectively. When we conduct an experiment on human, set D PS = 0 and G S = 0.
3.2. CATAPULT
CATAPULT is a supervised learning method. General supervised learning methods need positive examples and negative examples. However, for microRNA-disease association, there is a lack of negative examples. Positive associations can be checked through existing methods, but there is not a method to prove negative associations. Because negative associations are seldom proven, we processed the problem by treating all nonpositive association node pairs as unlabeled because previous studies have shown that most unlabeled pairs have a negative association [55].
A study by Mordelet and Vert [61] used the bagging technique to obtain an aggregate classifier based on positive examples and unlabeled examples. CATAPULT uses a biased support vector machine (SVM) to classify microRNA-disease pairs. Hence, CATAPULT uses a bagging algorithm to train biased SVM. In CATAPULT, unlabeled samples are randomly selected from the set of all unlabeled examples and a classifier is used to train the selected unlabeled samples as negative examples and positive examples. The features of microRNA-disease pairs are obtained from hybrid walks through the heterogeneous network. To some extent, bagging could reduce the variance in the classifier. The variance is caused by randomly selecting negative examples. R is the set of randomly selected negative microRNA-disease pairs and N− is the number of set R. T is the set of positive microRNA-disease pairs and N+ is the number of set T. U denotes all the unlabeled microRNA-disease pairs. The biased SVM means that we assign a penalty, k−, for false positives and a larger penalty, k+, for false negatives. Detail of the CATAPULT algorithm is displayed in the following part. To train a biased SVM, CATAPULT uses formula (7) based on the known positive examples T and randomly selected negative examples R to obtain a biased SVM. ξ i denotes the distance of example i from a boundary and SVM gives the example i corresponding penalty. 〈θ t, Φ(x)〉 denotes the function score for iteration t, where θ t is the normal to the hyper plane at the tth iteration and Φ(x) is the feature vector of example x. Besides, the feature vector of example x is the feature vector of the microRNA-disease pair. In our experiment, we assign 1 to k− and 30 to N− [36].
CATAPULT Algorithm.
INIT
For t = 1,2, 3,…, N−:
-
(1)
Select the set R of size N− from U as negative examples.
-
(2)Train a classifier based on positive examples T and negative examples
(7) -
(3)For any update:
(8)
4. Implementation
4.1. Results
The KATZ and CATAPULT methods were applied to the 242 known microRNA-disease associations to infer potential microRNA-disease associations. First, we mainly verified microRNA-disease associations. The set of 242 known microRNA-disease associations is regarded as the “gold standard” data and was used to evaluate the performance of KATZ and CATAPULT methods in the leave-one-out and 3-fold cross-validation experiment and training dataset in the comprehensive prediction [62]. To compare our methods with MBSI, PBSI, and NetCBI, we carried out leave-one-out cross-validation on microRNA-disease associations using KATZ and CATAPULT methods. Furthermore, we carried out the 3-fold cross-validation to make sure that the outperformance of KATZ and CATAPULT is solid. For the leave-one-out cross-validation, each of the 242 known microRNA-disease associations is left out once in turn as the testing case. For the 3-fold cross-validation, the dataset containing 242 known microRNA-disease associations is divided into three parts, which is turned to act as testing. We ranked all microRNA-disease associations according to the scores obtained from KATZ and CATAPULT results.
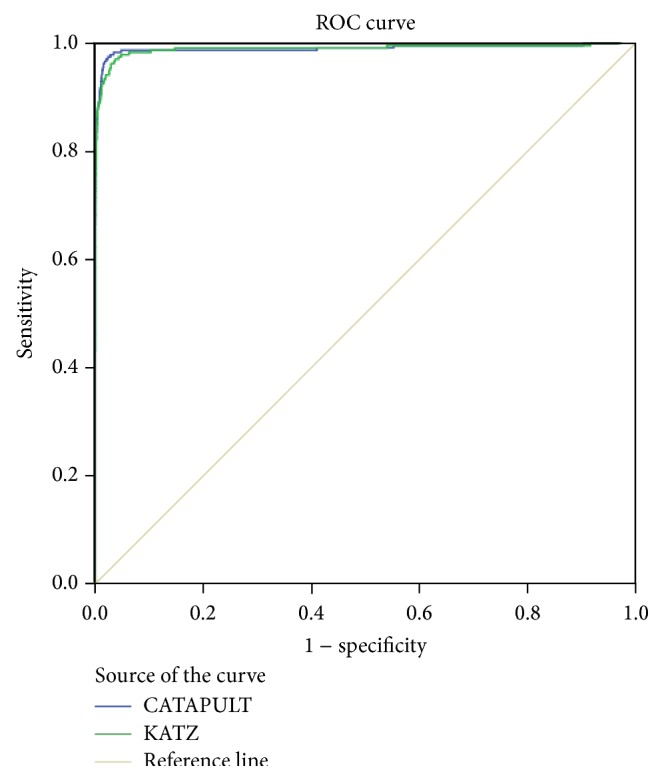
We used a receiver operating characteristic (ROC) curve to evaluate the effect of the method. Varying the threshold plots a ROC curve, and the numeric representation of a ROC curve is the area under the curve (AUC). If we could not compare which method was best from the ROC curve, we could compare the AUC. In the experiment of leave-one-out cross-validation, KATZ and CATAPULT were tested on the 242 known microRNA-disease associations and AUC values 98.9% and 98.8% for KATZ and CATAPULT were achieved. Figure 4 is the corresponding ROC curve of KATZ and CATAPULT methods. This indicates that our methods have great potential to infer new microRNA-associations.
Figure 4.
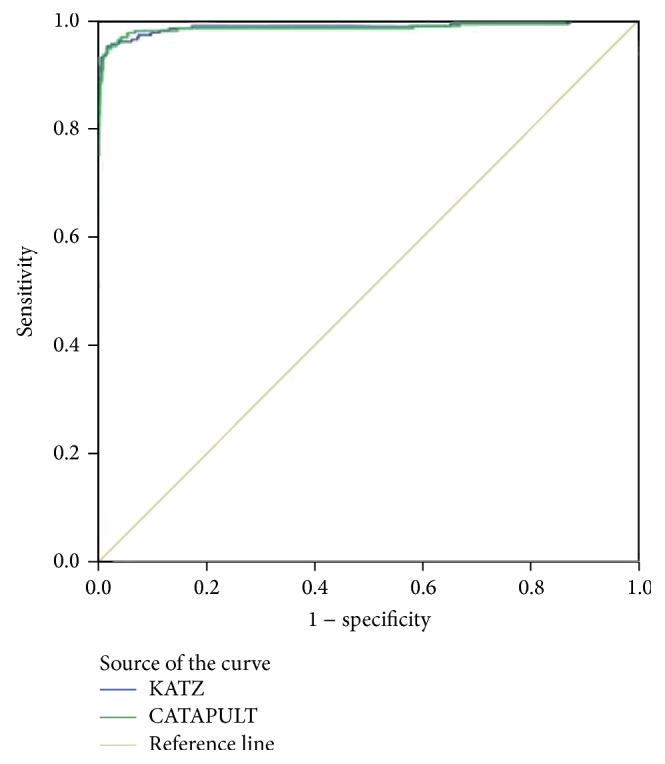
ROC curves of KATZ and CATAPULT methods by leave-one-out cross-validation.
For the leave-one-out cross-validation, we carry out one loop for each known microRNA-disease association. In each loop, we hide a microRNA-disease association in the known association group and run KATZ and CATAPULT methods on the remaining associations repeating 242 times to ensure that each known microRNA-disease association is hidden exactly once. In each loop, we order the 5080 diseases for the microRNAs, which is the hidden association. We rule that if the disease that is the hidden association has the highest k value, then prediction is true. The principle behind this rule is that the method is better if it can predict the true microRNA-disease association with higher probability. Table 3 shows the distribution of diseases on the basis of the number of microRNAs. Figure 6 presents the result of prediction hidden microRNA-disease associations. The x-axis is the threshold k and the y-axis is the amount of true prediction. Figure 6 shows the results for KATZ and CATAPULT.
Table 3.
Distribution of diseases on the basis of microRNAs.
| Number of microRNAs | 0 | 1 | 2 | 3 | 4 | 5 | 6 | 8 | 9 | 10 | 12 | 15 | 20 | 24 | 27 |
|---|---|---|---|---|---|---|---|---|---|---|---|---|---|---|---|
| Number of diseases | 5029 | 16 | 10 | 6 | 3 | 3 | 2 | 4 | 1 | 1 | 1 | 1 | 1 | 1 | 1 |
Figure 6.
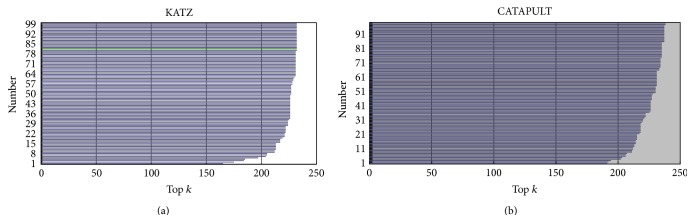
Recovery of microRNA-disease associations with respect to disease rank under leave-one-out cross-validation.
In the experiment of 3-fold cross-validation, KATZ and CATAPULT were tested on the 242 known microRNA-disease associations and AUC values 98.4% and 98.3% for KATZ and CATAPULT were achieved. Figure 5 shows AUC values of KATZ and CATAPULT methods. The cross-validation results prove that the outperformance is solid.
Figure 5.
ROC curves of KATZ and CATAPULT methods by 3-fold cross-validation.
4.2. Evaluation
To confirm the strength of our methods, we compared them with MBSI, PBSI, and NetCBI. MBSI and PBSI both work on the basis of recommendation. However, MBSI takes full advantage of microRNAs similarity. This means that if association between a microRNA and a disease has been validated, then other similar microRNAs would be recommended to the disease. The drawback of MBSI is that it overlooks disease-disease associations. In contrast, PBSI takes full advantage of disease similarities but overlooks the microRNA-microRNA associations. NetCBI considers both associations. The basic idea of NetCBI is ranking. Suppose a microRNA and a disease are linked; if a microRNA is ranked top by querying the microRNAs and a disease is ranked top by querying the diseases, then it rules that associations exist between top-ranking microRNAs and top-ranking diseases.
We used leave-one-out cross-validation to compare our methods with previous methods based on the same datasets. Table 4 shows the comparative results and our methods are clearly better at predicting microRNA-disease associations than the other methods. The assessment criteria that we used were ROC and AUC. AUC and ROC are the measure of the standard classifier model which is good or bad. ROC presents the evaluation criteria in a visual form, and the AUC value is the area under the ROC curve. Our methods yield 98.9% and 98.8%, which are better than MBSI (74.83%), PBSI (54.02%), and NetCBI (80.66%).
Table 4.
Comparison of different prediction methods based on AUC values.
| Method | MBSI | PBSI | NetCBI | KATZ | CATAPULT |
|---|---|---|---|---|---|
| AUC | 74.83% | 54.02% | 80.66% | 98.9% | 98.8% |
We verify the top 10 predicted associations, which were not identified in our microRNA-disease association dataset. However, the latest online databases provide the evidence. The online databases that we referenced were OMIM, HMDD, and miR2Disease. Tables 5 and 6 show the prediction results by KATZ and CATAPULT. Each predicted association is confirmed by one of the three databases.
Table 5.
Top 10 newly predicted microRNA-disease associations by KATZ.
| Rank | MicroRNA | OMIM disease ID | Disease | Source |
|---|---|---|---|---|
| 1 | hsa-let-7i | 211980 | Lung cancer | HMDD |
| 2 | hsa-let-7d | 114480 | Breast cancer | HMDD |
| 3 | hsa-mir-145 | 211980 | Lung cancer | HMDD |
| 4 | hsa-mir-18a | 114480 | Breast cancer | HMDD |
| 5 | hsa-mir-145 | 114480 | Breast cancer | HMDD |
| 6 | hsa-mir-106b | 114480 | Breast cancer | HMDD |
| 7 | hsa-let-7e | 114480 | Breast cancer | HMDD |
| 8 | hsa-let-7b | 114480 | Breast cancer | HMDD |
| 9 | hsa-mir-19a | 114480 | Breast cancer | HMDD |
| 10 | hsa-mir-125a | 114480 | Breast cancer | HMDD |
Table 6.
Top 10 newly predicted microRNA-disease associations by CATAPULT.
| Rank | MicroRNA | OMIM disease ID | Disease | Source |
|---|---|---|---|---|
| 1 | hsa-let-7a | 176807 | Prostate cancer | miR2Disease |
| 2 | hsa-mir-34a | 114480 | Breast cancer | HMDD |
| 3 | hsa-mir-21 | 211980 | Lung cancer | HMDD |
| 4 | hsa-let-7c | 114480 | Breast cancer | HMDD |
| 5 | hsa-mir-19a | 114480 | Breast cancer | HMDD |
| 6 | hsa-let-7a | 151400 | Chronic lymphocytic leukemia | miR2Disease |
| 7 | hsa-mir-29b | 114480 | Breast cancer | miR2Disease |
| 8 | hsa-mir-146a | 211980 | Lung cancer | HMDD |
| 9 | hsa-mir-155 | 211980 | Lung cancer | HMDD |
| 10 | hsa-let-7c | 114550 | Hepatocellular carcinoma | miR2Disease |
5. Conclusions
Identifying microRNA-disease associations is an important part of understanding disease mechanisms. Although experimental methods can identity microRNA-disease associations, they are time-consuming and expensive. Hence, efficient methods to identity microRNA-disease associations are desired.
We introduce KATZ and CATAPULT methods for predicting microRNA-disease associations. KATZ succeeds in processing social network links to achieve prediction, which is a different strategy to other methods, such as PBSI and MBSI. The KATZ method uses the entire heterogeneous network, including microRNA-microRNA association, microRNA-disease association, and disease-disease association networks. CATAPULT is a supervised learning method and uses a biased SVM. KATZ and CATAPULT significantly outperform other prediction microRNA-disease association methods, assessed by the leave-one-out and 3-fold cross-validation evaluation strategy. The potential microRNA-disease association predicted by KATZ and CATAPULT will facilitate biological experiments, which identify the true associations between microRNAs and diseases. The KATZ uses the simple measure on the heterogeneous network to predict the potential microRNA-disease associations. KATZ's performance is relatively poor on the sparse known associations.
Although our methods perform well, better methods would be proposed to predict microRNA-disease associations. There are many features of microRNAs and diseases that are not used to help predict microRNA-disease associations, such as gene ontology and the external manifestations of disease. With the use of more factors in prediction methods and the emergence of new relevant data, the prediction of microRNA-disease association will further advance. Ultimately this will help the medical treatment of disease.
Acknowledgments
The work was supported by the Natural Science Foundation of China (nos. 61370010, 61202011, and 61303004), the Natural Science Foundation of Fujian Province of China (no. 2014J01253, no. 2013J05103), and the Open Fund of Shanghai Key Laboratory of Intelligent Information Processing, China (no. IIPL-2014-004).
Conflict of Interests
The authors declare that they have no conflict of interests.
Authors' Contribution
Quan Zou analyzed data and designed the project and coordinated it. Jinjin Li created the front end user interface and developed the web server. Yun Wu and Hua Shi were involved in drafting the paper. Ying Ju had given final approval of the version to be published. Qingqi Hong helped revise the paper and gave helpful suggestion. All authors read and approved the final paper.
References
- 1.Jiménez P., Thomas F., Torras C. 3D collision detection: A survey. Computers & Graphics. 2001;25(2):269–285. doi: 10.1016/s0097-8493(00)00130-8. [DOI] [Google Scholar]
- 2.Uziel T., Karginov F. V., Xie S., et al. The miR-17~92 cluster collaborates with the Sonic Hedgehog pathway in medulloblastoma. Proceedings of the National Academy of Sciences of the United States of America. 2009;106(8):2812–2817. doi: 10.1073/pnas.0809579106. [DOI] [PMC free article] [PubMed] [Google Scholar]
- 3.Ding H., Feng P., Chen W., Lin H. Identification of bacteriophage virion proteins by the ANOVA feature selection and analysis. Molecular BioSystems. 2014;10(8):2229–2235. doi: 10.1039/c4mb00316k. [DOI] [PubMed] [Google Scholar]
- 4.Cui Q., Yu Z., Purisima E. O., Wang E. Principles of microRNA regulation of a human cellular signaling network. Molecular Systems Biology. 2006;2, article 46 doi: 10.1038/msb4100089. [DOI] [PMC free article] [PubMed] [Google Scholar]
- 5.Wang D., Wang J., Lu M., Song F., Cui Q. Inferring the human microRNA functional similarity and functional network based on microRNA-associated diseases. Bioinformatics. 2010;26(13):1644–1650. doi: 10.1093/bioinformatics/btq241. [DOI] [PubMed] [Google Scholar]
- 6.Wang Y., Cui T., Zhang C., et al. Global protein-protein interaction network in the human pathogen mycobacterium tuberculosis H37Rv. Journal of Proteome Research. 2010;9(12):6665–6677. doi: 10.1021/pr100808n. [DOI] [PubMed] [Google Scholar]
- 7.Wang Y., Chen L., Chen B., et al. Mammalian ncRNA-disease repository: a global view of ncRNA-mediated disease network. Cell Death & Disease. 2013;4, article e765 doi: 10.1038/cddis.2013.292. [DOI] [PMC free article] [PubMed] [Google Scholar]
- 8.Esquela-Kerscher A., Slack F. J. Oncomirs—microRNAs with a role in cancer. Nature Reviews Cancer. 2006;6(4):259–269. doi: 10.1038/nrc1840. [DOI] [PubMed] [Google Scholar]
- 9.Latronico M. V. G., Catalucci D., Condorelli G. Emerging role of microRNAs in cardiovascular biology. Circulation Research. 2007;101(12):1225–1236. doi: 10.1161/circresaha.107.163147. [DOI] [PubMed] [Google Scholar]
- 10.Lu M., Zhang Q., Deng M., et al. An analysis of human microRNA and disease associations. PLoS ONE. 2008;3(10) doi: 10.1371/journal.pone.0003420.e3420 [DOI] [PMC free article] [PubMed] [Google Scholar]
- 11.Calin G. A., Croce C. M. MicroRNA signatures in human cancers. Nature Reviews Cancer. 2006;6(11):857–866. doi: 10.1038/nrc1997. [DOI] [PubMed] [Google Scholar]
- 12.Iorio M. V., Ferracin M., Liu C.-G., et al. MicroRNA gene expression deregulation in human breast cancer. Cancer Research. 2005;65(16):7065–7070. doi: 10.1158/0008-5472.can-05-1783. [DOI] [PubMed] [Google Scholar]
- 13.Esquela-Kerscher A., Trang P., Wiggins J. F., et al. The let-7 microRNA reduces tumor growth in mouse models of lung cancer. Cell Cycle. 2008;7(6):759–764. doi: 10.4161/cc.7.6.5834. [DOI] [PubMed] [Google Scholar]
- 14.Wang Q., Wei L., Guan X., Wu Y., Zou Q., Ji Z. Briefing in family characteristics of microRNAs and their applications in cancer research. Biochimica et Biophysica Acta—Proteins and Proteomics. 2014;1844(1):191–197. doi: 10.1016/j.bbapap.2013.08.002. [DOI] [PubMed] [Google Scholar]
- 15.Yang B., Lin H., Xiao J., et al. The muscle-specific microRNA miR-1 regulates cardiac arrhythmogenic potential by targeting GJA1 and KCNJ2. Nature Medicine. 2007;13(4):486–491. doi: 10.1038/nm1569. [DOI] [PubMed] [Google Scholar]
- 16.Chen R. W., Bemis L. T., Amato C. M., et al. Truncation in CCND1 mRNA alters miR-16-1 regulation in mantle cell lymphoma. Blood. 2008;112(3):822–829. doi: 10.1182/blood-2008-03-142182. [DOI] [PMC free article] [PubMed] [Google Scholar]
- 17.Xu J., Li C.-X., Li Y.-S., et al. MiRNA-miRNA synergistic network: construction via co-regulating functional modules and disease miRNA topological features. Nucleic Acids Research. 2011;39(3):825–836. doi: 10.1093/nar/gkq832. [DOI] [PMC free article] [PubMed] [Google Scholar]
- 18.Cheung T.-H., Man K.-N. M., Yu M.-Y., et al. Dysregulated microRNAs in the pathogenesis and progression of cervical neoplasm. Cell Cycle. 2012;11(15):2876–2884. doi: 10.4161/cc.21278. [DOI] [PubMed] [Google Scholar]
- 19.Han K., Xuan P., Ding J., Zhao Z. J., Hui L., Zhong Y. L. Prediction of disease-related microRNAs by incorporating functional similarity and common association information. Genetics and Molecular Research. 2014;13(1):2009–2019. doi: 10.4238/2014.march.24.5. [DOI] [PubMed] [Google Scholar]
- 20.Huang T., Cai Y.-D. An information-theoretic machine learning approach to expression QTL analysis. PLoS ONE. 2013;8(6) doi: 10.1371/journal.pone.0067899.e67899 [DOI] [PMC free article] [PubMed] [Google Scholar]
- 21.Zou Q., Li X., Jiang W., Lin Z., Li G., Chen K. Survey of MapReduce frame operation in bioinformatics. Briefings in Bioinformatics. 2014;15(4):637–647. doi: 10.1093/bib/bbs088. [DOI] [PubMed] [Google Scholar]
- 22.Zou Q., Li J., Wang C., Zeng X. Approaches for recognizing disease genes based on network. BioMed Research International. 2014;2014:10. doi: 10.1155/2014/416323.416323 [DOI] [PMC free article] [PubMed] [Google Scholar]
- 23.Yu G., Xiao C.-L., Bo X., et al. A new method for measuring functional similarity of microRNAs. Journal of Integrated OMICS. 2010;1(1):49–54. doi: 10.5584/jiomics.v1i1.21. [DOI] [Google Scholar]
- 24.Liu B., Xu J., Fan S., Xu R., Zhou J., Wang X. PseDNA-Pro: DNA-binding protein identification by combining Chou's PseAAC and physicochemical distance transformation. Molecular Informatics. 2015;34(1):8–17. doi: 10.1002/minf.201400025. [DOI] [PubMed] [Google Scholar]
- 25.Liu B., Wang X., Zou Q., Dong Q., Chen Q. Protein remote homology detection by combining chou's pseudo amino acid composition and profile-based protein representation. Molecular Informatics. 2013;32(9-10):775–782. doi: 10.1002/minf.201300084. [DOI] [PubMed] [Google Scholar]
- 26.Du Z., Li L., Chen C.-F., Yu P. S., Wang J. Z. G-SESAME: web tools for GO-term-based gene similarity analysis and knowledge discovery. Nucleic Acids Research. 2009;37(2):W345–W349. doi: 10.1093/nar/gkp463. [DOI] [PMC free article] [PubMed] [Google Scholar]
- 27.Lee S. G., Hur J. U., Kim Y. S. A graph-theoretic modeling on GO space for biological interpretation of gene clusters. Bioinformatics. 2004;20(3):381–388. doi: 10.1093/bioinformatics/btg420. [DOI] [PubMed] [Google Scholar]
- 28.Li K., Wu D., Chen X., et al. Current and emerging biomarkers of cell death in human disease. BioMed Research International. 2014;2014:10. doi: 10.1155/2014/690103.690103 [DOI] [PMC free article] [PubMed] [Google Scholar]
- 29.Lin J., Gan C. M., Zhang X., et al. A multidimensional analysis of genes mutated in breast and colorectal cancers. Genome Research. 2007;17(9):1304–1318. doi: 10.1101/gr.6431107. [DOI] [PMC free article] [PubMed] [Google Scholar]
- 30.Lord P. W., Stevens R. D., Brass A., Goble C. A. Investigating semantic similarity measures across the gene ontology: the relationship between sequence and annotation. Bioinformatics. 2003;19(10):1275–1283. doi: 10.1093/bioinformatics/btg153. [DOI] [PubMed] [Google Scholar]
- 31.Pesquita C., Faria D., Bastos H., Ferreira A. E. N., Falcão A. O., Couto F. M. Metrics for GO based protein semantic similarity: a systematic evaluation. BMC Bioinformatics. 2008;9, article S4 doi: 10.1186/1471-2105-9-s5-s4. [DOI] [PMC free article] [PubMed] [Google Scholar]
- 32.Wang J. Z., Du Z., Payattakool R., Yu P. S., Chen C.-F. A new method to measure the semantic similarity of GO terms. Bioinformatics. 2007;23(10):1274–1281. doi: 10.1093/bioinformatics/btm087. [DOI] [PubMed] [Google Scholar]
- 33.Li W., Deng E., Ding H., Chen W., Lin H. iORI-PseKNC: a predictor for identifying origin of replication with pseudo k-tuple nucleotide composition. Chemometrics and Intelligent Laboratory Systems. 2015;141:100–106. doi: 10.1016/j.chemolab.2014.12.011. [DOI] [Google Scholar]
- 34.Li Y., Zhuang L., Wang Y., et al. Connect the dots: a systems level approach for analyzing the miRNA-mediated cell death network. Autophagy. 2013;9(3):436–439. doi: 10.4161/auto.23096. [DOI] [PMC free article] [PubMed] [Google Scholar]
- 35.Jiang Q., Wang Y., Hao Y., et al. miR2Disease: a manually curated database for microRNA deregulation in human disease. Nucleic Acids Research. 2009;37(1):D98–D104. doi: 10.1093/nar/gkn714. [DOI] [PMC free article] [PubMed] [Google Scholar]
- 36.Singh-Blom U. M., Natarajan N., Tewari A., Woods J. O., Dhillon I. S., Marcotte E. M. Prediction and validation of gene-disease associations using methods inspired by social network analyses. PLoS ONE. 2013;8(5) doi: 10.1371/journal.pone.0058977.e58977 [DOI] [PMC free article] [PubMed] [Google Scholar]
- 37.Grisart B., Coppieters W., Farnir F., et al. Positional candidate cloning of a QTL in dairy cattle: identification of a missense mutation in the bovine DGAT1 gene with major effect on milk yield and composition. Genome Research. 2002;12(2):222–231. doi: 10.1101/gr.224202. [DOI] [PubMed] [Google Scholar]
- 38.Krichevsky A. M., King K. S., Donahue C. P., Khrapko K., Kosik K. S. A microRNA array reveals extensive regulation of microRNAs during brain development. RNA. 2003;9(10):1274–1281. doi: 10.1261/rna.5980303. [DOI] [PMC free article] [PubMed] [Google Scholar]
- 39.Thaller G., Kühn C., Winter A., et al. DGAT1, a new positional and functional candidate gene for intramuscular fat deposition in cattle. Animal Genetics. 2003;34(5):354–357. doi: 10.1046/j.1365-2052.2003.01011.x. [DOI] [PubMed] [Google Scholar]
- 40.Cheng L., Hou Z.-G., Lin Y., Tan M., Zhang W. C., Wu F.-X. Recurrent neural network for non-smooth convex optimization problems with application to the identification of genetic regulatory networks. IEEE Transactions on Neural Networks. 2011;22(5):714–726. doi: 10.1109/tnn.2011.2109735. [DOI] [PubMed] [Google Scholar]
- 41.Clop A., Marcq F., Takeda H., et al. A mutation creating a potential illegitimate microRNA target site in the myostatin gene affects muscularity in sheep. Nature Genetics. 2006;38(7):813–818. doi: 10.1038/ng1810. [DOI] [PubMed] [Google Scholar]
- 42.Lim J., Hao T., Shaw C., et al. A protein-protein interaction network for human inherited ataxias and disorders of Purkinje cell degeneration. Cell. 2006;125(4):801–814. doi: 10.1016/j.cell.2006.03.032. [DOI] [PubMed] [Google Scholar]
- 43.Lin H., Deng E., Ding H., Chen W., Chou K. iPro54-PseKNC: a sequence-based predictor for identifying sigma-54 promoters in prokaryote with pseudo k-tuple nucleotide composition. Nucleic Acids Research. 2014;42(21):12961–12972. doi: 10.1093/nar/gku1019. [DOI] [PMC free article] [PubMed] [Google Scholar]
- 44.Oti M., Brunner H. G. The modular nature of genetic diseases. Clinical Genetics. 2007;71(1):1–11. doi: 10.1111/j.1399-0004.2006.00708.x. [DOI] [PubMed] [Google Scholar]
- 45.Wood L. D., Parsons D. W., Jones S., et al. The genomic landscapes of human breast and colorectal cancers. Science. 2007;318(5853):1108–1113. doi: 10.1126/science.1145720. [DOI] [PubMed] [Google Scholar]
- 46.Mrozek D., Maysiak-Mrozek B., Sinik A. Search GenBank: interactive orchestration and ad-hoc choreography of Web services in the exploration of the biomedical resources of the National Center For Biotechnology Information. BMC Bioinformatics. 2013;14, article 73:9. doi: 10.1186/1471-2105-14-73. [DOI] [PMC free article] [PubMed] [Google Scholar]
- 47.Liu B., Xu J., Zou Q., Xu R., Wang X., Chen Q. Using distances between Top-n-gram and residue pairs for protein remote homology detection. BMC Bioinformatics. 2014;15(supplement 2, article S3):133–139. doi: 10.1186/1471-2105-15-S2-S3. [DOI] [PMC free article] [PubMed] [Google Scholar]
- 48.Pan J.-B., Hu S.-C., Wang H., Zou Q., Ji Z.-L. PaGeFinder: quantitative identification of spatiotemporal pattern genes. Bioinformatics. 2012;28(11):1544–1545. doi: 10.1093/bioinformatics/bts169. [DOI] [PMC free article] [PubMed] [Google Scholar]
- 49.Wei L., Liao M., Gao Y., Ji R., He Z., Zou Q. Improved and promising identification of human microRNAs by incorporating a high-quality negative set. IEEE/ACM Transactions on Computational Biology and Bioinformatics. 2014;11(1):192–201. doi: 10.1109/tcbb.2013.146. [DOI] [PubMed] [Google Scholar]
- 50.Hou Z. G., Cheng L., Tan M., Wang X. Robot Intelligence. London, UK: Springer; 2010. Distributed adaptive coordinated control of multi-manipulator systems using neural networks; pp. 49–69. [DOI] [Google Scholar]
- 51.Liu B., Wang X., Chen Q., Dong Q., Lan X. Using amino acid physicochemical distance transformation for fast protein remote homology detection. PLoS ONE. 2012;7(9) doi: 10.1371/journal.pone.0046633.e46633 [DOI] [PMC free article] [PubMed] [Google Scholar]
- 52.van Driel M. A., Bruggeman J., Vriend G., Brunner H. G., Leunissen J. A. M. A text-mining analysis of the human phenome. European Journal of Human Genetics. 2006;14(5):535–542. doi: 10.1038/sj.ejhg.5201585. [DOI] [PubMed] [Google Scholar]
- 53.Hamosh A., Scott A. F., Amberger J. S., Bocchini C. A., McKusick V. A. Online Mendelian Inheritance in Man (OMIM), a knowledgebase of human genes and genetic disorders. Nucleic Acids Research. 2005;33(supplement 1):D514–D517. doi: 10.1093/nar/gki033. [DOI] [PMC free article] [PubMed] [Google Scholar]
- 54.Ala U., Piro R. M., Grassi E., et al. Prediction of human disease genes by human-mouse conserved coexpression analysis. PLoS Computational Biology. 2008;4(3) doi: 10.1371/journal.pcbi.1000043.e1000043 [DOI] [PMC free article] [PubMed] [Google Scholar]
- 55.Chen H., Zhang Z. Similarity-based methods for potential human microRNA-disease association prediction. BMC Medical Genomics. 2013;6, article 12:215–221. doi: 10.1186/1755-8794-6-12. [DOI] [PMC free article] [PubMed] [Google Scholar]
- 56.Jiang Q., Hao Y., Wang G., et al. Prioritization of disease microRNAs through a human phenome-microRNAome network. BMC Systems Biology. 2010;4, article S2 doi: 10.1186/1752-0509-4-s1-s2. [DOI] [PMC free article] [PubMed] [Google Scholar]
- 57.Katz L. A new status index derived from sociometric analysis. Psychometrika. 1953;18(1):39–43. doi: 10.1007/bf02289026. [DOI] [Google Scholar]
- 58.Li Y., Patra J. C. Genome-wide inferring gene-phenotype relationship by walking on the heterogeneous network. Bioinformatics. 2010;26(9):1219–1224. doi: 10.1093/bioinformatics/btq108.btq108 [DOI] [PubMed] [Google Scholar]
- 59.Vanunu O., Magger O., Ruppin E., Shlomi T., Sharan R. Associating genes and protein complexes with disease via network propagation. PLoS Computational Biology. 2010;6(1) doi: 10.1371/journal.pcbi.1000641.1000641 [DOI] [PMC free article] [PubMed] [Google Scholar]
- 60.Wu X., Jiang R., Zhang M. Q., Li S. Network-based global inference of human disease genes. Molecular Systems Biology. 2008;4, article 189 doi: 10.1038/msb.2008.27. [DOI] [PMC free article] [PubMed] [Google Scholar]
- 61.Mordelet F., Vert J.-P. A bagging SVM to learn from positive and unlabeled examples. Pattern Recognition Letters. 2014;37(1):201–209. doi: 10.1016/j.patrec.2013.06.010. [DOI] [Google Scholar]
- 62.Chen H., Zhang Z. Prediction of associations between OMIM diseases and MicroRNAs by random walk on OMIM disease similarity network. The Scientific World Journal. 2013;2013:6. doi: 10.1155/2013/204658.204658 [DOI] [PMC free article] [PubMed] [Google Scholar]