

Summary
Ribbon synapses convey sustained and phasic excitatory drive within retinal microcircuits. However, the properties of retinal inhibitory synapses are less well known. AII-amacrine cells are interneurons in the retina that exhibit large glycinergic synapses at their dendritic lobular appendages. Using membrane capacitance measurements we observe robust exocytosis elicited by the opening of L-type Ca2+ channels located on the lobular appendages. Two pools of synaptic vesicles were detected: a small, rapidly releasable pool and a larger and more slowly releasable pool. Depending on the stimulus, either paired-pulse depression or facilitation could be elicited. During early postnatal maturation, the coupling of the exocytosis Ca2+-sensor to Ca2+ channel becomes tighter. Light-evoked depolarizations of the AII-amacrine cell elicited exocytosis that was graded to light intensity. Our results suggest that AII-amacrine cell synapses are capable of providing both phasic and sustained inhibitory input to their postsynaptic partners without the benefit of synaptic ribbons.
Keywords: retina, exocytosis, amacrine cell, capacitance measurement, Ca2+ channels, patch clamp electrophysiology, synaptic vesicle pool size, light response, short-term plasticity
Introduction
Visual signals are detected by cone and rod photoreceptors and transferred to cone and rod bipolar cells (RBCs) via ribbon synapses. Mammalian retinas contain a specialized, high sensitivity pathway for scotopic (low light) vision. Under scotopic conditions, the RBCs drive the AII amacrine cells (AII-AC) through ribbon synapses (Tsukamoto et al., 2001). The AII-AC, in turn, splits the incoming signals into ON and OFF channels by making electrical, gap junction contacts at their arboreal dendrites with ON-type cone bipolar cell terminals and glycinergic synapses at their lobular appendages with OFF-type cone bipolar cell terminals and ganglion cells (Famiglietti & Kolb, 1975; Mills and Massey, 1991). The narrow-field AII-AC thus plays a pivotal role in the mammalian retina (MacNeil, et al., 1999; Marc et al., 2014).
The visual system operates over a large range of temporal frequencies (Wässle, 2004; Baden et al., 2014), and there are 10 types of OFF and ON cone-bipolar cells (CBCs), which can be further subdivided according to temporal bandwidth, broadly speaking sustained and transient channels (Baden et al., 2013). Since the RBC to AII-AC pathway is presynaptic to these cone bipolar cells, it must be able to signal across a broader range of frequencies than the individual CBC types. Transmission of low temporal frequencies poses particular challenges for vesicular neurotransmission, as it requires sustained exocytosis. Sustained release of glutamate from hair cells, photoreceptors and bipolar cells is thought to be supported by synaptic ribbons (Matthews and Fuchs, 2010). However, synaptic ribbons are not present at inhibitory synapses. Therefore, we focused our analysis on the properties of synaptic transmission at the AII-AC. Commensurate with sustained signaling, the AII-AC expresses a slowly inactivating L-type Ca2+ channel, composed of the CaV1.3α1 subunit, at its lobular appendages (Habermann et al., 2003). Moreover, the lobular appendages of the AII-AC contain large mitochondria, a dense cloud of synaptic vesicles, and several conventional active zones with an extensive coterie of docked vesicles (Strettoi et al., 1992). These unusual morphological features suggest a large readily releasable pool of vesicles suitable for sustained signaling at low frequencies. However, the size of this pool of vesicles and the rates of release are not known.
Here we report membrane capacitance changes (ΔCm) from mouse AII-AC that likely originate from the fusion of glycinergic synaptic vesicles. Until now, time-resolved Cm measurements have been performed mostly at secretory cells and large nerve terminals that release glutamate (Lindau and Neher, 1988; von Gersdorff and Mathews, 1994; Sun and Wu, 2001; Hallerman et al., 2003). Our study shows that mature mouse AII-AC are specialized for both phasic and graded exocytosis mediated by two pools of synaptic vesicles. The close proximity of the lobular appendages to the AII-AC soma allowed us to perform ΔCm measurements with patch pipette tips located on the AII-AC soma. We observe robust Ca2+-dependent dendritic exocytosis monitored by ΔCm, which occurs only after postnatal day 8 (P8) when Ca2+-current amplitudes become measurable and glycine release is first observed (Schubert et al., 2008). We also find that variations in the intensity of light stimuli onto the retinal slices can modulate the magnitude of AII-AC exocytosis. The fast and sustained exocytosis of the AII-AC thus allows it to transfer inhibitory signals over a broad range of temporal frequencies.
Results
Calcium-dependent exocytosis from AII amacrine cells
AII-ACs were targeted based on their soma position at the border of the inner nuclear and inner plexiform layers, their characteristic soma shape and their thick tapering primary dendrite. AII-AC identity was confirmed by inclusion of 100 μM Alexa Fluor-488 in the patch pipette (Figure 1A and 1B). Imaged AII-AC displayed a primary dendrite with lobular appendages in sublamina-a and thin arboreal dendrites in sublamina-b of the inner plexiform layer. We first studied the passive properties of the cell by measuring capacitive currents in response to −10 mV hyperpolarizing voltage steps, immediately after break-in, with minimal filtering (Figure 1C). The decay time-course of the capacitive current was analyzed by fitting exponential functions (see Experimental Procedures). The capacitive current transients were well-fit with the sum of two exponentials with average time constants: τfast = 291 ± 25 μs and τslow = 1.66 ± 0.14 ms (n=14; see Figure 1C). This suggests that the cell contains at least two separate compartments. One compartment, that is charged quickly, likely reflects the soma, its thick primary dendrite and the lobular appendages, whereas the more slowly charging component may reflect the long and fine processes of the distal dendrites. Integrating the capacitive current for the first 4 ms gives a membrane capacitance Cm = 4.6 ± 0.4 pF (n=14) in good agreement with the average whole-cell capacitance Cm = 4.7 ± 0.2 pF (n=48; see Experimental Procedures and Figure S1).
Figure 1. Capacitance measurements from mouse AII amacrine cells.

A: Schematic diagram of an AII amacrine cell (AII-AC) showing the thick primary dendrite, its lobular appendages (site of glycinergic active zones) and the distal arboreal dendrites (site of rod bipolar cell input and gap junctions). B: Fluorescence image of an AII-AC in a mouse retinal slice. The cell was filled with Alexa fluor-488 (100 μM) via a patch pipette on the soma. The dashed lines demarcate the boundaries of different retinal layers. Scale bar = 10 μm. C: The AII-AC shows a bi-exponential capacitative current decay (fit = blue curve) and a steady-state current during a 10 mV hyperpolarizing voltage step. The time constants are shown as well as the input resistance (Ri), which is calculated from the steady-state current. D: Depolarization-evoked exocytosis from a mouse AII-AC. A membrane capacitance (Cm) change was evoked by a depolarizing step. Experiments were conducted at near physiological temperature (~30°C). The stimulus protocol was composed of three segments: a 2 kHz sinusoidal voltage of 30 mV peak-to-peak in amplitude superposed on the holding potential of −80 mV before and after a 100 ms depolarizing step from −80 mV to −10 mV, which evoked a Ca2+ current. The 2 kHz sine wave was used to measure changes in Cm that reflect the exocytosis of synaptic vesicles. Note the absence of significant changes in series resistance (Rs) and membrane resistance (Rm). E: Voltage dependence of Ca2+ current and membrane capacitance change (ΔCm) in AII-ACs. The ΔCm was evoked by single depolarizing pulse of 200 ms duration, from −80 mV to various membrane potentials (n=5; with temperature at ~28°C). Mean and SEM values are mark ed in solid red circles, whereas open red circles denote individual values. The Ca2+ current was evoked by a voltage ramp from −60 to +30 mV for 100 ms (blue trace; average of 5 cells). The Ca2+ currents and ΔCm are highly correlated for the different membrane potentials.
Using whole-cell patch clamp recordings from the soma of mouse AII-AC we studied capacitance (Cm) changes evoked by depolarizing stimuli with the ‘Sine+DC’ technique (Lindau and Neher, 1988). The close proximity of lobular appendages to the soma allowed time-resolved capacitance measurements with high frequency (2 kHz) sine waves (Oltedal and Hartveit, 2010). To block Na+ and ligand-gated ion channels, all recordings were done in the presence of TTX (1 μM), strychnine (2 μM), SR95531 (3 μM), NBQX (10 μM) or CNQX (10 μM), and DL-AP-5 (50 μM), unless indicated otherwise. Our standard internal pipette solution contained 2 mM EGTA and the external Ringer solution contained 1.15 mM calcium. Under these conditions, a 100 ms depolarizing step pulse from −80 mV to −10 mV elicited a slowly inactivating Ca2+ current followed by a capacitance jump ΔCm = 30.6 ± 3.5 fF (n=6; Figure 1D; temperature at ~30°C). Note that there was little or no change in series resistance (Rs) or membrane resistance (Rm) after the depolarizing pulse, suggesting that membrane conductance artifacts were not present in our ΔCm recordings. A small downward shift in the Rs trace was sometimes observed as expected from a two-compartment model (Hallerman et al. 2003; see Figure S1). Unlike the AII-AC, other non-AII narrow-field or wide-field amacrine cells invariably failed to exhibit ΔCm changes even after a 100 or 500 ms depolarizing pulse (n=10 cells; data not shown; but see Vigh and Lasater, 2004).
We next tested a range of voltage-clamp sine wave frequencies (0.5, 1 and 2 kHz) to determine the ΔCm with 0.1 mM internal EGTA (n=5) in the AII-AC. A 100 ms depolarizing pulse to −10 mV was used (Figure S1). The ΔCm calculated with different sine wave frequencies was very similar (81±3, 82±2, and 80±4 fF for 0.5, 1 and 2 kHz sine wave, respectively). However, increasing the sine wave frequency significantly lowered the resting Cm from about 9 pF to about 5 pF for 0.5 and 2 kHz sine waves, respectively (Figure S1). This indicates that the cell area “sensed” by the sine wave increased for the lower sine wave frequencies that penetrate further into the fine arboreal dendrites. This also suggests that the ΔCm jumps originate from membrane compartments close to the soma. In all the experimental results that follow we thus used 2 kHz sine wave frequencies, which produce lower Cm noise levels (see Figure S1).
If the ΔCm are due to the exocytosis of synaptic vesicles they should be temperature sensitive (Kushmerick et al, 2006). Indeed, the magnitude of ΔCm significantly increased by 58% (n=5; p<0.01), when temperature was raised from 24°C to ~33°C, and an increase in the Ca2+ current amplitude was also observed (Figure S2). Therefore, we measured ΔCm under near physiological temperatures with the standard internal solution containing 2 mM EGTA, except as noted. To further confirm that ΔCm from AII-ACs were not due to artifacts, we also recorded ΔCm from AII cells in rabbit retina, where detailed electron microscopy data indicate the lobules of AII cells have large active zones (Strettoi et al., 1992). Similar to mouse retina, depolarization evoked ΔCm in rabbit AII-ACs (Figure S2). The average resting capacitance was 5.75 ± 1.03 pF (n=5) and ΔCm = 149 ± 19 fF for a 500 ms depolarizing pulse with 2 mM EGTA in the patch pipette. This was nearly double the ΔCm of mouse AII-amacrine cells for a similar stimulus (79 ± 13 fF; n=7; see Figure 4B). This suggests that the larger rabbit AII-AC has a bigger vesicle pool size than the mouse AII-AC.
Figure 4. Distinct vesicle pools in AII amacrine cells.
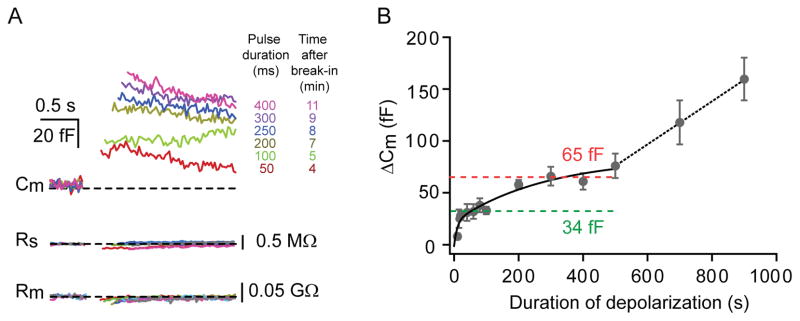
A: An example of an AII-AC stimulated with depolarizing pulses (from −80 to −10 mV) of various durations (−50, −100, −200, −250, −300, −400 ms) at ~30 °C. Note that the associated series and membrane resistances are shown below. The average resting Cm for this cell was 4.12 pF, average Rs was 25 MΩ and average Rm was 0.23 GΩ. Rundown of the responses was not evident in the first 10 minutes after break-in. B: The ΔCm increase with increasing stimulus-duration revealed distinct pools of vesicles. The plot shows the ΔCm evoked by various durations of depolarizing pulses. The ΔCm for each duration of depolarization is shown as mean ± SEM. The solid line is a double exponential fit to the data points with time constants of 9 ms and 286 ms. The green and red dashed lines are the average of the last four saturating ΔCm values, which suggests the existence of two distinct pools of vesicles. The ΔCm values for 700 and 900 ms pulses suggest a further linear increase in ΔCm with pulse duration.
Exocytosis in neuronal chemical synapses is triggered by voltage-gated Ca2+-channels. Accordingly, ΔCm could be elicited by depolarizing steps from −80 mV to various membrane potentials. A Ca2+-current I–V curve was obtained by a ramp protocol from −60 to +30 mV for 100 ms from five cells (see Figure 1E). Note that ΔCm correlated well with the activation range of the Ca2+-current. This linear relationship between ΔCm and Ca2+-current suggests a relatively linear Ca2+ sensor for exocytosis (Thoreson et al., 2004). With a linear Ca2+ sensor, release probability should decline in a linear fashion as Ca2+ currents decline at membrane potentials above the peak Ca2+ current, where the decline in current is due to a reduction in driving force and not to changes in open channel probability (Goutman and Glowatzki, 2007).
To further examine the selectivity of the Ca2+-influx that triggers exocytosis, we tested the putative role of selective blockers of the CaV1.3α1 subunit of the Ca2+ channel, since it is known that this Ca2+ channel subunit is expressed in the AII-AC (Habermann et al., 2003). Bath application of the dihydropyridine Ca2+ channel blockers, nitrendipine (10 μM) or isradipine (1 μM), significantly reduced ΔCm to 7% (n=5; p=0.0005) and 12% (n=5; p=0.0046) of control values, respectively (Figure 2A). This indicates that exocytosis is mediated by L-type Ca2+ channels. Moreover, we examined the effect of modulating Ca2+ influx on exocytosis by elevating external [Ca2+] and altering the internal Ca2+-buffering levels (Figure 2B). Increasing external [Ca2+] from 1.15 mM to 5.15 mM almost tripled the amount of exocytosis (for 1.15 mM: ΔCm = 30.6 ± 3.5 fF, n=7; for 5.15 mM: ΔCm = 83.8 ± 16 fF; n=5; p=0.006). We also examined the effect of different Ca2+-buffering conditions, while keeping the external [Ca2+]o = 1.15 mM. When intracellular EGTA concentration was reduced from 2 mM to 0.2 mM, depolarization-induced ΔCm increased significantly (for 2mM EGTA: ΔCm = 30.6 ± 3.5 fF, n=7; for 0.2 mM EGTA: ΔCm = 75.2 ± 8.5 fF, n=5; p=0.0006). Moreover, replacing internal EGTA with 10 mM BAPTA almost completely suppressed depolarization-evoked ΔCm (4.0 ± 1.2 fF (n=4); p=0.0004) confirming the Ca2+-dependency of exocytosis in the AII-AC.
Figure 2. L-type Ca2+ current evokes exocytosis in AII amacrine cells.

Ai: Capacitance changes in AII-amacrine cells are inhibited by nitrendipine (10 μM) and isradepine (1 μM). Typical depolarization-evoked (500 ms; from −80 to −10 mV) exocytosis (ΔCm) from an AII-amacrine cell under control conditions (black) and after bath application of nitrendipine or isradepine (red). Aii: Bar graph summarizing ΔCm under control conditions and after drug application. Individual cells are represented by open circles. Experiments were performed at 31°C. Statistical significance (paired t-test) is denoted by asterisks. Bi: Top: Average ΔCm traces evoked by depolarization (100 ms pulse from −80 to −10 mV) from AII-AC under different external Ca2+ concentrations (1.15mM: n=6; 5.15mM: n=5). Bottom: Average ΔCm traces evoked by depolarization (100 ms pulse from −80 to −10 mV) from AII-AC for various internal Ca2+ buffer concentrations (10 mM BAPTA: n=4; 2 mM EGTA: n=6; 0.2 mM EGTA: n=5). Bii: Summary plot of ΔCm from individual AII-AC in various external calcium concentrations and internal calcium-buffers. Experiments were conducted at room temperature. Bar graphs denote mean ± SEM. Statistical significance (unpaired-t test) is denoted by asterisks.
Exocytosis in Cx36 knockout mice
AII-AC are coupled by gap junction proteins located in the distal dendrites (Veruki et al., 2008). Therefore, to rule out the possibility of any artifacts or interference in our Cm measurements caused by conductance changes through gap junctions, we compared ΔCm from wild type mice (Cx36(+/+)) with Cx36 knockout (−/−) mice, where the functional gap junction coupling between AII amacrine cells was impaired (Güldenagel et al. 2001, Deans et al., 2002). We isolated the Ca2+-current and the associated ΔCm at different time points after whole-cell break-in (before and after complete dialysis of the internal solution) in both wild type and Cx36(−/−) mice as shown in Figure 3A. Ca2+-currents were evoked by 100 ms depolarizing pulses from −80 to −10 mV. The net inward Ca2+-current was estimated by subtracting the leak current, which was measured with a hyperpolarizing voltage-clamp step of 10 mV or by the application of 1 μM isradipine. In wild-type animals, the Ca2+-current charge transfer evoked by the depolarization remained unchanged when we monitored over several minutes after break-in (at 1 min.: 15.3 ± 3.0 pC, and at 4 min.: 14.3 ± 3.6pC; n=5; p>0.05). Likewise, ΔCm also remained unchanged (at 1 min.: ΔCm = 35.1 ± 6.0 fF and at 4 min. ΔCm = 33.9 ± 6.9 fF; n=5; p>0.05). Similar results were obtained when we used Cx36 (−/−) mice: Ca2+-current charge at 1 min. was 11.6 ± 1.1 pC, and at 4 min. 13.1 ± 1.7 pC (n=5; p>0.05) and ΔCm at 1 min. was 38.8 ± 4.5 fF and at 4 min. it was 38.8 ± 5.2 fF (n=5; p>0.05). In summary, no significant rundown of the Ca2+-current or of ΔCm was observed within the first 4 minutes after break-in in the wild-type or mutant mice. We also used meclofenamic acid (100 μM; MFA), a pharmacological blocker of gap junctions, to suppress gap junction conductance between AII-ACs (Veruki and Hartveit, 2009; Borowska et al., 2011). The ΔCm were evoked by 100 ms depolarizing pulses from −80 mV to −10 mV. Similar to the Cx36 mutant mice results, the ΔCm obtained with and without bath application of MFA were not significantly different from each other (control: 37.5 ± 6.7 fF (n=7); MFA: 28.5 ± 5.9 fF (n=4); p=0.39). These results indicate that gap junction conductance is unlikely to produce ΔCm artifacts under our recording conditions.
Figure 3. ΔCm in wildtype and Cx36(−/−) knockout mice.

Ai & Aii: Sample recordings of depolarization evoked Ca2+ currents (ICa) and resultant changes in membrane capacitance (Cm) from AII amacrine cells of a wild type (Cx36 +/+, Ai) and connexin 36 knockout (Cx36 −/−, Aii) mouse. Top traces show the Ca2+ current elicited by a 100 ms depolarizing pulse from −80 to −10 mV at 1 min (red) and 4 min (blue) after break-in. The ΔCm jumps are shown below. The bottom panels show summary graphs of ICa2+ charge and corresponding ΔCm from several cells at each condition. Bar graphs denote mean ± SEM.
Release rates from two distinct vesicle pools
To estimate the size of the readily releasable pool of vesicles we performed ΔCm measurements using depolarizing pulses of different durations. Figure 4A shows an example of a typical recording from a single AII-AC. The ΔCm increased with increasing pulse duration for the first 11 minutes after break-in to whole-cell mode, however, they began to decrease after that, presumably due to a rundown of the exocytotic process. The rundown of ΔCm presumably reflects loss of vital intracellular constituents via diffusion into the recording electrode. Therefore, we pooled ΔCm data obtained from a given cell only during the first 10 minutes after break-in to whole-cell mode. The magnitude of ΔCm increased with the duration of the depolarizing pulse, following a double exponential function with time constants of about 10 ms (τ1) and 280 ms (τ2). This suggests that an initial pool of vesicles undergoes rapid exocytosis, and is quickly depleted, while a second pool of vesicles can undergo exocytosis albeit with much slower kinetics (Figure 4B). The first pool of vesicles appears to be completely depleted (saturation of ΔCm) within about 30 to 50 ms when the AII-AC was strongly depolarized. The second pool emerged when we increased pulse duration to greater than 100 ms and seems to saturate at about 200–300 ms. The rapidly releasing pool appears to have a small size (ΔCm = 34 fF) and the addition of the slowly releasing pool made ΔCm plateau at about 65 fF. This was estimated by averaging the last four apparently saturating ΔCm values in the first and second component of the exponential fit to the data. Vesicle pool size was determined by dividing the saturating ΔCm value by the capacitance of a single vesicle. The capacitance of a single spherical vesicle cv = πd2cs, where d is the vesicle diameter and cs = 9–10 fF/μm2 (specific membrane capacitance of bilayer membranes). Previous measurements of glycine-containing synaptic vesicle diameters (Tatsuoka and Reese, 1989) revealed that d = 37 nm, so cv = 45 aF. The first pool would then correspond to about 750 vesicles, and the sum of the first and second pool would correspond to about 1400 vesicles. We suggest that the first pool may correspond to those vesicles docked and primed for exocytosis at all the active zones of the lobular appendages, whereas the second pool may constitute those vesicles clustered near the active zones (Strettoi et al 1992), or vesicles docked further away from Ca2+ channels. Furthermore, longer depolarizing pulses of 700 ms and 900 ms evoked an average ΔCm of 120 fF and 170 fF, respectively, suggesting that ΔCm does not saturate for prolonged depolarizations (n=7; Figure 4B).
Short-term plasticity of exocytosis
Short-term changes in exocytosis may enhance the ability of synapses to transmit light-evoked information within the neuronal networks of the inner plexiform layer of the retina (Vickers et al., 2012). Therefore, to examine synaptic plasticity at the inhibitory synapse formed by AII-AC, we delivered paired-pulse depolarizing stimuli (from −80 mV to −10 mV for 20 ms) and varied the inter-pulse interval (0.5, 1.0, 1.5, 2.0, 2.5 s) under whole-cell voltage clamp recording conditions at near physiological temperature. The sine wave delivered between the inter-pulse interval revealed the magnitude of exocytosis. Typical responses from an AII-AC for various inter-pulse intervals are shown in Figure 5A. Varying the inter-pulse interval reveals both short-term depression and facilitation. To understand if these short-term changes involve modulation of Ca2+ influx and/or changes in the vesicle pool size, we isolated the Ca2+ currents evoked by the depolarizing pulses for two different inter-pulse intervals (0.5 and 2.0 s) as shown in Figure 5B. The short-term plasticity of ΔCm was quantified as the paired-pulse ratio (PPR) of ΔCm evoked by the second pulse divided by ΔCm evoked by the first pulse (Figure 5C). ΔCm evoked with inter-pulse intervals <1.5 s, displayed synaptic depression, whereas facilitation was observed with longer inter-pulse intervals (>1.5 s). With inter-pulse intervals of 0.5, 1.0, 1.5, 2.0, 2.5 s, the PPRs were 0.54 ± 0.04 (n=14), 0.62 ± 0.06 (n=5), 0.90 ± 0.04 (n=5), 1.25 ± 0.03 (n=10), 1.0 ± 0.1 (n=3), respectively. Depression was more pronounced when the inter-pulse interval was short (e.g. 0.5 s), whereas facilitation was only obvious when the inter-pulse interval was 2 s. This slow time course of facilitation contrasts greatly with that found at hair cell synapses, which show facilitation at inter-pulse intervals of 20 to 50 ms (Cho et al., 2011), and at other synapses (Xu-Friedman and Regehr, (2004). However, no significant change in the Ca2+ current was observed at these inter-pulse intervals indicating that vesicle pool size depletion likely underlies depression, while residual Ca2+ decay may underlie the facilitation seen at 2 s inter-pulse intervals. A slow Ca2+ removal process in the lobules may contribute to this unusually lengthy facilitation (see Figure 7). Short-term plasticity is thus a prominent feature of AII-AC exocytosis and is likely to have significant functional implications for retinal signal processing depending on the light stimulation frequency of the retina.
Figure 5. Paired-pulse depression and facilitation at AII amacrine cell synapses.

A: Schematic diagram of the voltage-clamp protocol. AII-ACs were depolarized from −80 mV to −10 mV for 20 ms. The stimulation consisted of paired-pulses with various inter-pulse intervals. The bottom traces show examples of Cm changes evoked by two identical 20 ms depolarizing pulses at several inter-pulse intervals starting at 0.5 seconds apart and then with increments of 0.5 seconds. Note the paired-pulse depression for an inter-pulse interval of 0.5 s and paired-pulse facilitation for interpulse interval of 2.0 s. Bi, Bii: Typical example of ICa2+ evoked during paired-pulse stimulation at two different inter-pulse intervals: 0.5 and 2.0 s. The first ΔCm was denoted ΔCm1 and the second was denoted ΔCm2. Note that the Ca2+ current did not change from the first to the second pulse. C: The averaged ratio of ΔCm (ΔCm2/ΔCm1) evoked by a pair of 20 ms depolarizing steps with inter-pulse interval of 0.5, 1.0, 1.5, 2.0, 2.5 s. The mean values are shown by the filled circles, whereas individual values are denoted by open circles. For inter-pulse intervals less than 1.5 s the responses exhibit short-term depression (ΔCm2/ΔCm1 <1), whereas for inter-pulse intervals of 2.0 s they show facilitation (ΔCm2/ΔCm1 >1).
Figure 7. Calcium imaging in developing AII amacrine cells.

A, B, C: The z-projection of AII cells (P8, P10 & P25) imaged with a two-laser spinning disc confocal microscope. The cell was filled with Alexa Fluor-594. Ca2+ transients were computed as the change in green fluorescence of the dye Oregon Green 488 BAPTA-1 (100 μM) from the region of interests (ROIs) marked in circles of different colors. Scale bar: 10 μm. Traces showing ΔF/F from the ROIs outlined in the z-projection for a single depolarizing pulse (from −80 mV to −10 mV for 100 ms). Vertical dashed lines represent the stimulus onset. At P8, no calcium influx was observed at any of the ROIs. At P10, small Ca2+ transients were observed in the soma (s), proximal dendrites (PD), and lobular appendages (L), but not the distal dendrites (D). At P25, large Ca2+ transients were observed in the lobular appendages (L), and small Ca2+ transients were observed in the soma (s) and proximal dendrites (PD). D: A 3-D bar graph showing the mean of ΔF/F from ROIs of the soma, proximal dendrites (PD), distal dendrites (DD), and lobules (Lob). Other analyzed parameters are shown in Supplementary Figure S3.
Developmental maturation of transmitter release
Maturation and stabilization of the molecular components of CNS synapses occurs during the first few weeks of postnatal development (Fedchyshyn and Wang, 2005; Cnops et al, 2007; Renden and von Gersdorff 2007). Developmental studies indicate that mouse OFF-cone bipolar cells receive glycinergic input at about postnatal day 10 (P10; Schubert et al., 2008). This emergence of glycinergic input via spontaneous IPSCs (sIPSCs) onto OFF-cone bipolar cells was assumed to occur because of an age-dependent synaptic maturation of the AII-ACs, which are presynaptic to OFF-cone bipolars (Schubert et al., 2008). We thus investigated the properties of exocytosis in AII-AC between P8 and P40. The ΔCm was evoked by a depolarizing pulse of 100 ms from −80 to −10 mV. Typical ΔCm from three different postnatal ages are shown in Figure 6A. ΔCm were negligible around P8 and P9 (P8: 3.8 ± 0.8 fF (n=18); P9: 7.3 ± 1.9 fF (n=24), and started emerging at P10 (13.5 ± 3.9 fF; n=9) as shown in the summary plot of Figure 6C. Significant ΔCm appeared after P10 and stabilized around P15 (44.3 ± 6.3 fF; n=6). No further increase in ΔCm was observed after P15 when compared to the oldest age group we studied (>P30, 39 ± 3.8 fF; n=13).
Figure 6. Developmental changes in exocytosis at AII amacrine cell synapses.

A: Typical examples of average depolarization-evoked ΔCm for a 100 ms pulse from −80 to −10 mV (given at the arrow) from AII-AC at three different postnatal ages (P9, P11, and P15; average of 2 to 3 traces). B: The graph shows ΔCm against calcium influx (as Ca2+ charge) at three different age groups (P8, P9 and >P25) indicated in different colors. Filled circles denote the mean ± SEM and open circles denote individual cells. C: Graph of individual ΔCm from different cells from postnatal day P8 to >P25 animals. Filled circles denote the mean ± SEM and open circles denote individual cells. This experiment was performed at ~33°C with 1.15 mM external Ca2+. Recordings with 2 mM EGTA in the pipette solution are shown in black, whereas recordings with 0.2 mM EGTA in red. D: Bar graph showing ΔCm as mean ± SEM from P8 and P9 animals with 2.0 and 0.2 mM EGTA. Statistical significance was tested with an unpaired t-test denoted by asterisks.
We also compared the ΔCm with the corresponding Ca2+ charge at different age groups (Figure 6B). At P8, the Ca2+ charge was significantly lower (2.6 ± 0.9 pC; n=5) than at P9 (15.2 ± 3.9 pC; n=12; p=0.0678). However, ΔCm at P8 and P9 were not significantly different, because although there was a sizable Ca2+ current at some P9 cells these displayed relatively small ΔCm indicating the amount of exocytosis per Ca2+ influx was quite low. Calculating the efficiency of exocytosis (ΔCm divided by the corresponding Ca2+ charge: ΔCm/QCa2+) revealed inefficient exocytosis at P9 (0.38 ± 0.15 fF/pC; n=7) which was significantly different from that at >P25 mice (1.93 ± 0.44 fF/pC; n=5; p=0.003). Note that in this analysis we included only cells that displayed >10 pC of Ca2+ charge at P9 for a better comparison with the more mature AII-AC which always had sizable Ca2+ charges. In these developmental studies, we used 2 mM EGTA in the patch pipette. However, since immature synapses could express a lower concentration of Ca2+ binding proteins, we also tested the effects of 0.2 mM EGTA in P8 and P9 mice. No ΔCm were detectable at P8, but at P9 a significant ΔCm was observed with 0.2 mM EGTA (Figure 6D). This suggests that Ca2+ channels may not be tightly colocalized with docked vesicles at P9 and, therefore, 2.0 mM EGTA is enough to significantly block exocytosis at P9.
Ca2+ imaging in AII-amacrine cells during postnatal development
To localize the sites of Ca2+ influx and study the developmental emergence of ΔCm with levels of Ca2+ influx, we performed Ca2+ imaging in AII-amacrine cells with 100 μM Oregon Green BAPTA-1 along with a volume marker 100 μM Alexa Fluor 594. We measured changes in [Ca2+]i evoked by a 100 ms step depolarization from −80 mV to −10 mV from different regions of interest (ROIs; marked with colored circles) at various ages. Figure 7A–C shows typical Ca2+ transients as changes in fluorescence (ΔF/F) of Oregon Green from the ROIs. Ca2+ transients observed in different compartments of three different age groups are summarized in Figures 7D and S3.
At P8, none of the compartments we examined displayed Ca2+ influx upon depolarization (Figure 6A). However, at P10, clear Ca2+ transients appeared in all the compartments except the distal arboreal dendrites (Figure 7B). Note the prominent [Ca2+]i change in the proximal dendrite at P10. In more mature animals (P25), among the ROIs we analyzed, [Ca2+]i levels increased sharply only in the lobular appendages, whereas the changes in the proximal dendrites were very small and no changes were observed in the distal dendrites (Figure 7C; see Habermann et al., 2003; Borghuis et al., 2011). The peak ΔF/F increase in 18 lobules from 5 different cells was 0.457 ± 0.07, whereas the soma of 5 cells displayed a significantly smaller ΔF/F = 0.12 ± 0.04 ΔF/F (P=0.002), and in the distal dendrites an even smaller ΔF/F = 0.08 ± 0.01 ΔF/F (p=0.0001; Figure S3). This suggests that Ca2+ channel clusters are located preferentially at the lobular appendages, the sites of specialized active zones with docked synaptic vesicles (Strettoi et al 1992). These results indicate that under our space-clamp and voltage-clamp conditions, we could elicit [Ca2+]i changes from all the lobular appendages with patch pipettes located on the AII-AC soma.
ΔCm evoked by light pulses
We have shown that depolarization of the AII-AC soma triggers exocytosis. However, during physiological conditions, depending on the background illumination levels, rod bipolar cells release glutamate onto the distal dendrites to evoke EPSPs, or the ON-cone bipolar cells depolarize AII-AC through their gap junctions (for cross-over inhibition of OFF-bipolar cells), which can both trigger exocytosis of glycine at the lobular appendages (Xin and Bloomfield, 1999; Pang et al., 2007). Therefore, we attempted to evoke exocytosis in AII-AC with more physiological stimuli, namely light flashes of various intensities. To accomplish this, we used dark-adapted mouse retinal slices to activate the rod pathway and we excluded Na+ or ligand-gated ion channel blockers from the external solution. Experiments were performed at 33–34°C with a K +-based pipette solution (Experimental Procedures). The light stimulation was delivered during a current-clamp step, placed between two voltage clamp steps with a 2 kHz sinusoidal voltage (30 mV peak-to-peak amplitude on a −80 mV holding potential; Figure 8A).
Figure 8. Light-evoked exocytosis in AII-amacrine cells.

A: Schematic diagram showing the convergence of the rod circuitry and the experimental setup. Several rod photoreceptors synapse onto one rod bipolar cell (RBC) and several RBCs synapse onto one AII-AC. The AII-AC was patched at the soma and held at −60 mV in the whole-cell voltage-clamp configuration. The stimulus protocol was composed of three segments: 1) a 2 kHz sinusoidal voltage of 15 mV peak-to-peak in amplitude superposed on the holding potential (−60 mV), 2) a current-clamp segment (1.5 s duration) during which a light flash of varying intensity was delivered (0.17, 0.67, 1.33, 10.67,170.67 photons/μm2, respectively), and 3) a 2 kHz sinusoidal voltage of 15 mV peak-to-peak in amplitude superposed on the holding potential (−60 mV) to measure Cm changes.
B: Retinal slices from dark-adapted mice were used to record light responses and the Cm was measured before and after the light response. Top traces: Example of a light-evoked voltage response of an AII-AC to a dim and bright light flash (0.67 and 170.67 photons/μm2). The red bar indicates the timing of the light stimulus onset. Bottom traces: The Cm traces are responses to a single light stimulus (dim or bright) yielding ΔCm of 88 fF and 158 fF, respectively. The superimposed black trace is the average value of the Cm data points.
C: Summary of ΔCm evoked by various light intensities from 17 AII-ACs. Black circles with error bars represent the mean ± SEM. The open circles are individual data points. The data was fit with a sigmoid function: base + max/(1 + exp((x0 − x)/rate)). The amount of exocytosis varies as a graded function of the light intensity and saturates at bright light intensities. Green circles are ΔCm changes from experiments conducted with a Cs-based internal solution in the pipette and evoked by the voltage response from a light-stimulus of 170.7 photons/μm2 (bright flash). There was no significant difference in ΔCm changes between Cs-based and K-based experiments (p value: 0.965).
We examined the magnitude of exocytosis for light intensities of 0.17, 0.67, 1.33, 10.67, 170.67 photons/μm2. Light flashes evoked depolarizing responses during the current clamp segment of the protocol as shown in Figure 8B. Note that small action potentials (spikelets) are present in the AII-AC light response and these are likely generated by the axon-initial-segment-like process of AII-AC (Wu et al., 2011; Cembrowski et al., 2012). As shown in Figure 8C, the light stimuli produced ΔCm jumps that were correlated with light intensity. For dim flashes (0.67 photons/μm2) the average ΔCm was 44 ± 10 fF (n=6), whereas at 10.67 photons/μm2 the ΔCm was significantly higher (119 ± 31 fF; n=6; p<0.05). However, when we further increased the light intensity to 170.67 photons/μm2, no further increase in ΔCm was observed (108 ± 22fF; n=4; p=0.8). To confirm these results obtained with K-based internal solution we also performed experiments with a Cs-based internal pipette solution that were done entirely in the voltage-clamp mode and used a bright light response as the voltage-clamp depolarizing protocol (green circles in Figure 8C; n=4; see also Figure S4). In these Cs-based experiments the retina was light adapted and perfused with the standard external solution with ion channel blockers. We found no significant difference in ΔCm between the Cs-based and K-based experiments (p-value: 0.965).
The light responses of mouse AII-AC may vary among the sub-types of these cells (Pang et al., 2012). However, a depolarizing pulse from a holding potential of −80 mV to −10 mV for 500 ms elicited on average a ΔCm change that was similar to those elicited by the light response (see Figure S4). A strong correlation was observed between the light-evoked peak membrane voltage of the AII-AC and the corresponding ΔCm after various light stimuli (correlation coefficient: r=0.627; 127 trials from 17 cells). A plot of ΔCm as a function of the peak value of the light response and as a function of the integral of the light response shows a non-linear dependence of ΔCm on both of these parameters (see Figure S5). The AII-AC thus has the ability to recruit vesicles for exocytosis from a large reserve pool. In summary, these results demonstrate that AII-ACs are specialized for graded inhibition of their postsynaptic contacts through their lobular appendages according to the level of light intensity.
Discussion
In the present study, we made time-resolved Cm measurements from glycinergic AII-AC cells in the mouse retina. We found that exocytosis was evoked by activation of L-type Ca2+ channels, which we localized to dendritic lobular appendages. We also studied the maturation of exocytosis and Ca2+ influx during the first few weeks of postnatal development. Our data revealed the presence of two large readily releasable pools of vesicles in mature AII-ACs. From the sensitivity of exocytosis to EGTA, we suggest that Ca2+ channels are more tightly colocalized with docked vesicles as the synapse matures. We also revealed the presence of paired-pulse depression and facilitation of exocytosis. Furthermore, we demonstrate that the magnitude of exocytosis is graded to the intensity of the light stimulus. Although this is a specialized retinal synapse, some of the results may share features with other inhibitory interneuron synapses and with dendritic exocytosis at other CNS neurons (Jullié et al., 2014).
Capacitance measurements in cells with complex morphology
Membrane capacitance measurements have been extremely useful to study single cell secretion and synaptic transmitter release (Neher and Marty, 1982), but they have been performed mostly from neuroendocrine cells and large nerve terminals with relatively simple morphologies and electrotonic structures (Kushmerick and von Gersdorff, 2003; Kawaguchi and Sakaba, 2015). However, there are several examples of successful measurements of ΔCm from cells with complex geometry and multiple electrical compartments (Hsu and Jackson, 1996; Mennerick et al. 1997; Hallermann et al., 2003; Oltedal and Hartveit, 2010). Similarly, the results presented here indicate that conventional lock-in sine wave methods applied to AII-ACs produce reliable ΔCm measurements that closely correlate with the duration and magnitude of the voltage-gated Ca2+ current (Figure 1E and 4B). This success is likely due to the favorable morphology, including the location of large active zones in lobular appendages that are electrotonically close to the cell body (Strettoi et al., 1992; Vardi and Smith, 1996). The proximity of the active zones to the patch pipette (i.e. the voltage-clamp source) is further supported by the finding that reducing the sine wave frequency from 2 kHz to 0.5 kHz had no influence on the magnitude of ΔCm, but resulted in a larger resting cell capacitance, consistent with frequency-dependent attenuation of the voltage-clamp signals, with the higher frequencies being more strongly attenuated with distance from the soma, and hence resulting in progressively smaller overall estimates of the total membrane capacitance (Figure S1).
Sustained exocytosis from dendritic lobular appendages
The magnitude of ΔCm as a function of pulse-duration suggested the presence of two pools of synaptic vesicles, a smaller pool that is released within the first 10–20 ms, and a second pool that is recruited with a time-constant of about 280 ms (Figure 4B). Our study thus indicates the existence of at least two distinct pools of vesicles at an inhibitory synapse (Hablitz et al., 2009). Furthermore, depolarizing pulses with duration of 700 ms and 900 ms evoked a further linear rise in ΔCm that does not saturate. This suggests a sustained and rapid supply of vesicles to the active zone, as is required for continuous glycine release by AII-AC under steady background light levels.
Overall, the results indicate that the AII amacrine is capable of sustained exocytosis without the benefit of a synaptic ribbon (Figure 4B and S5). This robust exocytosis suggests that the AII-AC is capable of prolonged release of glycine from its lobular appendages, which are equipped with a compartment-specific molecular repertoire (Demb and Singer 2012). Moreover, there is a tonic crossover inhibition to the OFF-alpha ganglion cell from the AII-AC and this implies that the AII-AC must be capable of tonic exocytosis and a continuous release of glycine (Murphy and Rieke, 2006; Münch et al., 2009; van Wyk et al., 2009). Accordingly, the lobular appendages of the AII-AC have a high density of synaptic vesicles that is similar to that of bipolar cell terminals (≈ 1500 vesicles/μm3; Marc et al., 2014).
The lobular appendages of the AII-AC originate from the primary dendrite and are thus a dendritic compartment of the AII-AC. The mechanisms that control exocytosis from the dendrites of CNS neurons are still not well understood (Kennedy and Ehlers, 2011). The AII-AC may thus provide a useful model system for dendritic exocytosis, although we emphasize that it may have evolved highly specialized dendritic structures to carry out complex signal processing in the mammalian retina.
Developmental changes in ΔCm and Ca2+ influx
An elegant developmental study showed that spontaneous glycinergic IPSCs in mouse OFF-cone bipolar cells first appear at P9 (Schubert et al., 2008). After this age the spontaneous IPSCs become stable and robust. OFF-cone bipolar cells terminals are postsynaptic to AII-AC (Strettoi et al., 1992). Remarkably, our developmental study of ΔCm indicated that both the Ca2+ current and ΔCm are very small at P8, but the Ca2+ current becomes larger at P9 and ΔCm become significantly larger at P10 (Figure 6B and 6C). Moreover, Ca2+ imaging experiments showed that depolarizing pulses did not alter [Ca2+]i at P8, suggesting that Ca2+ channels are non-functional or not yet inserted into the plasma membrane at this early stage (Figure 7A). However, clear [Ca2+]i changes occurred at P10, although these were not as large as those in P25 (Figure 7B and 7C). In addition, the [Ca2+]i changes at P10 occurred most strongly at the proximal dendrite and then in the lobules, whereas at P25 the reverse was true (Figure 7C and S3). This suggests that the Ca2+ channels are initially not well localized to the lobular appendages at P10, but become highly localized to the lobules at P25. Our Ca2+ imaging results in mature AII-ACs are in excellent agreement with previous imaging studies in adult AII-ACs (see Habermann et al., 2003 and Borghuis et al., 2011). Moreover, our developmental studies, together with those of Schubert et al. (2008), strongly suggest that glycine release from mature AII-AC occurs mostly from conventional active zones in the lobular appendages, which contain ≈ 0.6 mM glycine (Marc et al., 2014). It thus seems likely that ΔCm reflects the fusion of glycine-containing synaptic vesicles.
Previous serial electron microscopy of mouse AII-AC have indicated a wide spread in the total number of conventional active zones: an early study indicated 19 synapses (Tsukamoto et al., 2001) and a recent reconstruction of the output synapses of AII-AC shows an average of 92 ± 15 synapses (n=3; Tsukamoto and Omi, 2013). About 8 of these are located on the soma. So perhaps about 10% of the exocytosis may be occurring in the soma where we do see rises in Ca2+ influx (Figure 7D). Our observed heterogeneity of ΔCm jumps (e.g. Figure 6C and 8C) may be attributable to differences in the number of synapses per lobule, or the number of lobules, in different AII-ACs.
Development changes the Ca2+ channel to exocytosis Ca2+ sensor coupling
We found that the ΔCm jumps at the immature postnatal ages of P9 and P10 were particularly sensitive to the slow calcium chelator EGTA, reflecting a long coupling distance between the Ca2+ channels and Ca2+ sensors for exocytosis. Indeed, 2 mM EGTA effectively blocked ΔCm in P9 but not in P25 animals (Figure 6C). However, changing the buffer concentration from 2.0 mM to 0.2 mM EGTA allowed sizable ΔCm to occur at P9. Note that ΔCm in P25 also were larger in 0.2 mM EGTA than in 2.0 mM EGTA (Figure 2Bii), although this difference was not as large as in P9 mice. We thus propose that the coupling distance between the Ca2+ channels and the exocytosis sensor becomes shorter as the AII-AC matures (Kim et al., 2013; Vaithianathan and Matthews, 2014). However, the residual sensitivity of the mature AII-AC to different amounts of EGTA indicates that the lobular synapses use Ca2+ microdomain type signaling for transmitter release, instead of the tighter Ca2+ nanodomain coupling seen at other inhibitory synapses (Eggermann et al., 2012). In summary, although the mature lobular appendages have conventional synapses, they have specialized features such as two large pools of vesicles, expression of L-type Ca2+ channels, and a microdomain type of colocalization of Ca2+ channels and exocytosis sensors, which support their ability to sustain high vesicle release rates in both a fast, phasic manner and a slower, graded and sustained manner without the benefit of synaptic ribbons.
Functional implications for retinal microcircuits
Glycinergic AII-AC are bistratified neurons with dendrites located in both the OFF and ON sublaminae of the IPL (Figure 1A and 1B). They can thus create cross-talk between the parallel ON and OFF pathways (Liang and Freed, 2012). Indeed, although the AII-AC receives its major excitatory input from rod bipolar cells, an important role of the AII-AC is driving OFF-alpha ganglion cells via the shutoff of a tonic inhibitory input (Murphy and Rieke, 2006; Arman and Sampath, 2012). The strong inhibitory output of the AII-AC to the OFF layer of the retina, thus, shapes the light responses of OFF-cone bipolar cells and ganglion cells. Indeed, the terminals of OFF cone bipolar cells express fast α1 glycine receptors (Sassoè-Pognetto et al., 1994; Wässle et al., 2009). This inhibition has been proposed to act in concert with excitation to linearize retinal signaling (Taylor and Smith, 2011; Werblin, 2011). Our study further supports the capacity of the AII-AC to rapidly invert sustained depolarizing signals correlated with different light levels into inhibition in the OFF layer of the IPL. Further, we also observed short-term plasticity of exocytosis (Figure 5). This plasticity may be relevant for some types of synaptic adaptation where the retina adjusts its visual information processing dynamically to changes in image statistics (Hosoya et al., 2005). Inhibitory microcircuits are also involved in fast and slow contrast adaptation and the time scales of short-term plasticity we uncover here may be relevant for some forms of fast retinal adaptation (Baccus and Meister, 2002). Moreover, inhibitory microcircuits also play a crucial role in the modulation of the dynamic range of ganglion cell output (Wässle, 2004; Sagdullaev et al., 2006). Thus, the specialized dendritic structure of AII-AC can support the diverse patterns of retinal activity under different ambient light levels with both fast and sustained inhibition to its postsynaptic partners.
Experimental Procedures
Retinal slice preparation
All procedures followed IACUC approved OHSU protocols. Experiments were performed on retinae isolated from 1 to 8 week old wild-type mice (C57BL6), ~5 week old pigmented rabbits, and from Cx36 knockout mice (generated using heterozygous crossing; Hormuzdi et al., 2001). Young mice were used only during developmental studies. The mice were deeply anaesthetized with isoflurane (Novplus) and retinae were dissected free of the eye-cup in carbogen-bubbled (95% O2 and 5% CO2) Ames’ medium (US biologicals) at room temperature. Rabbits were sedated by intramuscular injection of ketamine (50 mg/kg) and xylazine (10 mg/kg), followed by surgical anesthesia using intravenous sodium pentobarbital (100 mg/kg). After enucleation, the animal was euthanized by sodium pentobarbital and potassium chloride injection. Slices (200 μm) were made from retina embedded in low melting temperature agarose (Sigma type VIIA, 3% in Ames medium). The cells were viewed by differential interference contrast with a water immersion objective (40x, Zeiss) on a fixed stage, upright microscope (AxoExaminer A1, Zeiss). Slice recordings were performed at room temperature (21–23°C) or near physiological tempera ture (30–34°C). The All-AC were visually targeted by the location of their cell body at the border between the inner nuclear layer and the inner plexiform layer (IPL) and by their relatively thick primary dendrite that tapers as it descends into the IPL. After electrophysiological recordings, cells were imaged at different focal planes with a CCD camera (QIClick) controlled by a QCapture suite of imaging software (Qimaging). Alexa Fluor 488 (100 μM) was included in the intracellular pipette solution as a morphological marker.
Electrophysiology
Whole-cell voltage clamp recordings were obtained using 8–10 MΩ patch pipettes pulled from thick-walled borosilicate glass (1B150F-4, World Precision Instruments) using a Narishige puller-PP830. Pipettes were pressure polished and coated with dental wax (Cavex) to reduce stray capacitance and electrical noise and filled with solution comprising the following (in mM): 40 CsCl, 60 Cs-gluconate, 10 TEA-Cl, 28 HEPES, 3 Mg-ATP, 1 Na-GTP, 2 EGTA, and pH=7.3 with CsOH. Data acquisition was controlled by Pulse software (HEKA Elektronik), and signals were recorded via a double EPC-9 or EPC-10 (HEKA Elektronik) patch-clamp amplifier. Sampling rates and low-pass filter settings were 10 and 2 kHz, respectively. When indicated P/4 leak subtraction was performed by applying four leak pulses starting with a 10 ms delay after the termination of the test depolarization. Capacitance measurements were performed by the “sine+DC” method, in which a 2 kHz sinusoidal voltage command (30 mV peak to peak) was added to the holding potential of −80 mV, and the resulting current was analyzed at two orthogonal phase angles by a software emulator of a lock-in amplifier (Gillis, 2000). The average series resistance Rs = 33.0 ± 1.4 MΩ, membrane resistance Rm = 0.62 ± 0.06 GΩ and baseline capacitance Cm = 4.7 ± 0.2 pF (n=48) in the whole cell mode. The voltage-clamp time constant was ~150 μs for AII-AC. To avoid voltage-clamp errors and artifacts in calculating Cm all cells with high Rs > 40 MΩ were excluded from any analysis (Gillis, 2000). Series resistances were compensated by 40–50%. To measure the passive membrane properties currents elicited by 10 mV hyperpolarizing voltage steps were filtered at 15.6 kHz.
Light stimulation experiments
For recordings of light-evoked responses, animals were dark-adapted for at least 12 hours and all subsequent manipulations were performed under dim red or infrared illumination. Mice were anesthetized by intraperitoneal injection of sodium pentobarbital (0.1 ml, 100 mg/ml) and euthanized by cervical dislocation. The eye was enucleated, the anterior eye removed, and the retina isolated from the posterior eyecup in Ames’ medium. The retina was mounted ganglion cell side down on 0.8 μm cellulose membrane filter paper (Millipore, Bedford, MA) and vertically sliced at 250–300 μm using a Vibratome 600 tissue chopper. Slices were mounted vertically, transferred to the recording chamber, and viewed with an Olympus BX51 microscope with a 40x water-immersion objective (NA 0.8) using infrared gradient contrast optics and a CCD camera system. Slices were perfused at a rate of ~3 ml/min with bicarbonate-buffered Ames’ medium (US Biologicals, Swampscott, MA) bubbled with 95% O2 and 5% CO2. The internal solution contained (in mM): 60 KCl, 55 K- gluconate, 28 HEPES, 3 Mg-ATP, 1 Na-GTP, 2 EGTA, 10 Tris-phosphocreatine and pH=7.3 with KOH. The average Rs = 28.5 ± 1.8 MΩ, membrane resistance Rm = 0.92 ± 0.08 GΩ and baseline capacitance Cm = 6.0 ± 0.3 pF (n=19) in the whole cell mode. Full-field light stimuli were applied with a light-emitting diode (LED, peak emission at 525nm) that illuminated the back of a white plastic diffuser. The light was projected through the microscope objective and was collimated to generate uniform illumination at the retinal preparation. Flash intensity was controlled by altering the duration of the flash from 0.01 to 20 ms, which is within the integration time of mouse rod photoreceptors (~200 ms, Burns et al., 2002). Light intensity was calibrated using a UDT photometer (UDT Instruments, San Diego, CA) and converted to photons/μm2. An EPC10 amplifier controlled by Patchmaster software was used to rapidly switch between voltage-clamp and current-clamp recording modes.
Calcium imaging
For Ca2+ imaging experiments, 100 μM Oregon Green BAPTA1, a Ca2+-sensitive fluorescent dye, was added to the internal solution, which also contained 2 mM EGTA. In addition, 100 μM Alexa 594 was included in the patch pipette solution to visualize amacrine cell morphology. Fluorescence from retinal neurons was visualized with a 60x water-immersion objective combined with a spinning disk confocal microscope (CSU-X1, Yokogawa). We used 488 nm and 561 nm laser lines, which were modulated by acousto-optic tunable filters. Data were acquired and analyzed using Slidebook (3i) as described in Kim et al. (2012). The fluorescence signals from different region of interests (ROIs) such as soma, lobular appendages, proximal and distal dendrites were analyzed and expressed as ΔF/F, which should be indicative of the changes in calcium levels.
Drug perfusion
Drugs were bath applied in the external Ames’ medium solution, which was obtained from US Biologicals. NBQX (10 μM), CNQX (10 μM), SR95531 (3 μM), and DL-AP-5 (50 μM) were obtained from Ascent scientific (Bristol, UK). All other chemicals and salts were obtained from Sigma (St. Louis, MO). Drugs were dissolved in extracellular solution. In some cases, drugs were first dissolved in DMSO (final DMSO concentration of 0.01%, vol/vol).
Data analysis
Off-line data analysis was performed with IgorPro software (Wavemetrics, Lake Oswego, OR) and SAS 9.3 (SAS Institute Inc, Cary, NC). The increase in membrane capacitance (Cm) was measured as ΔCm = Cm(response) − Cm (baseline), where Cm(baseline) was the average Cm value during the 100 ms before the depolarizing step, and Cm(response) was the average Cm value measured during the 100 ms after the step, starting 350–400 ms after repolarization to allow time for all evoked conductances to have decayed (Palmer et al., 2003; Vigh and von Gersdorff, 2005). The decay of Cm (endocytosis) after a ΔCm jump was very slow for the first 500 ms and thus does not cause a significant under-estimate of exocytosis. All values are given as mean ± S.E.M. Significant difference was estimated by Student’s unpaired or paired t- test. Statistical significance are denoted by asterisks, * p<0.05, ** p < 0.01, ns = p>0.05. Box-and-whisker plots were generated by SAS 9.3 software.
Supplementary Material
Highlights.
Dendritic exocytosis is mediated by L-type Ca2+ channels.
Two readily releasable pools of vesicles with distinct release kinetics.
Graded light-evoked depolarization triggers graded exocytosis without ribbons.
Tighter Ca2+ channel coupling to exocytosis during postnatal development.
Acknowledgments
This work was supported by NEI-NIH grants to H.v.G. (EY014043), T.P. (EY024265) and W.R.T. (EY014888). We thank Gary Westbrook for providing the Cx36 (−/−) mice, AeSoon L. Benson for genotyping, and Owen Gross for Igor macros. We thank Owen Gross and Marc Meadows for data analysis and all our lab members for numerous discussions.
Footnotes
Author contributions
V.B., T.P., and M.-H.K. conducted the experiments; V.B., T.P., M.-H.K., W.R.T., and H.v.G. designed the experiments, performed data analysis, and wrote the paper.
Publisher's Disclaimer: This is a PDF file of an unedited manuscript that has been accepted for publication. As a service to our customers we are providing this early version of the manuscript. The manuscript will undergo copyediting, typesetting, and review of the resulting proof before it is published in its final citable form. Please note that during the production process errors may be discovered which could affect the content, and all legal disclaimers that apply to the journal pertain.
References
- Arman AC, Sampath AP. Dark-adapted response threshold of OFF ganglion cells is not set by OFF bipolar cells in mouse retina. J Neurophysiol. 2012;107:2649–2659. doi: 10.1152/jn.01202.2011. [DOI] [PMC free article] [PubMed] [Google Scholar]
- Baccus SA, Meister M. Fast and slow contrast adaptation in retinal circuitry. Neuron. 2002;36:909–919. doi: 10.1016/s0896-6273(02)01050-4. [DOI] [PubMed] [Google Scholar]
- Baden T, Berens P, Bethge M, Euler T. Spikes in mammalian bipolar cells support temporal layering of the inner retina. Current Biology. 2013;23:48–52. doi: 10.1016/j.cub.2012.11.006. [DOI] [PubMed] [Google Scholar]
- Baden T, Nikolaev A, Esposti F, Dreosti E, Odermatt B, Lagnado L. A synaptic mechanism for temporal filtering of visual signals. PLoS Biol. 2014;12:e1001972. doi: 10.1371/journal.pbio.1001972. [DOI] [PMC free article] [PubMed] [Google Scholar]
- Borghuis BG, Tian L, Xu Y, Nikonov SS, Vardi N, Zemelman BV, Looger LL. Imaging light responses of targeted neuron populations in the rodent retina. J Neurosci. 2011;31:2855–2867. doi: 10.1523/JNEUROSCI.6064-10.2011. [DOI] [PMC free article] [PubMed] [Google Scholar]
- Borowska J, Trenholm S, Awatramani GB. An intrinsic neural oscillator in the degenerating mouse retina. J Neurosci. 2011;31:5000–5012. doi: 10.1523/JNEUROSCI.5800-10.2011. [DOI] [PMC free article] [PubMed] [Google Scholar]
- Burns ME, Mendez A, Chen J, Baylor DA. Dynamics of cyclic GMP synthesis in retinal rods. Neuron. 2002;36:81–91. doi: 10.1016/s0896-6273(02)00911-x. [DOI] [PubMed] [Google Scholar]
- Cembrowski MS, Logan SM, Tian M, Jia L, Li W, Kath WL, Riecke H, Singer JH. The mechanisms of repetitive spike generation in an axonless retinal interneuron. Cell Rep. 2012;1:155–66. doi: 10.1016/j.celrep.2011.12.006. [DOI] [PMC free article] [PubMed] [Google Scholar]
- Cho S, Li G-L, von Gersdorff H. Recovery from short-term depression and facilitation is ultrafast and Ca2+ dependent at auditory hair cell synapses. J Neurosci. 2011;31:5682–5692. doi: 10.1523/JNEUROSCI.5453-10.2011. [DOI] [PMC free article] [PubMed] [Google Scholar]
- Cnops L, Hu TT, Vanden Broeck J, Burnat K, Van Den Bergh G, Arckens L. Age- and experience-dependent expression of dynamin I and synaptotagmin I in cat visual system. J Comp Neurol. 2007;504:254–64. doi: 10.1002/cne.21415. [DOI] [PubMed] [Google Scholar]
- Demb JB, Singer JH. Intrinsic properties and functional circuitry of the AII amacrine cell. Vis Neurosci. 2012;29:51–60. doi: 10.1017/S0952523811000368. [DOI] [PMC free article] [PubMed] [Google Scholar]
- Eggermann E, Bucurenciu I, Goswami SP, Jonas P. Nanodomain coupling between Ca2+ channels and sensors of exocytosis at fast mammalian synapse. Nat Rev Neurosci. 2011;13:7–21. doi: 10.1038/nrn3125. [DOI] [PMC free article] [PubMed] [Google Scholar]
- Famiglietti EV, Jr, Kolb H. A bistratified amacrine cell and synaptic circuitry in the inner plexiform layer of the retina. Brain Res. 1975;84:293–300. doi: 10.1016/0006-8993(75)90983-x. [DOI] [PubMed] [Google Scholar]
- Fedchyshyn MJ, Wang LY. Developmental transformation of the release modality at the calyx of Held synapse. J Neurosci. 2005;25:4131–4140. doi: 10.1523/JNEUROSCI.0350-05.2005. [DOI] [PMC free article] [PubMed] [Google Scholar]
- Gillis KD. Admittance-based measurement of membrane capacitance using the EPC-9 patch-clamp amplifier. Pflügers Ach. 2000;439:6555–664. doi: 10.1007/s004249900173. [DOI] [PubMed] [Google Scholar]
- Goutman JD, Glowatzki E. Time course and calcium dependence of transmitter release at a single ribbon synapse. Proc Natl Acad Sci USA. 2007;104:16341–16346. doi: 10.1073/pnas.0705756104. [DOI] [PMC free article] [PubMed] [Google Scholar]
- Güldenagel M, Ammermüller J, Feigenspan A, Teubner B, Degen J, Söhl G, Willecke K, Weiler R. Visual transmission deficits in mice with targeted disruption of the gap junction gene connexin36. J Neurosci. 2001;21:6036–6044. doi: 10.1523/JNEUROSCI.21-16-06036.2001. [DOI] [PMC free article] [PubMed] [Google Scholar]
- Habermann CJ, O’Brien BJ, Wässle H, Protti DA. AII amacrine cells express L-type calcium channels at their output synapses. J Neurosci. 2003;23:6904–6913. doi: 10.1523/JNEUROSCI.23-17-06904.2003. [DOI] [PMC free article] [PubMed] [Google Scholar]
- Hablitz JJ, Mathew SS, Pozzo-Miller L. GABA vesicles at synapses: are there two distinct pools? Neuroscientist. 2009;15:218–224. doi: 10.1177/1073858408326431. [DOI] [PMC free article] [PubMed] [Google Scholar]
- Hallermann S, Pawlu C, Jonas P, Heckmann M. A large pool of releasable vesicles in a cortical glutamatergic synapse. Proc Natl Acad Sci USA. 2003;100:8975–8980. doi: 10.1073/pnas.1432836100. [DOI] [PMC free article] [PubMed] [Google Scholar]
- Hormuzdi SG, Pais I, LeBeau FE, Towers SK, Rozov A, Buhl EH, Whittington MA, Monyer H. Impaired electrical signaling disrupts gamma frequency oscillations in connexin 36-deficient mice. Neuron. 2001;31:487–495. doi: 10.1016/s0896-6273(01)00387-7. [DOI] [PubMed] [Google Scholar]
- Hosoya T, Baccus SA, Meister M. Dynamic predictive coding by the retina. Nature. 2005;436:71–77. doi: 10.1038/nature03689. [DOI] [PubMed] [Google Scholar]
- Hsu SF, Jackson MB. Rapid exocytosis and endocytosis in nerve terminals of the rat posterior pituitary. J Physiol. 1996;494:539–553. doi: 10.1113/jphysiol.1996.sp021512. [DOI] [PMC free article] [PubMed] [Google Scholar]
- Jullié D, Choquet D, Perrais D. Recycling endosomes undergo rapid closure of a fusion pore on exocytosis in neuronal dendrites. J Neurosci. 2014;34:11106–11118. doi: 10.1523/JNEUROSCI.0799-14.2014. [DOI] [PMC free article] [PubMed] [Google Scholar]
- Kawaguchi SY, Sakaba T. Control of inhibitory synaptic outputs by low excitability of axon terminals revealed by direct recording. Neuron. 2015;85:1273–1288. doi: 10.1016/j.neuron.2015.02.013. [DOI] [PubMed] [Google Scholar]
- Kennedy MJ, Ehlers MD. Mechanisms and function of dendritic exocytosis. Neuron. 2011;69:856–875. doi: 10.1016/j.neuron.2011.02.032. [DOI] [PMC free article] [PubMed] [Google Scholar]
- Kim MH, Vickers E, von Gersdorff H. Patch-clamp capacitance measurements and Ca2+ imaging at single nerve terminals in retinal slices. J Vis Exp. 2012;59 doi: 10.3791/3345. [DOI] [PMC free article] [PubMed] [Google Scholar]
- Kim MH, Li GL, von Gersdorff H. Single Ca2+ channels and exocytosis at sensory synapses. J Physiol. 2013;591:3167–3178. doi: 10.1113/jphysiol.2012.249482. [DOI] [PMC free article] [PubMed] [Google Scholar]
- Kothmann WW, Massey SC, O’Brien J. Dopamine-stimulated dephosphorylation of connexin 36 mediates AII amacrine cell uncoupling. J Neurosci. 2009;29:14903–14911. doi: 10.1523/JNEUROSCI.3436-09.2009. [DOI] [PMC free article] [PubMed] [Google Scholar]
- Kushmerick C, Renden R, von Gersdorff H. Physiological temperatures reduce the rate of vesicle pool depletion and short-term depression via an acceleration of vesicle recruitment. J Neurosci. 2006;26:1366–1377. doi: 10.1523/JNEUROSCI.3889-05.2006. [DOI] [PMC free article] [PubMed] [Google Scholar]
- Kushmerick C, von Gersdorff H. Exo-endocytosis at mossy fiber terminals: toward capacitance measurements in cells with arbitrary geometry. Proc Natl Acad Sci. 2003;100:8618–8620. doi: 10.1073/pnas.1633427100. [DOI] [PMC free article] [PubMed] [Google Scholar]
- Liang Z, Freed MA. Cross inhibition from ON to OFF pathway improves the efficiency of contrast encoding in the mammalian retina. J Neurophysiol. 2012;108:2679–2688. doi: 10.1152/jn.00589.2012. [DOI] [PMC free article] [PubMed] [Google Scholar]
- Lindau M, Neher E. Patch-clamp techniques for time-resolved capacitance measurements in single cells. Pflügers Arch. 1988;411:137–146. doi: 10.1007/BF00582306. [DOI] [PubMed] [Google Scholar]
- MacNeil MA, Heussy JK, Dacheux RF, Raviola E, Masland RH. The shapes and numbers of amacrine cells: matching of photofilled with Golgi-stained cells in the rabbit retina and comparison with other mammalian species. J Comp Neurol. 1999;413:305–26. [PubMed] [Google Scholar]
- Marc R, Anderson JR, Jones BW, Sigulinsky CL, Lauritzen JS. The AII amacrine cell connectome: a dense network hub. Front Neural Circ. 2014;8:104. doi: 10.3389/fncir.2014.00104. [DOI] [PMC free article] [PubMed] [Google Scholar]
- Matthews G, Fuchs P. The diverse roles of ribbon synapses in sensory neurotransmission. Nat Rev Neurosci. 2010;11:812–822. doi: 10.1038/nrn2924. [DOI] [PMC free article] [PubMed] [Google Scholar]
- Mennerick S, Zenisek D, Matthews G. Static and dynamic membrane properties of large-terminal bipolar cells from goldfish retina: experimental test of a compartment model. J Neurophysiol. 78:51–62. doi: 10.1152/jn.1997.78.1.51. [DOI] [PubMed] [Google Scholar]
- Mills SL, Massey SC. Labeling and distribution of AII amacrine cells in the rabbit retina. J Comp Neurol. 1991;304:491–501. doi: 10.1002/cne.903040312. [DOI] [PubMed] [Google Scholar]
- Münch TA, Azeredo da Silveira R, Siegert S, Viney TJ, Awatramani GB, Roska B. Approach sensitivity in the retina processed by a multifunctional neural circuit. Nat Neurosci. 2009;12:1308–1316. doi: 10.1038/nn.2389. [DOI] [PubMed] [Google Scholar]
- Murphy G, Rieke F. Network variability limits stimulus-evoked spike timing precision in retinal ganglion cells. Neuron. 2006;52:511–524. doi: 10.1016/j.neuron.2006.09.014. [DOI] [PMC free article] [PubMed] [Google Scholar]
- Oltedal L, Hartveit E. Transient release kinetics of rod bipolar cells revealed by capacitance measurement of exocytosis from axon terminals in rat retinal slices. J Physiol. 2010;588:1469–1487. doi: 10.1113/jphysiol.2010.186916. [DOI] [PMC free article] [PubMed] [Google Scholar]
- Neher E, Marty A. Discrete changes of cell membrane capacitance observed under conditions of enhanced secretion in bovine adrenal chromaffin cells. Proc Natl Acad Sci U S A. 1982;79:6712–6716. doi: 10.1073/pnas.79.21.6712. [DOI] [PMC free article] [PubMed] [Google Scholar]
- Palmer MJ, Hull C, Vigh J, von Gersdorff H. Synaptic cleft acidification and modulation of short-term depression by exocytosed protons in retinal bipolar cells. J Neurosci. 2003;23:11332–11341. doi: 10.1523/JNEUROSCI.23-36-11332.2003. [DOI] [PMC free article] [PubMed] [Google Scholar]
- Pang JJ, Abd-El-Barr MM, Gao F, Bramblett DE, Paul DL, Wu SM. Relative contributions of rod and cone bipolar cell inputs to AII amacrine cell light responses in the mouse retina. J Physiol. 2007;580:397–410. doi: 10.1113/jphysiol.2006.120790. [DOI] [PMC free article] [PubMed] [Google Scholar]
- Pang JJ, Gao F, Wu SM. Physiological characterization and functional heterogeneity of narrow-field mammalian amacrine cells. J Physiol. 2012;590:223–234. doi: 10.1113/jphysiol.2011.222141. [DOI] [PMC free article] [PubMed] [Google Scholar]
- Renden R, von Gersdorff H. Synaptic vesicle endocytosis at a CNS nerve terminal: faster kinetics at physiological temperatures and increased endocytotic capacity during maturation. J Neurophysiol. 2007;98:3349–3359. doi: 10.1152/jn.00898.2007. [DOI] [PubMed] [Google Scholar]
- Sagdullaev BT, McCall MA, Lukasiewicz PD. Presynaptic inhibition modulates spillover, creating distinct dynamic response ranges of sensory output. Neuron. 2006;50:923–935. doi: 10.1016/j.neuron.2006.05.015. [DOI] [PubMed] [Google Scholar]
- Sassoè-Pognetto M, Wässle H, Grünert U. Glycinergic synapses in the rod pathway of the rat retina: cone bipolar cells express the alpha 1 subunit of the glycine receptor. J Neurosci. 1994;14:5131–5146. doi: 10.1523/JNEUROSCI.14-08-05131.1994. [DOI] [PMC free article] [PubMed] [Google Scholar]
- Schubert T, Kerschensteiner D, Eggers ED, Misgeld T, Kerschensteiner M, Lichtman JW, Lukasiewicz PD, Wong RO. Development of presynaptic inhibition onto retinal bipolar cell axon terminals is subclass-specific. J Neurophysiol. 2008;100:304–316. doi: 10.1152/jn.90202.2008. [DOI] [PMC free article] [PubMed] [Google Scholar]
- Strettoi E, Raviola E, Dacheux RF. Synaptic connections of the narrow-field, bistratified rod amacrine cell (AII) in the rabbit retina. J Comp Neurol. 1992;325:152–168. doi: 10.1002/cne.903250203. [DOI] [PubMed] [Google Scholar]
- Sun JY, Wu LG. Fast kinetics of exocytosis revealed by simultaneous measurements of presynaptic capacitance and postsynaptic currents at a central synapse. Neuron. 2001;30:171–82. doi: 10.1016/s0896-6273(01)00271-9. [DOI] [PubMed] [Google Scholar]
- Tatsuoka H, Reese TS. New structural features of synapses in the anteroventral cochlear nucleus prepared by direct freezing and freeze-substitution. J Comp Neurol. 1989;290:343–357. doi: 10.1002/cne.902900304. [DOI] [PubMed] [Google Scholar]
- Taylor WR, Smith RG. Trigger features and excitation in the retina. Curr Opin Neurobiol. 2011;21:672–678. doi: 10.1016/j.conb.2011.07.001. [DOI] [PMC free article] [PubMed] [Google Scholar]
- Thoreson WB, Rabl K, Townes-Anderson E, Heidelberger R. A highly Ca2+-sensitive pool of vesicles contributes to linearity at the rod photoreceptor ribbon synapse. Neuron. 2004;42:595–605. doi: 10.1016/s0896-6273(04)00254-5. [DOI] [PMC free article] [PubMed] [Google Scholar]
- Tsukamoto Y, Omi N. Functional allocation of synaptic contacts in microcircuits from rods via rod bipolar to AII amacrine cells in the mouse retina. J Comp Neurol. 2013;521:3541–3555. doi: 10.1002/cne.23370. [DOI] [PMC free article] [PubMed] [Google Scholar]
- Tsukamoto Y, Morigiwa K, Ueda M, Sterling P. Microcircuits for night vision in mouse retina. J Neurosci. 2001;21:8616–8623. doi: 10.1523/JNEUROSCI.21-21-08616.2001. [DOI] [PMC free article] [PubMed] [Google Scholar]
- Vaithianathan T, Matthews G. Visualizing synaptic vesicle turnover and pool refilling driven by calcium nanodomains at presynaptic active zones of ribbon synapses. Proc Natl Acad Sci USA. 2014;111:8655–8660. doi: 10.1073/pnas.1323962111. [DOI] [PMC free article] [PubMed] [Google Scholar]
- van Wyk M, Wässle H, Taylor WR. Receptive field properties of ON- and OFF-ganglion cells in the mouse retina. Visual Neurosci. 2009;26:297–308. doi: 10.1017/S0952523809990137. [DOI] [PMC free article] [PubMed] [Google Scholar]
- Vardi N, Smith RG. The AII amacrine network: coupling can increase correlated activity. Vision Res. 1996;36:3743–3757. doi: 10.1016/0042-6989(96)00098-3. [DOI] [PubMed] [Google Scholar]
- Veruki ML, Oltedal L, Hartveit E. Electrical synapses between AII amacrine cells: dynamic range and functional consequences of variation in junctional conductance. J Neurophysiol. 2008;100:3305–3322. doi: 10.1152/jn.90957.2008. [DOI] [PubMed] [Google Scholar]
- Veruki ML, Hartveit E. Meclofenamic acid blocks electrical synapses of retinal AII amacrine and on-cone bipolar cells. J Neurophysiol. 2009;101:2339–2347. doi: 10.1152/jn.00112.2009. [DOI] [PubMed] [Google Scholar]
- Vickers E, Kim MH, Vigh J, von Gersdorff H. Paired-pulse plasticity in the strength and latency of light-evoked lateral inhibition to retinal bipolar cell terminals. J Neurosci. 2012;32:11688–11699. doi: 10.1523/JNEUROSCI.0547-12.2012. [DOI] [PMC free article] [PubMed] [Google Scholar]
- Vigh J, Lasater EM. L-type calcium channels mediate transmitter release in isolated, wide-field retinal amacrine cells. Vis Neurosci. 2004;21:129–139. doi: 10.1017/s095252380404204x. [DOI] [PubMed] [Google Scholar]
- Vigh J, von Gersdorff H. Prolonged reciprocal signaling via NMDA and GABA receptors at a retinal ribbon synapse. J Neurosci. 2005;25:11412–11423. doi: 10.1523/JNEUROSCI.2203-05.2005. [DOI] [PMC free article] [PubMed] [Google Scholar]
- von Gersdorff H, Matthews G. Dynamics of synaptic vesicle fusion and membrane retrieval in synaptic terminals. Nature. 1994;367:735–739. doi: 10.1038/367735a0. [DOI] [PubMed] [Google Scholar]
- Wässle H. Parallel processing in the mammalian retina. Nat Rev Neurosci. 2004;5:747–757. doi: 10.1038/nrn1497. [DOI] [PubMed] [Google Scholar]
- Wässle H, Heinze L, Ivanova E, Majumdar S, Weiss J, Harvey RJ, Haverkamp S. Glycinergic transmission in the mammalian retina. Front Mol Neurosci. 2009;2:6. doi: 10.3389/neuro.02.006.2009. [DOI] [PMC free article] [PubMed] [Google Scholar]
- Werblin FS. The retinal hypercircuit: a repeating synaptic interactive motif underlying visual function. J Physiol. 2011;589:3691–3702. doi: 10.1113/jphysiol.2011.210617. [DOI] [PMC free article] [PubMed] [Google Scholar]
- Wu C, Ivanova E, Cui J, Lu Q, Pan ZH. Action potential generation at an axon initial segment-like process in the axonless retinal AII-amacrine cell. J Neurosci. 2011;31:14654–14659. doi: 10.1523/JNEUROSCI.1861-11.2011. [DOI] [PMC free article] [PubMed] [Google Scholar]
- Xin D, Bloomfield SA. Comparison of the responses of AII amacrine cells in the dark- and light-adapted rabbit retina. Vis Neurosci. 1999;16:653–665. doi: 10.1017/s0952523899164058. [DOI] [PubMed] [Google Scholar]
- Xu-Friedman MA, Regehr WG. Structural contributions to short-term synaptic plasticity. Physiol Rev. 2004;84:69–85. doi: 10.1152/physrev.00016.2003. [DOI] [PubMed] [Google Scholar]
Associated Data
This section collects any data citations, data availability statements, or supplementary materials included in this article.