Abstract
Differences in the quality of B-cell antigen receptor (BCR) signaling control key steps of B cell maturation and differentiation. Endogenously produced H2O2 is thought to fine tune the level of BCR signaling by reversibly inhibiting phosphatases. However, relatively little is known about how B cells at different stages sense and respond to such redox cues. Here, we used phospho-specific flow cytometry and high-dimensional mass cytometry (CyTOF) to compare BCR signaling responses in mature human tonsillar B cells undergoing germinal center (GC) reactions. GC B cells, in contrast to mature naïve B cells, memory B cells, and plasmablasts, were hypersensitive to a range of H2O2 concentrations and responded by phosphorylating SYK and other membrane proximal BCR effectors in the absence of BCR engagement. These findings reveal that stage specific redox responses distinguish human GC B cells.
INTRODUCTION
The interplay between kinase activity and phosphatase regulation is thought to determine the fate of mature B cells undergoing the germinal center (GC) reaction. In addition to B-cell antigen receptor (BCR) signaling, secondary messengers control the signaling context and help determine functional outcomes in B cells. H2O2 is the primary reactive oxygen species (ROS) produced by B cells. H2O2 amplifies BCR signaling by transiently inhibiting BCR-associated protein tyrosine phosphatases (PTPs) (1). H2O2 is also produced as part of innate immune responses to wounds and infection (2). However, it is not known what impact H2O2 has on healthy human B-cell signaling responses and whether B cells undergoing GC reactions respond differently to H2O2.
Seconds after BCR crosslinking, a network of signaling molecules becomes activated through post-translational modifications. As signaling directs B cells down differentiation pathways, B cells adopt well characterized signatures defined primarily by protein expression (3). Naïve B cells in humans are defined by expression of CD19, CD20, and IgD. GC B cells are defined as CD19+, CD20hi, CD38+, IgD− B cells. Memory B cells, on the other hand, express CD19, CD20, and CD27. Furthermore, human plasmablasts are defined as CD38hi, CD20lo cells that are in the process of down regulating surface BCR and most other surface antigens.
The GC is a highly active environment vital for proper functioning of the adaptive immune system. GC B cells undergo affinity maturation, which involves iterative cycles of clonal expansion, somatic hypermutation, and selection that result in class-switched memory B cells and antibody-secreting plasma cells (4, 5). How high-affinity B cells are selected in the GC is not entirely clear. Increased antigen capture and presentation leads to increased rates of cell division (5, 6). It is also possible that actively proliferating GC B cells produce unique signals that promote their survival and proliferation. In addition, GC B cell signaling is regulated by PTPs (7, 8). For example, cell surface CD22 can recruit phosphatases, such as SHP-1, to attenuate BCR signaling (8, 9). Opposing this activity are NADPH oxidases (NOXs), such as DUOX1, which produce H2O2 and lower BCR signaling thresholds by reversibly inhibiting phosphatases (2). The environment surrounding the BCR simulates NOX, which produces endogenous ROS (10). In turn, ROS oxidize the extracellular compartment and activate the BCR signaling pathway, creating a positive feedback loop. BCR signaling governs B-cell functions, and activation and termination of BCR signaling is finely tuned by multiple levels of regulation in healthy cells.
While the biochemistry of BCR signaling is well-understood in model systems, little is known about the quality of in vivo BCR signaling in mature, healthy human B cells. Addressing this gap by mapping the influence of ROS on healthy B-cell signaling is important for placing into context the extreme BCR signaling and H2O2 responses observed in B-cell diseases and disorders (11). Here, we used high-dimensional mass cytometry, phospho-specific flow cytometry, and novel computational data analysis tools (12-14) to better understand how ROS regulate BCR signaling within subsets of primary human tonsillar B cells.
MATERIALS & METHODS
HUMAN SAMPLES
Tonsils were obtained from children undergoing routine tonsillectomies in accordance with the Declaration of Helsinki following protocols approved by Vanderbilt University Medical Center (VUMC) Institutional Review Board. Single cell suspensions were prepared and stored in liquid nitrogen.
ANTIBODIES
Fluorescent antibodies for CD20, IgD, CD38, CD3, CD27, p-SRC, p-SYK, p-PLCγ, and p-NFκB were conjugated to BV421, PerCP Cy5.5, FITC, PE-Cy7, BUV395, BV570, BV605, PE, and AlexaFluor647 (BD Biosciences, Invitrogen, or Biolegend). Mass cytometry antibodies are listed in Supplemental Information (Supplemental Table 1).
FLUORESCENT CYTOMETRY
Aliquots of cryopreserved single cell tonsillar samples were thawed into 10 mL of warm media (RPMI 1640 (Mediatech, Inc., Manassas, VA) + 10% FBS (Gibco®, life technologies, Grand Island, NY)), pelleted by centrifugation at 200 × g, washed with warm media and pelleted again at 200 × g before re-suspension in flow cytometry tubes. Re-suspended samples rested for 15 minutes in a 5% CO2 incubator at 37 °C. Each rested sample was either left unstimulated or stimulated with H2O2 (Fisher Scientific, Fair Lawn, NJ) for 2 minutes or CD40L plus enhancer (Enzo Life Sciences, Inc., Farmingdale, NY) for 15 minutes. CD40L and enhancer were prepared per manufacturer’s recommendation. Cells were fixed with 1.6% paraformaldehyde (PFA, Electron Microscopy Services, Fort Washington, PA) for 5 minutes at room temperature (RT) following stimulation, washed with PBS (HyClone Laboratories, Logan, UT), pelleted at 800 × g, and permeabilized by 100% ice cold methanol (MeOH) (Fisher Scientific) in a −20 °C freezer overnight. Cells were washed once with PBS and once with cell staining media (CSM) composed of PBS + 1% bovine serum albumin (BSA, Fisher Scientific). For each condition, 1 × 10⁶ tonsillar cells were stained in 100 μL of CSM. Samples were analyzed using a five-laser BD LSRII (Becton Dickinson, Franklin Lakes, New Jersey) at the Vanderbilt Flow Cytometry Shared Resource (VFCSR) and evaluated using Cytobank software.
MASS CYTOMETRY
Single cell tonsillar samples were thawed the same way as samples prepared for fluorescent cytometry. For mass cytometry panel 1 one tonsil sample was left unstimulated and one sample was stimulated with H2O2 (Fisher Scientific) for 2 minutes. Cells were fixed (PFA) and stained for extracellular targets (Supplemental Table 1). After MeOH permeabilization, cells were stained for IgG, IgM, IgA, and p-PLCγ-PE in CSM for 15 minutes at RT, then stained with 250 nM iridium intercalator and anti-PE (Fluidigm) for 30 minutes at RT. Cells were washed once in PBS, once in ddH2O, suspended in ddH2O and collected on a CyTOF 1.0 at the VFCSR. Cells stained with panel 2 (Supplemental Table 1) were stained immediately after thawing, except for SHP-1, which was stained after permeabilization. Mass cytometry data files were evaluated using manual gating and viSNE (12) in Cytobank. Data were transformed using an arcsinh scale (cofactors of 15, except for SHP-1, which had a cofactor of 5). viSNE maps were generated using the following markers: SHP-1, CD40, IgD, CD3, CD3, CD19, CD20, CD86, CD22, CD44, CD38, CD27, CD79B, HLA-DR.
RESULTS AND DISCUSSION
A subset of B cells responded robustly to H2O2 stimulation
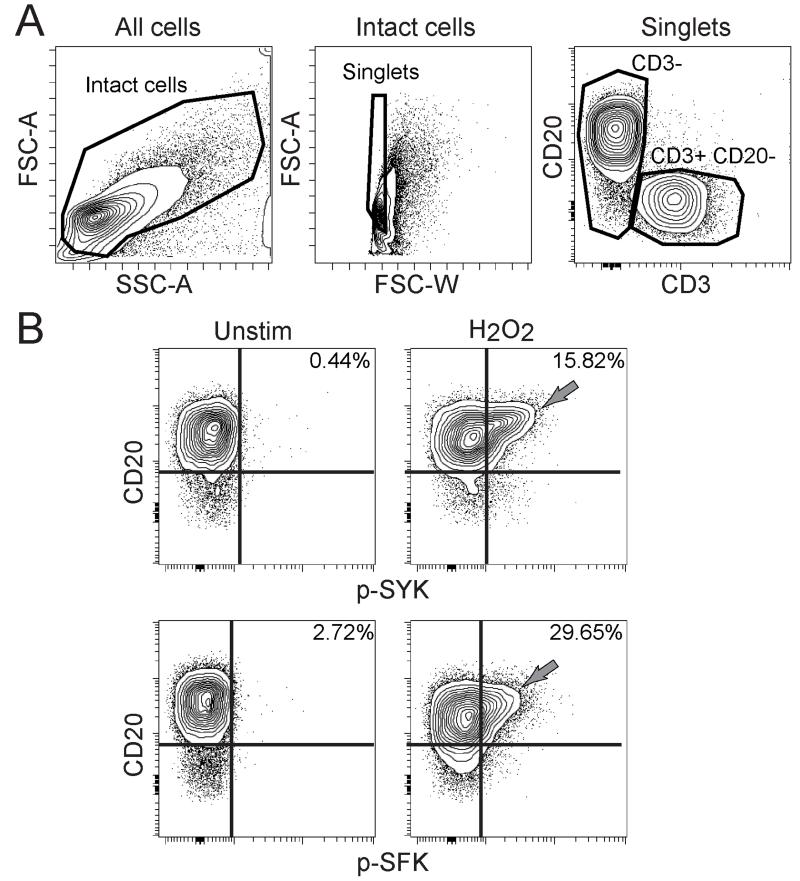
A subset of human tonsillar B cells was initially observed to respond to a 2 minute stimulation by 3.3 mM H2O2 by phosphorylating upstream members of the BCR signaling pathway, including SYK and Src family kinases (SFKs). This H2O2-sensitive population varied in abundance from 7.3% to 33.24% of CD3− cells (Supplementary Fig. 1) and generally expressed higher levels of CD20 compared to other tonsillar B cells (Fig. 1). In previous reports, naïve B cells in peripheral blood did not respond to 3.3 mM H2O2 (15). The H2O2 response of the CD20hi CD3− B cells distinguished these cells from other tonsillar cells and contrasted with the B cell response to other stimuli, such as CD40L, which showed no significant signaling differences across the full range of CD20 expression levels (Supplementary Fig. 1). Thus, a novel H2O2 signaling response distinguished a CD20hi subset of tonsillar B cells.
Figure 1. CD20hi B cells in human tonsil were sensitive to H2O2.
(A) Contour plots show gating for CD3− cells and CD3+ CD20− T cells in human tonsil. (B) Contour plots show phosphorylated SYK (p-SYK) and p-SFK in CD3− tonsillar B cells left unstimulated or stimulated by 3.3 mM H2O2 for 2 minutes. Sensitivity to H2O2 in a CD20hi B cell population is indicated (gray arrows). Plots are representative of three tonsils.
Comprehensive characterization of H2O2–responsive B cells by mass cytometry
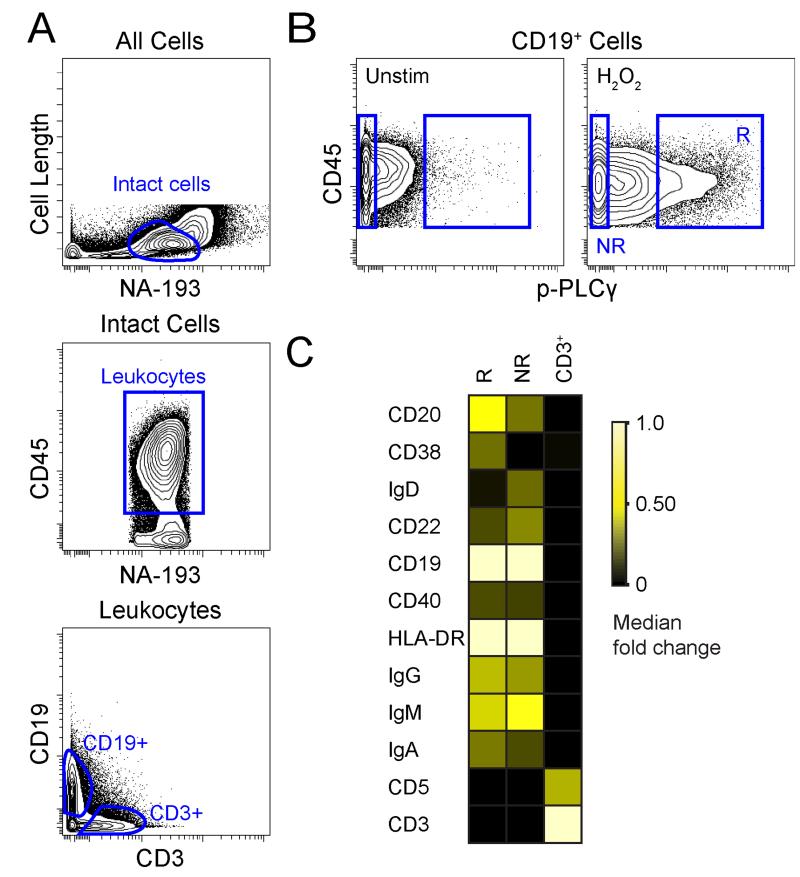
To determine the identity of the H2O2-responsive cells, a high-dimensional mass cytometry panel designed to characterize mature B cells was developed (Supplemental Table 1). The H2O2-sensitive cell population was gated and labeled as “responder” cells (R) and the signature of protein expression was contrasted with cells labeled as “non-responders” (NR) or CD3+ T cells (Fig. 2A, B). The H2O2-sensitive responder cells were characterized by a CD20hi, CD38+, IgD− phenotype that contrasted with the other evaluated populations of non-responder cells and CD3+ cells (Fig. 2C). This observed responder cell phenotype suggested a GC B cell identity (3, 16). In agreement with this, a strong relation was seen between the fraction of H2O2-sensitive responding cells and the abundance of GC B cells in each tonsil (Supplementary Fig. 1).
Figure 2. Mass Cytometry Revealed H2O2 ‘Responder’ Population as CD20hi, CD38+, and IgD−.
(A) Contour plots show gating for CD19+ B cells and CD3+ T cells in human tonsil. (B) Contour plots show p-PLCγ in CD19+ tonsil B cells left unstimulated or stimulated by 3.3 mM H2O2 for 4 minutes. Cells that were sensitive to H2O2 stimulation were labeled responder (R) cells and contrasted with non-responder cells (NR). (C) Heat map shows the median fold change CD20 and CD38 in CD3+ T cells, R, and NR subsets.
Germinal center B cells were hypersensitive to H2O2 stimulation
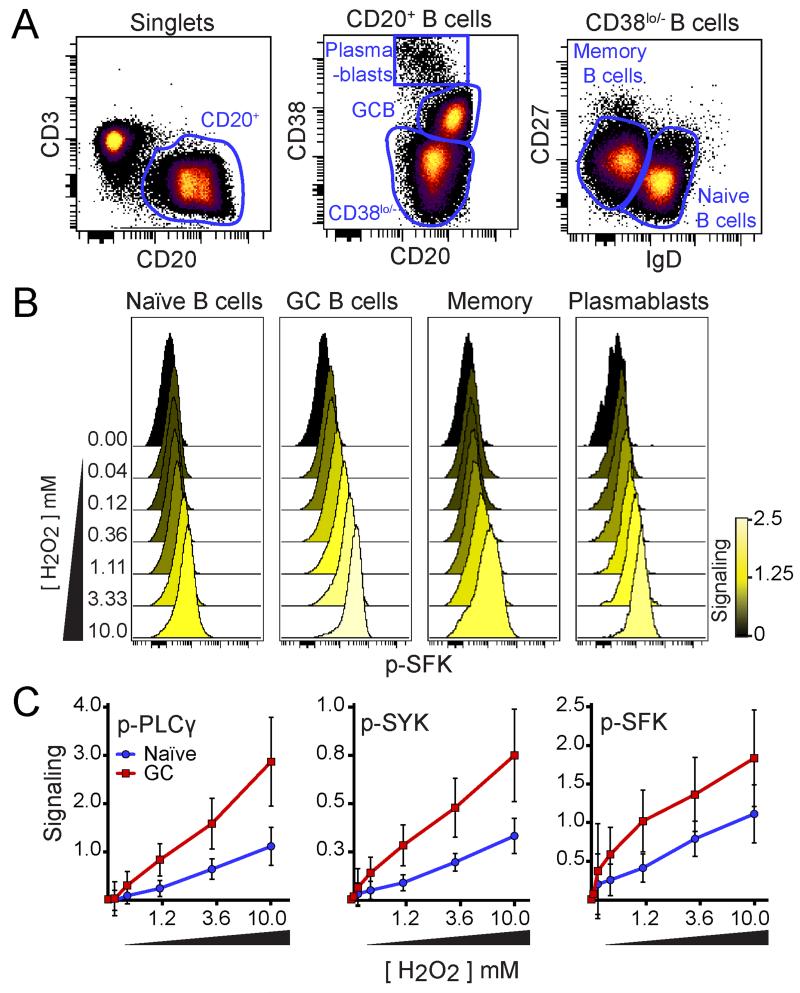
BCR signaling normally triggers a complex, interconnected network of effector signaling pathways (15), and it is currently not known how the quality, magnitude, and duration of BCR signaling ‘programs’ a B cell for contrasting functional outcomes ranging from cell death to proliferation. Phospho-proteins in the BCR signaling network that are rapidly phosphorylated following H2O2 stimulation might act as effectors of secondary messenger signaling. To identify H2O2 signaling effectors and better delineate the H2O2 sensitivity of B cell populations, a fluorescent panel was developed and cells from three human tonsils were stimulated with varying doses of H2O2 for 2 minutes (Fig. 3). Naïve, GC, memory, and plasmablast B cell subsets were distinguished using canonical markers CD3, CD20, CD38, CD27, and IgD (Fig. 3A). Observed B cell subsets responded to H2O2 in a dose dependent manner seen through the phosphorylation of SFK, PLCγ, and SYK; however, GC B cells were the most sensitive to H2O2 at all concentrations (Fig. 3B,C).
Figure 3. GC B cells were hypersensitive to H2O2.
(A) Density dot plots show gating for identification of plasmablasts, GC B cells, memory B cells, and naïve B cells in human tonsils. (B) Histogram overlays show p-SFK in each B cell population (shown in A) following 2 minutes of 3.3 mM of H2O2 (n=3, representative data shown). Color denotes median fold change in p-SFK expression compared to unstimulated (0 mM of H2O2). (C) Plots illustrate the median fold change in p-PLCγ, p-SYK, and p-SRC in H2O2-stimulated conditions compared to the unstimulated condition (arcsinh scale). Each point represents the average of three individual tonsil specimens (n=3) stimulated for 2 minutes with the indicated concentration of H2O2, except for the 0.04 mM and 0.12 mM H2O2 stimulated conditions (where n=2). Red squares represent GC B cells and blue circles represent naïve B cells. Error bars denote the standard deviation for each point.
H2O2 sensitivity may be an intrinsic characteristic of GC B cells that is necessary for BCR regulation within an active GC. GC B cells may use endogenously produced H2O2 as a modulator of BCR signaling, while B-cell receptors undergo iterative modification. In fact, loss of BCR signaling in healthy B cells reduces B-cell survival and sustained BCR signaling capability is essential for B-cell development and survival (17). Observed H2O2 hypersensitivity of GC B cells (Fig. 3) may be an important feature of accelerating the GC reaction; alternatively, this redox sensitivity may help to cull B cells that do not appropriately execute the delicate process of somatic hypermutation. These results help to place in context the observation that lymphoma B cells are especially sensitive to ROS (18). Prior studies revealed that lymphoma B cells undergo rapid, ROS-mediated apoptosis when glutathione is depleted and that stimulation of lymphoma B cells using α-BCR F(ab’)2 and H2O2 negates suppression of BCR signaling that distinguishes clinically relevant lymphoma negative prognostic (LNP) cells in follicular lymphoma (19).
Heterogeneous SHP-1 expression across B cell populations
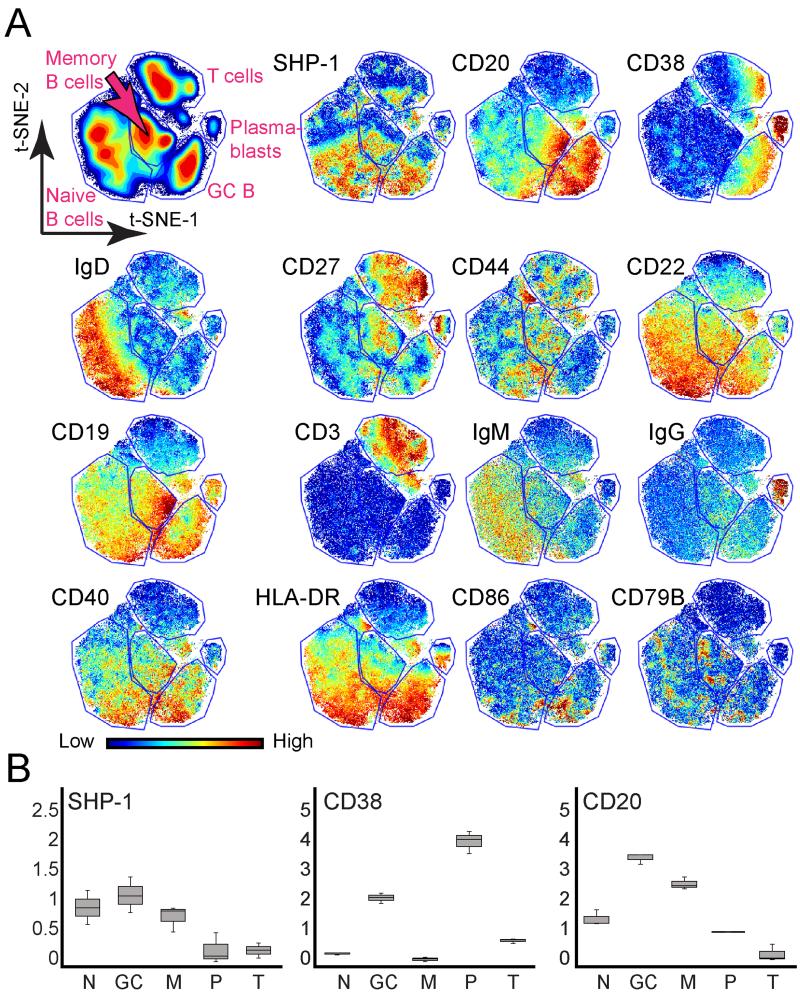
Previous data from GCs generated within transgenic mice reported that GC B cells do not robustly respond to antigen or anti-IgM stimulation compared to non-GC B cells due to co-localization of SHP-1 with the BCR (8). To study this relationship in humans, a single cell approach was used to measure total SHP-1 levels within human tonsillar B cell subsets and quantify any correlation between total SHP-1 protein expression and B cell population identity. Furthermore, an unsupervised computational approach was used to characterize GC B cells and determine whether additional heterogeneity might exist within this or other B cell populations (12, 13). Elevated phosphatase levels of GC B cells compared to other B cell subsets might explain why GC B cells were hypersensitive to H2O2 stimulation. To evaluate this hypothesis, an antibody for SHP-1 was added to the mass cytometry panels (Supplemental Table 1). B cell subsets were identified by viSNE analysis using the same key markers as in fluorescent experiments (Fig. 4). viSNE revealed heterogeneous expression of SHP-1 within naïve, GC, and memory B cell populations. Each of these B cell populations contained both high and low SHP-1 expressing cells. In contrast, plasmablasts expressed a consistent, low level of SHP-1. SHP-1 expression contrasted strongly with canonical subset marker expression patterns, which were enriched in subset specific ways, such as CD20 and CD38 (Fig. 4B). SHP-1 expression was uncorrelated with H2O2 sensitivity across the B cell stages studied here. Plasmablasts and naïve B cells expressed contrasting levels of SHP-1 and had comparable H2O2 sensitivity, whereas GC and naïve B cells had contrasting H2O2 sensitivity despite similar median levels and per-cell distributions of SHP-1 expression (Fig. 3 and 4).
Figure 4. SHP-1 expression was heterogeneous within B cell populations.
viSNE maps show CD45+ leukocytes arranged based on marker expression profiles (see gating in Fig. 2A). Color denotes protein expression, as indicated. (A) Gates were drawn around the main populations identified by viSNE, using protein expression to identify each population. CD19+ B cells were subdivided into naïve B cells (CD38−CD27−IgD+), GC B cells (CD20hiCD38+), memory B cells (CD38−CD27+IgD−), and plasmablasts (CD20−CD38hi) and compared to CD3+ T cells. One representative tonsil of four analyzed is shown. (B) Box and Whisker plots illustrate expression of SHP-1, CD38, and CD20 proteins across three tonsil specimens for naïve B cells, GC=germinal center B cells, M=memory B cells, P=plasmablasts, and T= T cells. Median of each marker is indicated by a black line. Bars denote the minimum and maximum observed MFI of each marker.
Since SHP-1 expression did not correlate with B cell subset, it is possible that the observed heterogeneity of SHP-1 expression is due to transient differences within B-cell subsets that are not reflective of stage, but rather recent stimulation experience. A recent study demonstrated that a subpopulation of light zone GC B cells had more robust BCR signaling compared to all GC B cells (20). Our study was not powered to look at light zone/dark zone differences, but the data suggested that light zone GC B cells may be the GC B cells that are higher for SHP-1. Within the GC B cell subset, the cells on the viSNE map that expressed higher levels of SHP-1 also expressed higher levels of CD40, HLA-DR, CD22, and CD86 (Fig. 4A). These proteins relate to T cell signaling interactions and suggest a shift in the signaling relationship between T follicular helper (TFH) cells and GC B cells.
These results provide new information regarding redox-sensitive signaling in B cell networks that may act to control the outcomes of GC reactions. Precisely how ROS regulate BCR signaling within GCs remains to be seen; however, the findings here indicate that redox cues specifically impact human GC B cell signaling. These results revealed unknown human GC B cell signaling responses to ROS that can be used as a reference point for studies of diseases originating in cells with GC characteristics, such as B-cell lymphomas.
Supplementary Material
Acknowledgments
This work was supported by National Institutes of Health (National Institute of Cancer) Grants R00CA143231, R25CA13644, and P30CA068485 and the Norwegian Cancer Society Kreftforeningen.
REFERENCES
- 1.Reth M. Hydrogen Peroxide as a second messenger in lymphocyte activation. Nat Immunol. 2002:3. doi: 10.1038/ni1202-1129. [DOI] [PubMed] [Google Scholar]
- 2.Nathan C, Cunningham-Bussel A. Beyond oxidative stress: an immunologist’s guide to reactive oxygen species. Nature Reviews Immunology. 2013;13:349–361. doi: 10.1038/nri3423. [DOI] [PMC free article] [PubMed] [Google Scholar]
- 3.Maecker HT, McCoy JP, Nussenblatt R. Standardizing immunophenotyping for the Human Immunology Project. Nat Rev Immunol. 2012;12:191–200. doi: 10.1038/nri3158. [DOI] [PMC free article] [PubMed] [Google Scholar]
- 4.Victora GD, Schwickert TA, Fooksman DR, Kamphorst AO, Meyer-Hermann M, Dustin ML, Nussenzweig MC. Germinal center dynamics revealed by multiphoton microscopy with a photoactivatable fluorescent reporter. Cell. 2010;143:592–605. doi: 10.1016/j.cell.2010.10.032. [DOI] [PMC free article] [PubMed] [Google Scholar]
- 5.Gitlin AD, Shulman Z, Nussenzweig MC. Clonal selection in the germinal centre by regulated proliferation and hypermutation. Nature. 2014;509:637–640. doi: 10.1038/nature13300. [DOI] [PMC free article] [PubMed] [Google Scholar]
- 6.Shulman Z, Gitlin AD, Weinstein JS, Lainez B, Esplugues E, Flavell RA, Craft JE, Nussenzweig MC. Dynamic signaling by T follicular helper cells during germinal center B cell selection. Science. 2014;345:1058–1062. doi: 10.1126/science.1257861. [DOI] [PMC free article] [PubMed] [Google Scholar]
- 7.Klein U, Tu Y, Stolovitzky GA, Keller JL, Haddad J, Miljkovic V, Cattoretti G, Califano A, Dalla-Favera R. Transcriptional analysis of the B cell germinal center reaction. Proceedings of the National Academy of Sciences. 2003;100:2639–2644. doi: 10.1073/pnas.0437996100. [DOI] [PMC free article] [PubMed] [Google Scholar]
- 8.Khalil AM, Cambier JC, Shlomchik MJ. B cell receptor signal transduction in the GC is short-circuited by high phosphatase activity. Science. 2012;336:1178–1181. doi: 10.1126/science.1213368. [DOI] [PMC free article] [PubMed] [Google Scholar]
- 9.Singh DK, Kumar D, Siddiqui Z, Basu SK, Kumar V, Rao KVS. The Strength of Receptor Signaling Is Centrally Controlled through a Cooperative Loop between Ca2+ and an Oxidant Signal. Cell. 2005;121:281–293. doi: 10.1016/j.cell.2005.02.036. [DOI] [PubMed] [Google Scholar]
- 10.Woo HA, Yim SH, Shin DH, Kang D, Yu DY, Rhee SG. Inactivation of peroxiredoxin I by phosphorylation allows localized H(2)O(2) accumulation for cell signaling. Cell. 2010;140:517–528. doi: 10.1016/j.cell.2010.01.009. [DOI] [PubMed] [Google Scholar]
- 11.Irish JM, Myklebust JH, Alizadeh AA, Houot R, Sharman JP, Czerwinski DK, Nolan GP, Levy R. B-cell signaling networks reveal a negative prognostic human lymphoma cell subset that emerges during tumor progression. Proceedings of the National Academy of Sciences of the United States of America. 2010;107:12747–12754. doi: 10.1073/pnas.1002057107. [DOI] [PMC free article] [PubMed] [Google Scholar]
- 12.Amir E.-a. D., Davis KL, Tadmor MD, Simonds EF, Levine JH, Bendall SC, Shenfeld DK, Krishnaswamy S, Nolan GP, Pe’er D. viSNE enables visualization of high dimensional single-cell data and reveals phenotypic heterogeneity of leukemia. Nat Biotech. 2013;31:545–552. doi: 10.1038/nbt.2594. [DOI] [PMC free article] [PubMed] [Google Scholar]
- 13.Becher B, Schlitzer A, Chen J, Mair F, Sumatoh HR, Teng KWW, Low D, Ruedl C, Riccardi-Castagnoli P, Poidinger M, Greter M, Ginhoux F, Newell EW. High-dimensional analysis of the murine myeloid cell system. Nat Immunol. 2014;15:1181–1189. doi: 10.1038/ni.3006. [DOI] [PubMed] [Google Scholar]
- 14.Bendall, Sean C, Davis Kara L., Amir E.-ad D., Tadmor Michelle D., Simonds Erin F., Chen Tiffany J., Shenfeld Daniel K., Nolan Garry P., Pe’er D. Single-Cell Trajectory Detection Uncovers Progression and Regulatory Coordination in Human B Cell Development. Cell. 2014;157:714–725. doi: 10.1016/j.cell.2014.04.005. [DOI] [PMC free article] [PubMed] [Google Scholar]
- 15.Irish JM, Czerwinski DK, Nolan GP, Levy R. Kinetics of B cell receptor signaling in human B cell subsets mapped by phosphospecific flow cytometry. Journal of immunology. 2006;177:1581–1589. doi: 10.4049/jimmunol.177.3.1581. [DOI] [PubMed] [Google Scholar]
- 16.Jackson SM, Wilson PC, James JA, Capra JD. Human B cell subsets. Adv Immunol. 2008;98:151–224. doi: 10.1016/S0065-2776(08)00405-7. [DOI] [PubMed] [Google Scholar]
- 17.Kraus M, Alimzhanov MB, Rajewsky N, Rajewsky K. Survival of Resting Mature B Lymphocytes Depends on BCR Signaling via the Igα/β Heterodimer. Cell. 2004;117:787–800. doi: 10.1016/j.cell.2004.05.014. [DOI] [PubMed] [Google Scholar]
- 18.Irish JM, Czerwinski DK, Nolan GP, Levy R. Altered B-cell receptor signaling kinetics distinguish human follicular lymphoma B cells from tumor-infiltrating nonmalignant B cells. Blood. 2006;108:3135–3142. doi: 10.1182/blood-2006-02-003921. [DOI] [PMC free article] [PubMed] [Google Scholar]
- 19.Irish JM, Myklebust JH, Alizadeh AA, Houot R, Sharman JP, Czerwinski DK, Nolan GP, Levy R. B-cell signaling networks reveal a negative prognostic human lymphoma cell subset that emerges during tumor progression. Proceedings of the National Academy of Sciences of the United States of America. 2010;107:12747–12754. doi: 10.1073/pnas.1002057107. [DOI] [PMC free article] [PubMed] [Google Scholar]
- 20.Mueller J, Matloubian M, Zikherman J. Cutting edge: an in vivo reporter reveals active B cell receptor signaling in the germinal center. Journal of immunology. 2015;194:2993–2997. doi: 10.4049/jimmunol.1403086. [DOI] [PMC free article] [PubMed] [Google Scholar]
Associated Data
This section collects any data citations, data availability statements, or supplementary materials included in this article.


