Abstract
Purpose
To investigate the effects of androgen-deprivation therapy (ADT) on MRI parameters and evaluate their associations with measures of treatment response.
Materials and Methods
This study included 30 men with histopathologically-confirmed prostate cancer who underwent MRI before and after start of ADT. Thirty-four tumours were volumetrically assessed on DW-MRI (n=32) and DCE-MRI (n=18), along with regions of interest in benign prostatic tissue, to calculate apparent diffusion coefficient (ADC) and transfer constant (Ktrans) values. Changes in MRI parameters and correlations with clinical parameters (change in prostate-specific antigen [PSA], treatment duration, PSA nadir) were assessed.
Results
Prostate volume and PSA values decreased significantly through therapy (p<0.001). ADC values increased significantly in tumour and decreased in benign prostatic tissue (p<0.05). Relative changes in ADC and absolute post-therapeutic ADC values differed significantly between tumour and benign tissue (p<0.001). Ktrans decreased significantly only in tumour (p<0.001); relative Ktrans changes and post-therapeutic values did not differ significantly between tumour and benign tissue. The relative change in tumour ADC correlated significantly with the PSA decrease. No changes were associated with treatment duration or PSA nadir.
Conclusion
Multi-parametric MRI shows significant, measurable changes in tumour and benign prostate caused by ADT and may help in monitoring treatment response.
Keywords: Prostate Cancer, Diffusion MRI, Dynamic contrast-enhanced MRI, Androgen-deprivation therapy, Treatment response
Introduction
In 2014, prostate cancer was expected to be the most common malignancy among men in the United States, for whom the lifetime risk of being diagnosed with the disease is approximately 15.3% [1]. In patients with advanced or metastatic disease, androgen-deprivation therapy (ADT) has been shown to be of value for control of both local and distant castration-sensitive tumours [2, 3]. Androgen-deprivation therapy (ADT) is also known to cause significant changes in the appearance of the prostate on MRI, including a diffuse decrease in signal intensity on T2-weighted images that can lead to overestimation of tumour presence after therapy and hinder the assessment of treatment response [4, 5].
Multi-parametric MRI has shown great promise in tumour detection [6, 7], assessment of tumour aggressiveness [8, 9] and detection of local recurrence after surgery or radiation therapy [10]. However, few studies have investigated the effects of ADT on parameters from diffusion-weighted or dynamic contrast-enhanced MRI. As these techniques go beyond the depiction of anatomy and aim to assess tumour characteristics such as increased cellularity and the presence of tumour-induced neo-vascularization, we hypothesized that they would allow for treatment monitoring in patients undergoing ADT if they proved to be associated with established clinical response markers, such as the decrease in serum levels of prostate-specific antigen (PSA) or PSA nadirs, which have been shown to influence outcome [11–14].
Therefore, the purpose of this study was to investigate the effects of ADT on prostate volume, diffusion-weighted (DW) and dynamic contrast-enhanced (DCE) MRI parameters and evaluate their associations with established measures of treatment response.
Materials and Methods
Patients
This study was IRB-approved and HIPAA-compliant. The institutional review board waived the requirement for informed consent. We performed a retrospective search of radiation-oncology databases for the years 2009 to 2012 for patients fulfilling the following criteria: (1) histopathologically-confirmed (trans-rectal ultrasound guided biopsy, TRUS) prostate cancer treated with ADT, (2) pre-therapeutic MRI examination featuring a diffusion-weighted imaging (DWI) and/or a dynamic contrast-enhanced (DCE) MRI sequence, and (3) follow-up MRI examination after start of therapy but before start of radiotherapy (or any other therapy). This search identified 32 patients. Of those, one patient was excluded from analysis due to imaging artefacts and another patient was excluded because of extensive post-biopsy changes and haemorrhage.
The baseline MRI was performed with a median of 0.7 months before the start of ADT (range: 0.03–9.5 months) and the median time between the two MRI examinations was 4.0 months (range: 2.2–13.9 months). Median duration of ADT at time of second MRI was 98 days (range: 42–197 days).
Clinical data (PSA values; clinical stage; start, end and type of ADT) were collected from the hospital’s electronic medical records system. For PSA values, the measurements obtained closest to the dates of MRI examinations were selected (pre-ADT: median 1 day after 1st MRI, range: -52–202 days; after start of ADT: median 8 days after 2nd MRI, range: -4–52 days). In addition, the lowest PSA value (nadir) during therapy and the lowest PSA value (nadir) during the complete patient follow-up were collected. PSA nadirs were reached after a median of 145 (range: 29–327) days while the patient was still under therapy and after a median of 233 (range: 80–923) days when including the complete patient follow-up.
Androgen-deprivation therapy consisted of standard treatment with an androgen receptor antagonist and/or a gonadotropin-releasing hormone analogue to achieve castrate levels of serum testosterone. After the second MRI, 9 of the 30 patients were treated with intensity-modulated radiation therapy (IMRT) to a dose level of either 81 Gy (n=2) or 86.4 Gy (n=7). The remaining 21 patients were treated with brachytherapy as either monotherapy with I-125 implantation alone of 144 Gy (n=9) or permanent seed implantation (100 Gy I-125) combined with IMRT at 50.4 Gy (n=12).
MRI examinations and image analysis
The final patient cohort consisted of 30 patients. In these, 34 index lesions were identified in 27 patients. No tumour could be delineated in the remaining 3 patients, so that only measurements in benign prostatic tissue were included into analysis. Thirty-two lesions in 25 patients were identified on diffusion-weighted imaging (DWI was not available for one patient, while tumour delineation was not possible on the ADC maps of another one due to imaging artefacts); 18 lesions in 12 patients were identified on DCE-MRI (high-temporal resolution DCE was not available in 17 patients and one patient was excluded from analysis due to belated start of contrast agent injection). In one patient, diffuse tumour infiltration did not allow for the evaluation of normal prostatic tissue and prohibited measurements in the transition zone in another.
All MRI examinations were performed on MRI units manufactured by GE Healthcare (Waukesha, WI, USA) at a field strength of 3 Tesla (n=19) or 1.5 Tesla (n=11) at both baseline and follow-up examination and featured the use of a pelvic phased-array coil with four channels and an endorectal coil. Of the 30 patients included in this retrospective analysis, twelve patients had pre- and post-therapeutic examinations at differing field strengths. The MRI protocol included T2-weighted sequences in axial, coronal and sagittal orientations as well as a diffusion-weighted sequence (TR=2000–9000, TE=69.2-116.5, matrix: 96-192×96-256, slice thickness=3 mm, no intersection gap, field of view: 14-30×14-24 cm) with b-values of 0 and 700 s/mm2 (n=3) or 1000 s/mm2 (n=22), and a dynamic contrast-enhanced T1-weighted sequence (TR=3.2–4.28, TE=0.93–1.52, matrix: 256×128–160, mean slice thickness: 5.3 mm, no intersection gap, field of view: 24×24 cm, mean temporal resolution: 10.3s). ADC maps were generated on a voxel-wise basis for each patient using a monoexponential model.
To assess prostate volume, regions of interest were drawn on T2-weighted sequences by a radiologist with 10 years of experience in genitourinary MRI (OA), who was blinded to all clinical and histopathological data, using a commercial PACS application (Centricity, GE Healthcare, Waukesha, WI, USA). Volumes were assessed for the whole prostate and the peripheral zone (PZ)/transition zone (TZ) individually.
In addition, a radiologist performing a fellowship in genitourinary MRI (AMH), who was blinded to all clinical and histopathological data, evaluated all available sequences and identified up to three index lesions per patient that appeared highly likely to represent tumour on all sequences (focal hypointensity on T2-weighted imaging, diffusion restriction on DWI and increased early contrast enhancement with consecutive washout on dynamic contrast-enhanced MRI). Then, to volumetrically assess each lesion, a region of interest (ROI) encircling the tumour was drawn on each ADC map (i.e., slice) where it was visible, using the software ImageJ (version 1.47m, National Institutes of Health, Bethesda, MD, USA [15]). The data from these ROIs were then analyzed with in-house software written in Matlab (Mathworks Inc., Natick, MA, USA), and median ADC values were generated on a per-lesion basis. The software solution Dynamika (ImageAnalysis Ltd., London, UK) was used to analyze the dynamic contrast-enhanced MRI sequences in a similar way: Again, a region of interest was drawn around each lesion on each slice where tumour was visible, and the transfer constant Ktrans of the Tofts model [16] was calculated on a voxel-by-voxel basis. For this, a population-based arterial input function and reference T1 values (1597 ms at 3T, 1317 ms at 1.5T) were used.
In addition, single regions of interest were placed in normal-appearing peripheral and transition zone tissue (whenever not prohibited by diffuse tumour infiltration, see above) for each patient, and median ADC values and Ktrans values were calculated for the individual regions of interest.
Statistical analysis
MRI parameters, PSA values and volume measured at baseline and follow-up MRI were summarized as medians and ranges. For each patient, the relative change between the two examinations ((1st MRI–2nd MRI)/1st MRI) was calculated for volume and for each available MRI parameter in PZ, TZ and tumours separately. The relative change in PSA ((1st PSA–2nd PSA)/1st PSA) was also calculated for each patient. The Wilcoxon signed rank test was used to assess the statistical significance of the changes in the measurements. We then assessed correlations between the changes in PSA and volume, between the changes in PSA and tumour ADC and Ktrans, and between the duration of androgen-deprivation therapy and the change in tumour ADC and Ktrans using the Spearman correlation coefficient between patients. A logistic regression and the generalized estimating equations (GEE) method with an independent correlation matrix and robust standard errors were used to examine whether relative changes or post-therapeutic values of tumour ADC and Ktrans could be used to differentiate tumour from benign tissue in the peripheral or transition zone. The exact Wilcoxon rank sum test was used to compare changes in tumour ADC and Ktrans between PSA nadir groups with measurable and non-measurable (<0.05 ng/ml) PSA levels. The p-values were adjusted to control for false discovery rate (FDR) [17] in testing correlations and in the comparison between PSA nadir groups.
A test with a p-value <0.05 was considered statistically significant. All statistical analyses were performed in software packages SAS 9.2 (SAS Institute Inc., Cary, NC, USA) and R version 2.13 (The R Foundation for Statistical Computing).
Results
Patient and tumour characteristics
This study included 30 men (mean age, 69 years; range, 48 - 79 years), in which a total of 34 tumorous lesions were measured in 27 patients; 3 patients had two and 2 patients had three lesions measured. More detailed patient and tumour characteristics can be found in Table 1.
Table 1.
Summarized patient and tumour characteristics. 34 lesions were assessed in 27 patients; Gleason score refers to the highest Gleason score on TRUS- guided biopsy.
| Age (years; mean, range) | 69 (48 – 79) |
| Gleason score | |
| 3+3 | 4/27 (15%) |
| 3+4 | 11/27 (41%) |
| 4+3 | 1/27 (4%) |
| 4+4 | 5/27 (18%) |
| 4+5 | 6/27 (22%) |
| cT stage | |
| T1c | 9/27 (34%) |
| T2a | 7/27 (26%) |
| T2b | 4/27 (15%) |
| T2c | 2/27 (7%) |
| T3a | 2/27 (7%) |
| T3b | 2/27 (7%) |
| T4 | 1/27 (4%) |
Effect of androgen-deprivation therapy on prostate volume, PSA and MRI parameters
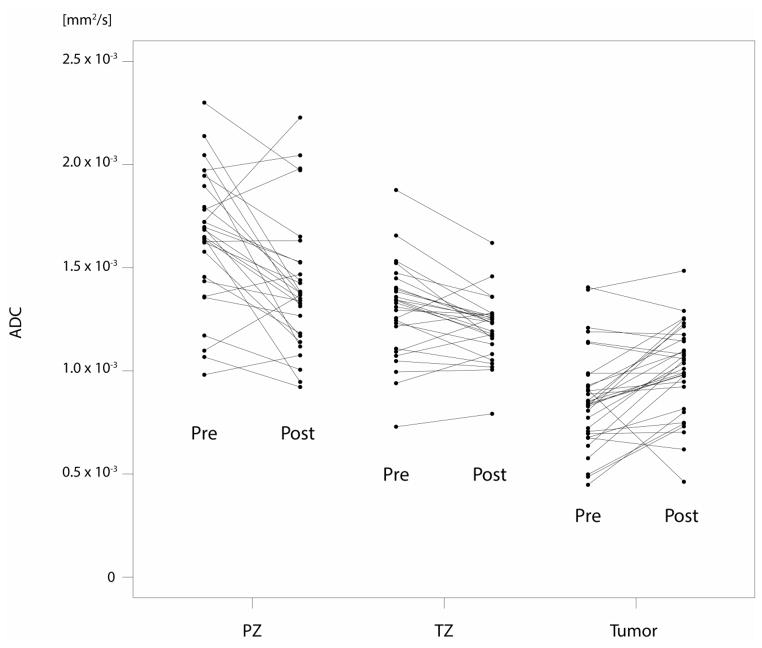
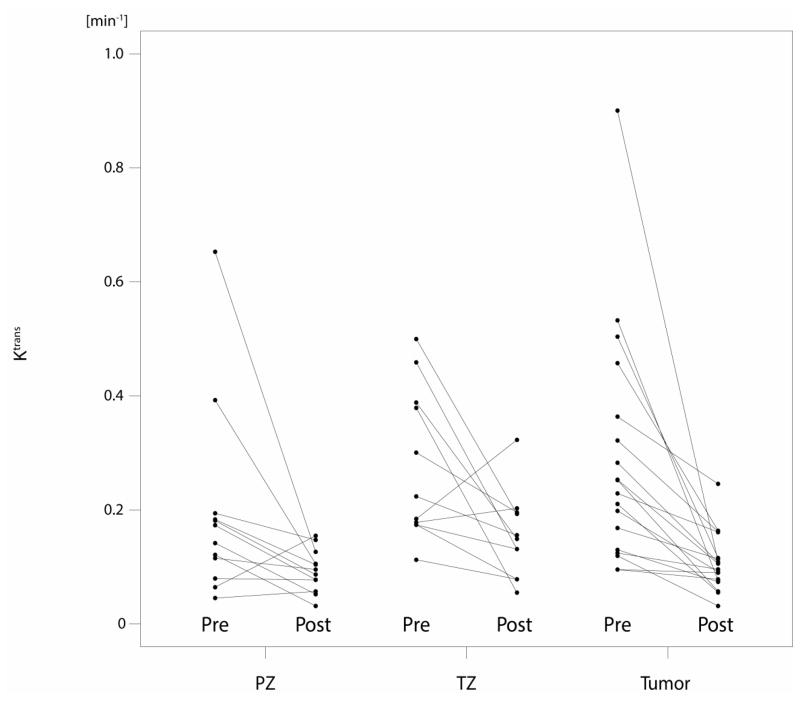
Prostate volume, PSA values, ADC and Ktrans values for peripheral zone (PZ), transition zone (TZ) and tumour at baseline as well as at the follow-up MRI are summarized in Table 2a, and their relative changes through therapy are summarized in Table 2b. Fig. 2a/b demonstrates the changes between the two MRI examinations on diffusion-weighted and dynamic contrast-enhanced MRI.
Table 2a.
Summarized descriptive statistics for prostate volume (ml), the apparent diffusion coefficient (ADC, mm2/s) and the transfer constant Ktrans (min−1). ‘Pre’ and ‘Post MRI’ indicate MRI examinations before and after start of treatment. PZ = peripheral zone. TZ = transition zone.
| PZ | TZ | Tumour | ||||
|---|---|---|---|---|---|---|
|
| ||||||
| Pre MRI Median (Range) | Post MRI Median (Range) | Pre MRI Median (Range) | Post MRI Median (Range) | Pre MRI Median (Range) | Post MRI Median (Range) | |
| Volume | 20.3 (7.3, 40.7) | 12.1 (6.7, 21.7) | 40.7 (8.4,128.4) | 30.9 (6.6, 76.7) | ||
|
| ||||||
| ADC (x10−3) | 1.7 (1.0, 2.3) | 1.4 (0.9, 2.2) | 1.3 (0.7, 1.9) | 1.2 (0.8, 1.6) | 0.8 (0.4, 1.4) | 1.0 (0.5, 1.5) |
| Ktrans | 0.16 (0.05, 0.65) | 0.09 (0.03, 0.15) | 0.22 (0.11, 0.5) | 0.15 (0.05, 0.32) | 0.24 (0.1, 0.9) | 0.1 (0.03, 0.25) |
Table 2b.
Relative decrease in prostate volume, apparent diffusion coefficient (ADC) and Ktrans between the two MRI examinations. Negative relative changes indicate an increase (e.g., in ADC measured in tumour). PZ = peripheral zone. TZ = transition zone.
| PZ | TZ | Tumour | ||||
|---|---|---|---|---|---|---|
| Median (Range),n | p- value | Median (Range),n | p- value | Median (Range),n | p- value | |
| Volume | 0.44 (-1.71, 0.78), 30 | <.001 | 0.29 (0.01, 0.55), 30 | <.001 | ||
| ADC | 0.14 (−0.29, 0.43), 28 | 0.001 | 0.08 (−0.16, 0.24), 27 | 0.022 | −0.17 (−0.79, 0.49), 32 | <.001 |
| Ktrans | 0.48 (−1.40, 0.81), 12 | 0.077 | 0.35 (−0.75, 0.86), 11 | 0.054 | 0.56 (0.06, 0.88), 18 | <.001 |
Fig. 2.
a/b: Plots for ADC (mm2/s) and Ktrans (min−1) values before (pre) and after the start (post) of androgen-deprivation therapy for each individual patient, stratified by peripheral zone (PZ), transition zone (TZ) and tumour.
PSA values decreased by 94% (p<0.001) through therapy, from a median of 6.98 ng/ml to a median of 0.42 ng/ml. Prostate volume also decreased significantly by 33% (9–58%) from a median of 57 ml to a median of 39 ml (p<0.001), with the peripheral zone in particular demonstrating a larger decrease of 44% compared with a 29% decrease in transition zone volume.
Median tumour ADC values increased significantly, by 17% (p<0.001), from 0.8 to 1.0 x10⁻³ mm2/s, whereas median ADC values for both PZ and TZ decreased significantly through therapy (p=0.001 and 0.022, respectively). The relative change in ADC values in tumour was found to be significantly different from that in peripheral zone or transition zone tissue (adjusted p<0.001 for both comparisons). Also, post-therapeutic ADC values alone differed significantly between tumour and benign peripheral and transition zone tissue (adjusted p<0.001 for both comparisons).
Conversely, the median Ktrans value decreased significantly (p<0.001), by 56%, in tumour, from 0.24 to 0.1 min−1. Median Ktrans values in benign peripheral (−48%; p=0.077) and transition zone (−35%; p=0.054) tissue also decreased, but the decreases did not reach statistical significance. The relative change in Ktrans did not differ significantly between tumour and benign tissue (adjusted p=0.14 for comparisons to both PZ and TZ tissue). There was also no significant difference in Ktrans values at follow-up MRI between tumour and benign tissue (adjusted p-values: 0.149 and 0.337 for comparisons to PZ and TZ tissue, respectively).
Correlation of MRI findings with clinical variables
The relative changes in tumour ADC and PSA correlated significantly with each other (p=0.031, see Table 3). The relative change in prostate volume on MRI did not correlate with the relative change in PSA. Furthermore, no MRI parameters correlated significantly with the duration of treatment or the presence of a non-measurable PSA nadir during therapy (p≥0.39). However, descriptive analysis showed that tumour ADC values increased by 25% in patients with a non-measurable PSA during therapy, whereas they increased by only 7% in the group of patients with a measurable PSA (see Table 4).
Table 3.
Correlations between relative changes of prostate volumes and prostate-specific antigen values (PSA, ng/ml), between MRI parameters (ADC, Ktrans) and prostate-specific antigen values (PSA, ng/ml), as well as between relative changes of tumour ADC and Ktrans and duration of androgen-deprivation therapy (ADT).
| Spearmen Correlation Coefficient | Adjusted p- value | |
|---|---|---|
| Volume PZ & PSA | 0.042 | 0.827 |
| Volume TZ & PSA | 0.071 | 0.827 |
| Whole volume & PSA | 0.337 | 0.206 |
|
| ||
| ADC & PSA | −0.474 | 0.031 |
| Ktrans & PSA | −0.159 | 0.631 |
|
| ||
| ADC & ADT duration | −0.279 | 0.359 |
| Ktrans & ADT duration | −0.289 | 0.372 |
Table 4.
Associations between relative changes of tumour ADC (mm2/s) and Ktrans (min-1) and PSA nadirs during therapy and when including the complete follow-up.
| Median (range), n | PSA nadir during therapy | PSA nadir including follow-up | ||||
|---|---|---|---|---|---|---|
|
| ||||||
| <0.05 ng/ml | Measurable PSA | Adjusted p Value | <0.05 ng/ml | Measurable PSA | Adjusted p Value | |
| ADC | −0.25 (−0.69, 0.49), 13 | −0.07 (−0.79, 0.08), 19 | 0.390 | −0.17 (−0.69, 0.49), 21 | −0.16 (−0.79, 0.08), 11 | 0.907 |
| Ktrans | 0.54 (0.23, 0.86), 7 | 0.58 (0.06, 0.88), 11 | 0.724 | 0.52 (0.06, 0.86), 14 | 0.63 (0.32, 0.88), 4 | 0.763 |
Discussion
In our study, androgen-deprivation therapy (ADT) caused a significant reduction in prostate volume, in particular of the peripheral zone. In addition, ADT caused ADC values to increase significantly in tumour while decreasing in benign prostatic tissue. The relative change in ADC values differed significantly between tumour and benign prostatic tissue, and post-therapeutic ADC values themselves also differed significantly between tumour and benign tissue. The transfer constant (Ktrans) decreased in both tumour and benign tissue, but the decrease was only significant in tumour. Neither relative changes in Ktrans nor post-therapeutic Ktrans values differed significantly between tumour and benign tissue. The relative change of tumour ADC correlated significantly with the decrease in PSA, but no MRI parameters correlated with the duration of treatment or PSA nadirs.
ADT is commonly used in men with advanced prostate cancer, as it has proven to be of value for local and distant tumour control [2, 3]. However, while MRI is frequently used for prostate cancer detection, active surveillance, or response assessment after surgery or radiation therapy, its value in the assessment of response to ADT remains unclear. This may be due to the known effect of ADT on the appearance of the prostate on T2-weighted MR images, which includes not only a shrinking of the prostate but also a diffuse decrease of signal intensity, rendering tumour delineation difficult when relying on T2-weighted images alone [4, 5]. So far, the value of multi-parametric MRI in this setting has scarcely been investigated, and only a few studies have examined the effect of ADT on functional MRI parameters [18–20].
In accordance with previous studies, our study showed that ADT resulted in shrinking of the prostate as seen on MRI [4, 18, 21]. The peripheral zone in particular showed a marked (44%) decrease in volume. These findings -- as well as our finding that PSA fell by a median of 94% during ADT -- align well with the fact that ADT is known to induce involution of glandular tissue in addition to stromal hypercellularity on histopathology [22]. Histopathological analyses indicate that ADT also has a distinct effect on tumour tissue in prostate cancer, resulting in a “loss of glandular architecture, cytoplasmatic clearing, nuclear pyknosis, cytoplasmatic vacuolization and mucinous degeneration” [22]. These histopathological changes should generally allow for increased diffusion after therapy and therefore align very well with our finding of a significant increase in ADC values in prostate cancer through treatment. However, Barrett et al. [18] did not find an increase in ADC values in prostate cancer in a similar setting, though, like us, they saw a significant decrease of ADC values in benign prostatic tissue. This discrepancy might potentially be due to the smaller number of patients with DWI analysis in their study (n=18) and to differences between the DWI protocols (e.g., b-values) used in the two studies.
ADT is also known to cause de-vascularization in both tumorous and benign prostatic tissue [23]. This aligns with our finding of a significant decrease of the transfer constant (Ktrans) in tumours, which has been found previously in patients undergoing ADT [18–20]. Although we also found a decrease of Ktrans in benign prostatic tissue, it was not statistically significant.
Our study expanded on previous reports by applying volumetric tumour assessment instead of single ROI-based analysis [19, 20] and by providing a more detailed assessment of the ability of multi-parametric MRI to monitor treatment response: While post-treatment ADC values differed significantly between tumour and benign tissue in the PZ and TZ, the great overlap of generated values, both in this and prior studies, renders tumour delineation difficult after therapy. However, because the relative change in ADC values differed significantly between tumour and benign tissue and also correlated with the relative change in PSA, it could be of use in monitoring treatment response. Since tumour ADC values increased through therapy, but those of benign tissue decreased, direct comparison between pre- and post-therapeutic MRI might help in delineating the tumour after treatment.
Neither the decrease in Ktrans nor the post-therapeutic Ktrans values themselves differed significantly between tumour and benign tissue, indicating that Ktrans might be of limited value in this clinical setting. Furthermore, the relative changes in ADC and Ktrans did not correlate with the duration of ADT. This might be because the changes in these MRI parameters occur early after the start of therapy, as ADT causes serum castrate levels of testosterone after a few weeks [24]; thus, a correlation might only be found if the second MRI were performed earlier than it was in this and prior studies.
PSA nadirs after the start of therapy have been shown to have prognostic value for men with prostate cancer [12–14]. Therefore, associations between PSA nadirs and MRI parameters could render MRI parameters particularly helpful for assessing response to ADT. However, MRI parameters did not differ significantly between patients with and patients without a measurable PSA nadir during therapy or during the complete follow-up. Decreases in ADC values did tend to be greater among patients with a non-measurable PSA during therapy, but this trend was not statistically significant.
Further studies are needed to investigate the value of multi-parametric MRI for monitoring response to ADT. Ideally, these studies should build on our results and incorporate new approaches (e.g., intravoxel incoherent motion imaging), which could potentially lead to the identification of new imaging correlates for biological changes that occur in prostatic tissue during ADT.
We acknowledge the limitations of our study: First, because of the limited number of patients, particularly those with dynamic contrast-enhanced MRI measurements, it was not possible for us to further stratify our analysis, for example, by tumour Gleason score. Secondly, the use of databases from radiation-oncology for our initial search for patients might have introduced a selection-bias towards patients with planned subsequent radiation therapy and the fact that all lesions were assessed by a single reader might inevitably have caused a bias as to which lesions were included into analysis. Additionally, even though we detected several statistically significant differences, there was significant overlap between, for example, changes in MRI parameters measured in prostate cancer and benign prostatic tissue, potentially limiting the value of our findings for routine clinical practice. Our results should therefore be regarded as preliminary, and future studies are needed to verify our findings in a larger patient cohort. Due to the retrospective nature of our study, we were not able to account for variations in the MRI protocols (e.g., with regard to field strength, b-values) or the treatment duration and the time of second MRI, which could have influenced our results. In particular, we could not account for differing field strengths between MRI examinations before and after start of therapy in 12 out of 30 patients, which potentially could have influenced generated ADC values, or for the variability of time intervals between the beginning of ADT and MRI examinations. Finally, patients included in this study did have biopsy-proven prostate cancer, but whole-mount step-section histopathological maps were not available for tumour localization, so the potential for errors in tumour assessment cannot be excluded. Therefore, our preliminary results require verification in a prospective trial with whole-mount histopathology or MRI- guided biopsy as standard of reference.
In conclusion, our study demonstrated that androgen-deprivation therapy causes significant changes to prostate volume and to ADC and Ktrans values in both tumorous and benign prostatic tissue; of these, the change in tumour ADC values may be of use in the assessment of therapeutic response. However, future studies incorporating new imaging approaches are needed to establish multi-parametric MRI as a tool for monitoring response to androgen-deprivation therapy.
Fig. 1.
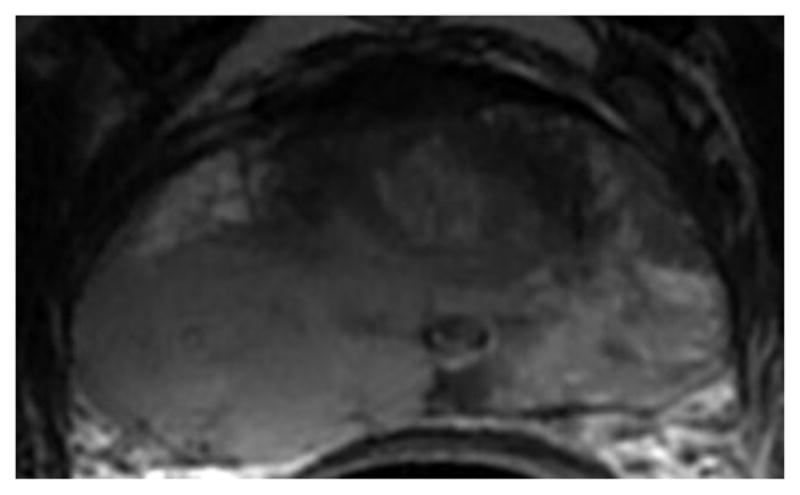
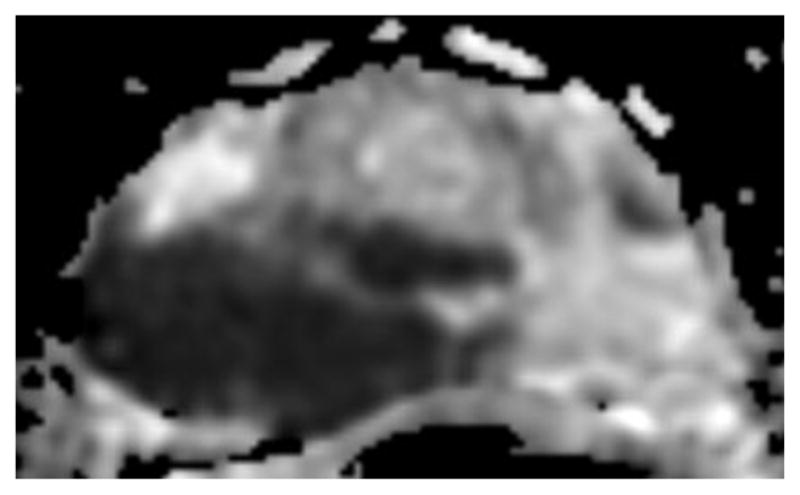
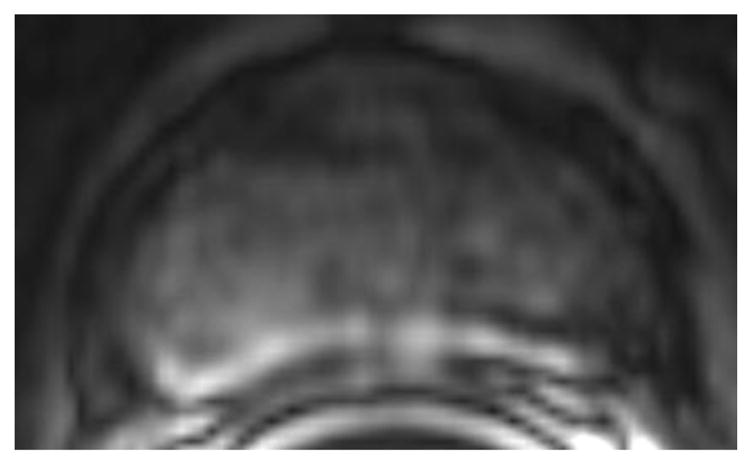
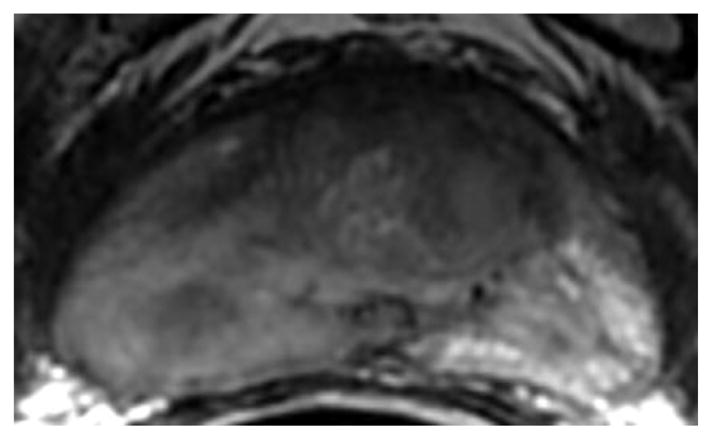
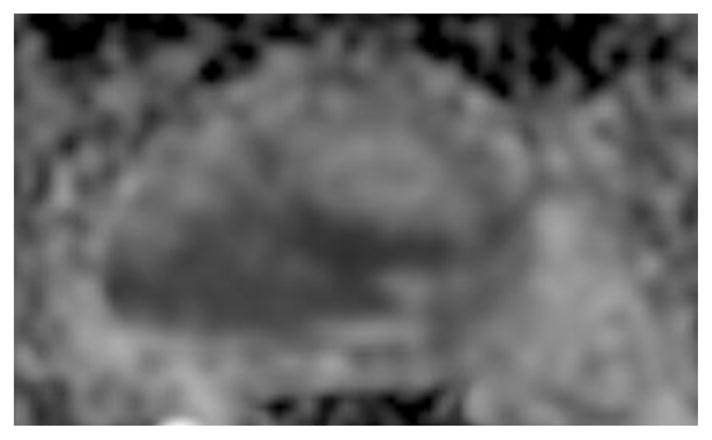
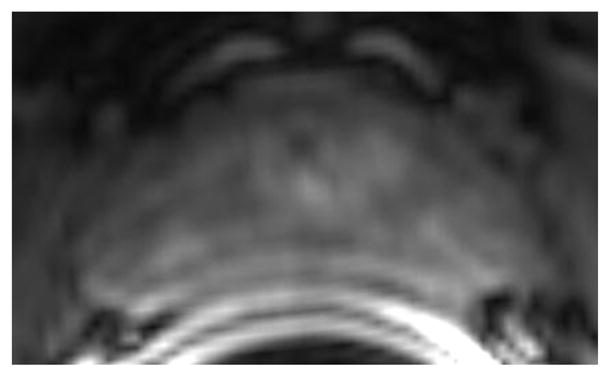
a-f: Sixty-eight-year-old man with histopathologically-proven prostate cancer (Gleason score 4+4) who had MRI examinations before (a-c) and after the start (d-f) of androgen-deprivation therapy: (a/d) T2-weighted images, (b/e) ADC maps (b = 1000 s/mm2), (c/f) T1-weighted dynamic contrast-enhanced MR images.
Key points.
Androgen-deprivation therapy caused changes of ADC, Ktrans in tumour and benign prostate.
Prostate volume and PSA values decreased significantly through therapy.
ADC values may offer help in monitoring treatment response.
Acknowledgments
The authors thank Ada Muellner, MS for editing the manuscript. The scientific guarantor of this publication is Dr. Andreas M. Hötker. The authors of this manuscript declare no relationships with any companies, whose products or services may be related to the subject matter of the article. This study has received funding by the Peter Michael Foundation. Chaya Moskowitz and Junting Zheng were supported by the MSKCC Biostatistics Core grant (P30 CA008748). Chaya Moskowitz PhD and Junting Zheng MS kindly provided statistical advice for this manuscript. Institutional Review Board approval was obtained. Written informed consent was waived by the Institutional Review Board. No study subjects or cohorts have been previously reported. Methodology: retrospective, experimental, performed at one institution.
References
- 1.Siegel R, Ma J, Zou Z, Jemal A. Cancer statistics, 2014. CA Cancer J Clin. 2014;64(1):9–29. doi: 10.3322/caac.21208. [DOI] [PubMed] [Google Scholar]
- 2.Denham JW, Steigler A, Lamb DS, Joseph D, Turner S, Matthews J, et al. Short-term neoadjuvant androgen deprivation and radiotherapy for locally advanced prostate cancer: 10-year data from the TROG 96.01 randomised trial. Lancet Oncol. 2011;12(5):451–9. doi: 10.1016/S1470-2045(11)70063-8. [DOI] [PubMed] [Google Scholar]
- 3.Lawton CA, Winter K, Grignon D, Pilepich MV. Androgen suppression plus radiation versus radiation alone for patients with stage D1/pathologic node-positive adenocarcinoma of the prostate: updated results based on national prospective randomized trial Radiation Therapy Oncology Group 85–31. J Clin Oncol. 2005;23(4):800–7. doi: 10.1200/JCO.2005.08.141. [DOI] [PubMed] [Google Scholar]
- 4.Chen M, Hricak H, Kalbhen CL, Kurhanewicz J, Vigneron DB, Weiss JM, et al. Hormonal ablation of prostatic cancer: effects on prostate morphology, tumor detection, and staging by endorectal coil MR imaging. AJR Am J Roentgenol. 1996;166(5):1157–63. doi: 10.2214/ajr.166.5.8615261. [DOI] [PubMed] [Google Scholar]
- 5.Mueller-Lisse UG, Vigneron DB, Hricak H, Swanson MG, Carroll PR, Bessette A, et al. Localized prostate cancer: effect of hormone deprivation therapy measured by using combined three-dimensional 1H MR spectroscopy and MR imaging: clinicopathologic case-controlled study. Radiology. 2001;221(2):380–90. doi: 10.1148/radiol.2211001582. [DOI] [PubMed] [Google Scholar]
- 6.Haghighi M, Shah S, Taneja SS, Rosenkrantz AB. Prostate cancer: diffusion-weighted imaging versus dynamic-contrast enhanced imaging for tumor localization-a meta-analysis. J Comput Assist Tomogr. 2013;37(6):980–8. doi: 10.1097/RCT.0b013e3182a3f9c7. [DOI] [PubMed] [Google Scholar]
- 7.Arumainayagam N, Ahmed HU, Moore CM, Freeman A, Allen C, Sohaib SA, et al. Multiparametric MR imaging for detection of clinically significant prostate cancer: a validation cohort study with transperineal template prostate mapping as the reference standard. Radiology. 2013;268(3):761–9. doi: 10.1148/radiol.13120641. [DOI] [PubMed] [Google Scholar]
- 8.Donati OF, Afaq A, Vargas HA, Mazaheri Y, Zheng J, Moskowitz CS, et al. Prostate MRI: evaluating tumor volume and apparent diffusion coefficient as surrogate biomarkers for predicting tumor Gleason score. Clin Cancer Res. 2014;20(14):3705–11. doi: 10.1158/1078-0432.CCR-14-0044. [DOI] [PubMed] [Google Scholar]
- 9.Vos EK, Litjens, Geert JS, Kobus T, Hambrock T, Kaa, Hulsbergen-van de Christina A, Barentsz JO, et al. Assessment of Prostate Cancer Aggressiveness Using Dynamic Contrast-enhanced Magnetic Resonance Imaging at 3 T. Eur Urol. 2013;64(3):448–55. doi: 10.1016/j.eururo.2013.05.045. [DOI] [PubMed] [Google Scholar]
- 10.Donati OF, Jung SI, Vargas HA, Gultekin DH, Zheng J, Moskowitz CS, et al. Multiparametric Prostate MR Imaging with T2-weighted, Diffusion-weighted, and Dynamic Contrast-enhanced Sequences: Are All Pulse Sequences Necessary to Detect Locally Recurrent Prostate Cancer after Radiation Therapy? Radiology. 2013;268(2):440–50. doi: 10.1148/radiol.13122149. [DOI] [PMC free article] [PubMed] [Google Scholar]
- 11.Zelefsky MJ, Gomez DR, Polkinghorn WR, Pei X, Kollmeier M. Biochemical response to androgen deprivation therapy before external beam radiation therapy predicts long-term prostate cancer survival outcomes. International journal of radiation oncology, biology, physics. 2013;86(3):529–33. doi: 10.1016/j.ijrobp.2013.02.004. [DOI] [PubMed] [Google Scholar]
- 12.Alcantara P, Hanlon A, Buyyounouski MK, Horwitz EM, Pollack A. Prostate-specific antigen nadir within 12 months of prostate cancer radiotherapy predicts metastasis and death. Cancer. 2007;109(1):41–7. doi: 10.1002/cncr.22341. [DOI] [PMC free article] [PubMed] [Google Scholar]
- 13.Ray ME, Thames HD, Levy LB, Horwitz EM, Kupelian PA, Martinez AA, et al. PSA nadir predicts biochemical and distant failures after external beam radiotherapy for prostate cancer: a multi-institutional analysis. Int J Radiat Oncol Biol Phys. 2006;64(4):1140–50. doi: 10.1016/j.ijrobp.2005.07.006. [DOI] [PubMed] [Google Scholar]
- 14.Tseng YD, Chen M, Beard CJ, Martin NE, Orio PF, Loffredo M, et al. Posttreatment prostate specific antigen nadir predicts prostate cancer specific and all cause mortality. J Urol. 2012;187(6):2068–73. doi: 10.1016/j.juro.2012.01.073. [DOI] [PubMed] [Google Scholar]
- 15.Schneider CA, Rasband WS, Eliceiri KW. NIH Image to ImageJ: 25 years of image analysis. Nat Meth. 2012;9(7):671–5. doi: 10.1038/nmeth.2089. [DOI] [PMC free article] [PubMed] [Google Scholar]
- 16.Tofts PS, Brix G, Buckley DL, Evelhoch JL, Henderson E, Knopp MV, et al. Estimating kinetic parameters from dynamic contrast-enhanced T(1)-weighted MRI of a diffusable tracer: standardized quantities and symbols. J Magn Reson Imaging. 1999;10(3):223–32. doi: 10.1002/(sici)1522-2586(199909)10:3<223::aid-jmri2>3.0.co;2-s. [DOI] [PubMed] [Google Scholar]
- 17.Benjamini Y, Hochberg Y. Controlling the false discovery rate: a practical and powerful approach to multiple testing. Journal of the Royal Statistical Society Series B 1995 [Google Scholar]
- 18.Barrett T, Gill AB, Kataoka MY, Priest AN, Joubert I, McLean MA, et al. DCE and DW MRI in monitoring response to androgen deprivation therapy in patients with prostate cancer: a feasibility study. Magn Reson Med. 2012;67(3):778–85. doi: 10.1002/mrm.23062. [DOI] [PubMed] [Google Scholar]
- 19.Padhani AR, MacVicar AD, Gapinski CJ, Dearnaley DP, Parker GJ, Suckling J, et al. Effects of androgen deprivation on prostatic morphology and vascular permeability evaluated with mr imaging. Radiology. 2001;218(2):365–74. doi: 10.1148/radiology.218.2.r01ja04365. [DOI] [PubMed] [Google Scholar]
- 20.Alonzi R, Padhani AR, Taylor NJ, Collins DJ, D'Arcy JA, Stirling JJ, et al. Antivascular effects of neoadjuvant androgen deprivation for prostate cancer: an in vivo human study using susceptibility and relaxivity dynamic MRI. Int J Radiat Oncol Biol Phys. 2011;80(3):721–7. doi: 10.1016/j.ijrobp.2010.02.060. [DOI] [PubMed] [Google Scholar]
- 21.Zechmann CM, Aftab K, Didinger B, Giesel FL, Zamecnik P, Thieke C, et al. Changes of prostate gland volume with and without androgen deprivation after intensity modulated radiotherapy - A follow-up study. Radiother Oncol. 2009;90(3):408–12. doi: 10.1016/j.radonc.2008.09.006. [DOI] [PubMed] [Google Scholar]
- 22.Reuter VE. Pathological changes in benign and malignant prostatic tissue following androgen deprivation therapy. Urology. 1997;49(3A Suppl):16–22. doi: 10.1016/s0090-4295(97)00164-7. [DOI] [PubMed] [Google Scholar]
- 23.Joseph IB, Nelson JB, Denmeade SR, Isaacs JT. Androgens regulate vascular endothelial growth factor content in normal and malignant prostatic tissue. Clin Cancer Res. 1997;3(12 Pt 1):2507–11. [PubMed] [Google Scholar]
- 24.Appu S, Lawrentschuk N, Grills RJ, Neerhut G. Effectiveness of cyproterone acetate in achieving castration and preventing luteinizing hormone releasing hormone analogue induced testosterone surge in patients with prostate cancer. J Urol. 2005;174(1):140–2. doi: 10.1097/01.ju.0000161591.86721.e5. [DOI] [PubMed] [Google Scholar]


