Abstract
We applied a linear-array-based photoacoustic probe to detect melanin-containing melanoma tumor depth and volume in nude mice in vivo. This system can image melanomas at five frames per second (fps), which is much faster than our previous handheld single transducer system (0.1 fps). We first theoretically show that, in addition to the higher frame rate, almost the entire boundary of the melanoma can be detected by the linear-array-based probe, while only the horizontal boundary could be detected by the previous system. Then we demonstrate the ability of this linear-array-based system in measuring both the depth and volume of melanoma through phantom, ex vivo, and in vivo experiments. The volume detection ability also enables us to accurately calculate the rate of growth of the tumor, which is an important parameter in quantifying the tumor activity. Our results show that this system can be used for clinical melanoma diagnosis and treatment in humans at the bedside.
Keywords: photoacoustic, handheld, melanoma, rate of growth
Melanoma is the most serious form of skin cancer, and since the 1970's, the incidence of melanoma has increased markedly in fair-skinned populations living in industrialized countries [1]. Worldwide, it is now the 4th most common cancer in men and 5th most common cancer in women. In addition, it is estimated that the lifetime risk of developing melanoma for persons born in the year 2014 will be 1 in 50 [2]. Early diagnosis is the key, as melanoma is essentially curable if diagnosed when it is localized and non-invasive, but is fatal when metastatic. Currently, skin examination and recognition of gross lesion characteristics, followed by biopsy and histological examination of any suspicious lesions is the standard of care.
In the clinical setting, pigmented lesions that are concerning for melanoma may oftentimes be partially biopsied (either by tangential or punch biopsy), particularly in the cosmetically sensitive areas of the faces, hands, or feet. In these instances, if a diagnosis of melanoma is made on partial biopsy, a provisional Breslow's depth may be reported, as only part of the tumor is available for microscopic evaluation. A recent study shows that approximately 14% of all melanoma specimens were partially biopsied, leading not only to significant misdiagnosis, but also to microstaging inaccuracy [3]. The same group had earlier demonstrated that in the hands of experienced dermatologists, accuracy of tumor depth by partial biopsy was achieved in only 88% of samples, which is unacceptable for appropriate patient management [4]. In addition, in the current health care environment, many patients with dermatologic disease will be seen by physicians instead of by dermatologists, and the use of physician extenders is increasing: all of these contribute to a current trend, recognized several years ago, of inadequate technique and biopsy size [5]. In sum, the surgeon is often faced with a treatment dilemma in the case of a partially biopsied melanoma — whether to plan a “definitive” surgery based upon a provisional measurement in the anticipation that the Breslow's depth measurement represents the thickest portion of the tumor, or perform an excisional biopsy of the entire remaining lesion to get an accurate measurement prior to definitive surgery [6]. Thus, in vivo imaging of melanomas to determine tumor depth could significantly aid melanoma patient management and alleviate the need for a second, excisional biopsy.
Current techniques for melanoma detection have various limitations [7]. High-frequency ultrasound can measure melanoma depth, but the image contrast is poor because the acoustic impedance difference between melanoma and surrounding tissues is small [8]. In distinction, optical methods, such as dermoscopy [9], confocal microscopy [10], and optical coherence tomography [11], employ high pigment contrast to facilitate melanoma detection, but the penetration is highly limited because these modalities work only in the optical ballistic regime. Other imaging modalities, such as magnetic resonance imaging (MRI) [12] and positron emission tomography [13], are also used in detection of melanoma metastasis, however their resolution is poor for the detection of small primary cutaneous tumors of the skin and they are not cost-effective. Thus, there is a need to develop an improved imaging technique for detection and characterization of melanoma in vivo.
Combining both optical contrast and acoustic penetration, photoacoustic (PA) tomography (PAT) has been successfully applied in cutaneous vasculature imaging in humans in vivo [14, 15]. In PAT, the target is first illuminated with a short laser pulse. Then the laser light is absorbed by the target, leading to a temperature rise and a subsequent initial pressure rise [16-21]. The pressure rise propagates as a photoacoustic wave and is finally detected by either a focused ultrasonic transducer or a transducer array. Because melanin has strong optical absorption over a broad spectrum, it can be detected by PAT with high contrast. Meanwhile, high resolution can be maintained in PAT because the photoacoustic wave has low scattering in tissue [22].
We recently reported that, in a murine xenograft melanoma model, tumor thickness can be accurately determined in vivo using a handheld photoacoustic probe [6]. In that study, a single ultrasonic transducer and a 10 Hz laser were employed, limiting the imaging speed to around one frame per ten seconds. In addition, only the horizontal boundaries of the tumor could be detected due to the limited view angle of the focused transducer. To address these limitations, we next employed an ultrasonic transducer-array-based photoacoustic probe to detect melanoma depth, as described herein. The imaging speed can be increased to five frames per second by using a 20 Hz laser. Using this probe and employing the large acceptance angle of the transducer array in the imaging plane, nearly the entire perimeter of the melanoma could be assessed. Furthermore, by simply adding a one-dimensional scanning stage, three-dimensional (3D) measurements of the melanoma could be obtained while the small footprint and convenience of the handheld device are maintained. With its ability to detect the margins in 3 axes, the array-based probe can be further used to determine the volume of a melanoma. It has been proposed that, similar to other solid tumors, melanoma volume may prove to be an excellent prognostic indicator — probably superior to Breslow's depth [23]. In this manuscript, we first theoretically demonstrate that the linear-array-based probe can be used to determine and measure nearly the entire melanoma boundary, while the single ultrasonic transducer-based probe can detect only the horizontal boundary. Then we experimentally prove the ability of the linear-array-based probe to measure melanomas in phantoms, ex vivo, and in vivo.
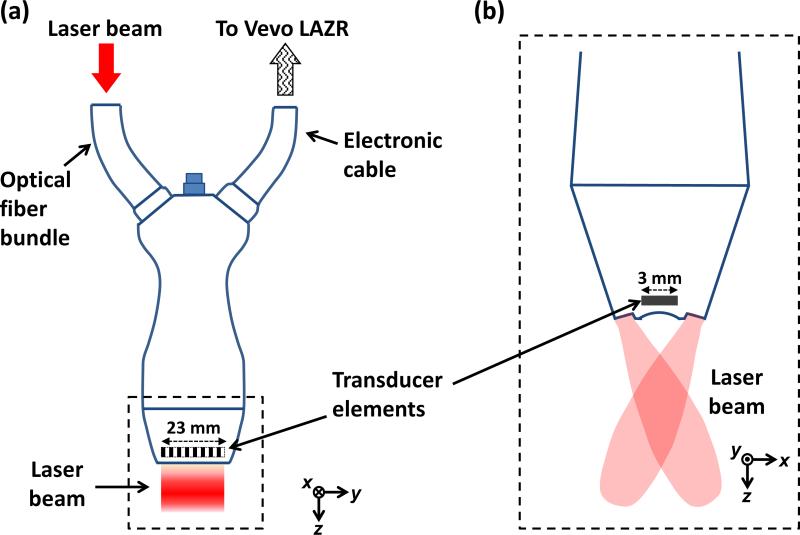
Figure 1 shows a schematic of the linear-array-based photoacoustic probe for melanoma imaging. A linear-array transducer (LZ250, Visualsonics Inc.), with a central frequency of 21 MHz and a 55% bandwidth, detected the photoacoustic signals [24]. The transducer array contained 256 elements, and had a size of 23 mm × 3 mm, as shown in Fig. 1. Each element of the array was cylindrically focused, and the focal length was 15 mm. A tunable optical parametric oscillator laser with a 20 Hz pulse repetition rate was the light source and was coupled into an optical fiber bundle. In our experiments, for melanoma imaging, the wavelength was set to 680 nm, where melanin absorbs much more strongly than blood. The optical fiber bundle and an ultrasound cable were incorporated into the same package with the linear transducer array. The beam incident angle was 30° with respect to the imaging plane. The optical fluence on the skin surface was estimated to be 10 mJ/cm2, which was less than the safety limit set by the American National Standard Institute (ANSI) (20 mJ/cm2) at this wavelength. Each laser pulse generated a two-dimensional image. To get a 3D PA image of the melanoma, the transducer array was scanned linearly along its elevational direction (x axis) by a motorized stage. An imaging station (Vevo LAZR, Visualsonics Inc.) displayed the photoacoustic images at five frames/second. The raw data was then exported to a computer for image reconstruction and analysis.
Fig. 1.
Schematic diagram of the LZ250 linear transducer array with optical fiber bundle integrated. (a) View from the elevational direction (x). (b) View of the transducer array's head (enclosed by a dashed box in (a)) from the lateral direction (y).
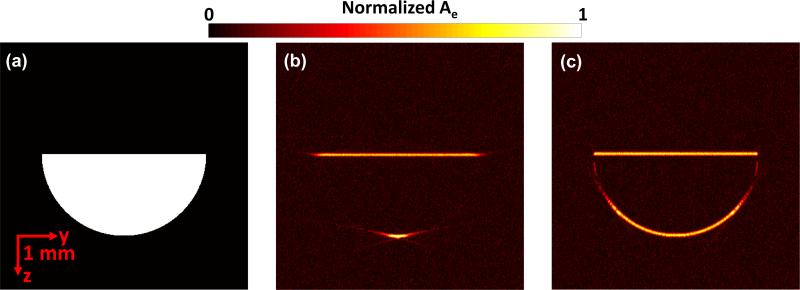
We first simulated and compared the single focused ultrasonic transducer described previously [6] with the array used in this paper. The simulation was conducted with the k-space pseudo-spectral method [25], in which the acoustic wave equation was modeled and solved in k-space, utilizing the benefits of fast Fourier transformation. For the single focused ultrasonic transducer, the central frequency, bandwidth, focal length, and diameter were 25 MHz, 100%, 12.7 mm, and 6.4 mm, respectively. The parameters of the array have been described above. Fig. 2(a) shows the melanoma mimicking target, a half disk with a radius of 2 mm. To form the image, we raster scanned the single focused ultrasonic transducer and combined the adjacent A-lines, while a time-reversal reconstruction method was used for the array system. In the time reversal method, the received pressure data were used as boundary conditions and the acoustic waves were propagated in time-reversed order to find the pressure map at the initial time [26]. Fig. 2(b) shows that only the horizontal boundaries of the target are recovered by the single transducer based system. In contrast, almost the entire boundary of the target is recovered using the linear array for detection (Fig. 2c). In addition, because the linear array scan does not need to be performed, the imaging speed can be significantly improved.
Fig. 2.
Simulation of the single focused ultrasonic transducer and the linear array. (a) Preset energy deposition distribution (Ae). Recovered Ae by the single focused ultrasonic transducer (b) and by the linear array transducer (c).
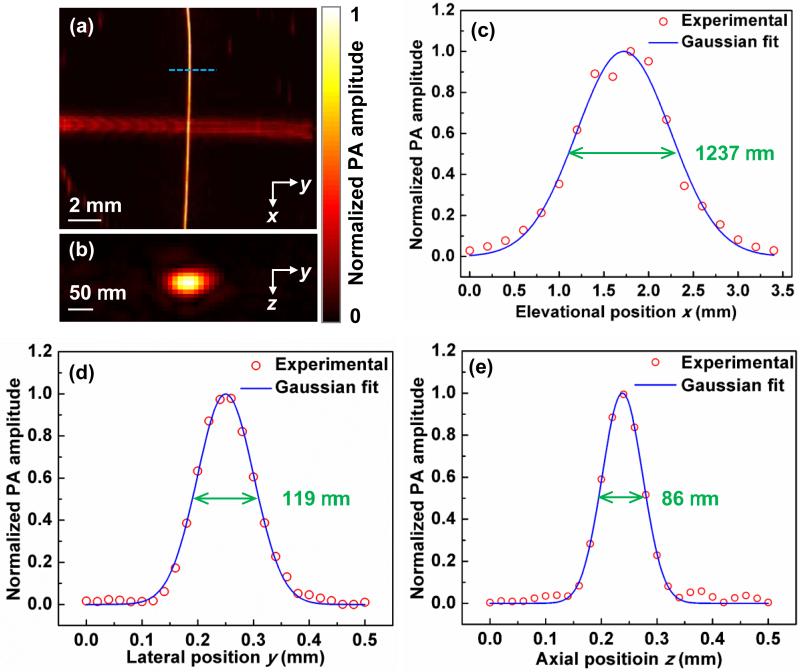
The spatial resolution of the linear-array based PA probe was then quantified by imaging two crossed 6-μm-diameter carbon fibers, shown in Fig. 3(a-b). The carbon fibers were placed in the x-y plane at a distance of 9 mm from the surface of the linear transducer array. Figures 3(c)-(e) show both the fitting curves and PA amplitude distributions along the elevational (x), lateral (y), and axial (z) directions. The full width at half maximum (FWHM) values, which are also spatial resolutions, are 1237 μm, 119 μm, and 86 μm in the elevational, lateral, and axial directions, respectively [27].
Fig. 3.
Response characteristics of the linear-array probe. (a) Maximum amplitude projection of the two crossed 6-μm-diameter carbon fibers. The diameters differ because of the directional resolution differences. (b) Cross-section image of the vertical carbon fiber along the dashed line in (a). Experimental data and Gaussian fits of the PA amplitude distributions along the (c) x, (d) y, and (e) z directions.
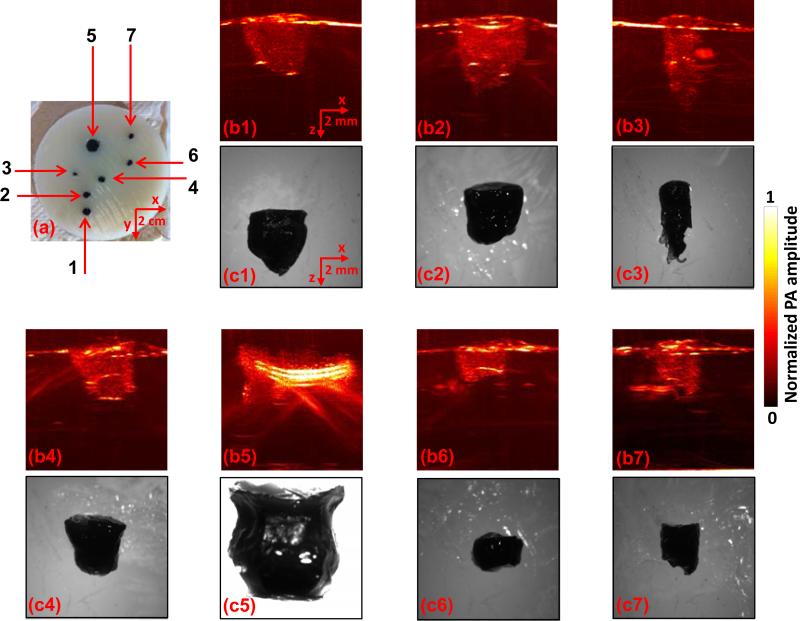
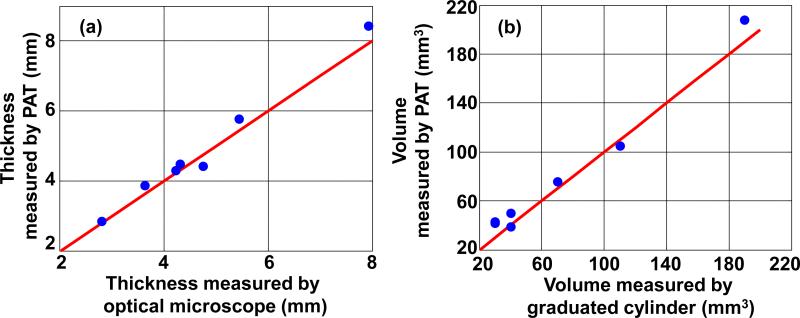
Phantom experiments were then conducted to show the ability of the linear-array-based PA probe to measure melanoma thickness (depth) and calculate tumor volume (size). As shown in Fig. 4(a), melanoma phantoms of varying thicknesses and volumes were prepared. All the phantoms were made from a black ink and agar mixture, which had an absorption coefficient of 70 cm–1 at 680 nm, close to the actual typical melanoma absorption coefficient. To mimic human tissue, the background was made of an agar and intralipid mixture with a scattering coefficient around 100 cm–1 and a scattering anisotropy of ~0.9. To facilitate optimal comparison of melanoma phantoms, we took the maximum-amplitude-projections of the 3D PA images along the elevational direction of the linear array, as shown in Fig. 4(b1-b7). Immediately following the array-based experiments, melanoma phantoms were carefully removed from the agar/intralipid mixture, and corresponding gross images were taken using a standard microscope (EZ4 Stereo microscope, Leica), as shown in Fig. 4(c1-c7). There is an excellent correlation between the PA and gross images, demonstrating the ability of this system to accurately reproduce the phantom in situ. To further demonstrate the accuracy of the PA system and thus its potential for in vivo imaging, we then calculated both the depth and volume of these melanoma phantoms (Fig. 5). The thickness and volume of the melanoma phantoms measured by the standard microscope and a graduated cylinder, respectively, served as the gold standards. In the PA measurements, to quantify the depth, the 6 dB threshold was used to separate the melanoma from the background. To quantify the volume, the 3D melanoma images were first downsampled. The downsampled image pixel size was equal to the resolution in each direction. The downsampled images were then thresholded at 6 dB of the noise level to create melanoma boundaries. In the end, the volume was calculated by integrating the voxels inside the melanoma. We show that both the depths and volumes measured by our system agree well with the standard values, indicating that our linear-array-based PA probe can detect both the depth and volume of deeply seated melanoma in situ with high accuracy.
Fig. 4.
Linear-array-based PA images of melanoma phantoms. (a) Photo of the melanoma phantoms. (b1-b7) and (c1-c7) correspond to the melanoma phantoms 1-7 in (a). Melanoma phantom images acquired by PA (b1-b7) and a standard optical microscope (c1-c7).
Fig. 5.
Depth (a) and volume (b) quantification of melanoma phantoms. Blue dots: experimental measurements. Red lines: ideal line if the PA measurements are identical to the standard measurements.
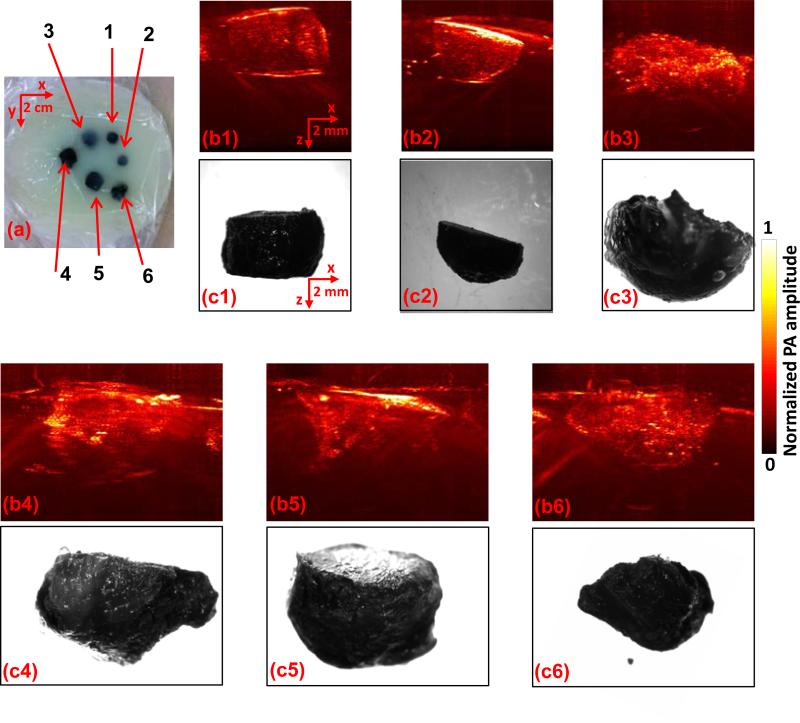
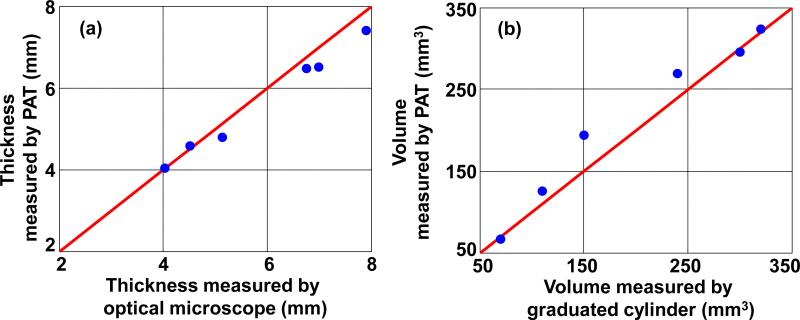
We then performed experiments ex vivo to determine the accuracy of our system for thickness (depth) measurement, and volume calculation. For these experiments, we used a murine xenograft model where B16 melanoma cells were subcutaneously injected into the dorsal surface of nude mice (Hsd:Athymic Nude-Foxn1NU, Harlan Co.; average body weight: 20 g). All experimental animal procedures were carried out in conformity with the laboratory animal protocol approved by the Animal Studies Committee of Washington University in St. Louis. Tumors were allowed to grow spontaneously for 15 days, and the mice were then sacrificed. Fresh tumors excised from nude mice were embedded in the agar and intralipid mixture, prepared as described earlier (Fig. 6a). Imaging and processing was then performed as in the phantom experiments. Similarly, the ex vivo PA images of the melanomas are representative of the tumors as shown in Figs. 6(b) and (c). Again, the thickness and volume values calculated from the images are in accordance with the preset values (shown in Fig. 7). Thus, we conclude that our system should be able to accurately image deep melanomas in vivo.
Fig. 6.
Linear-array-based PA images of ex vivo melanomas. (a) A photo of the ex vivo melanomas. (b1-b6) and (c1-c6) correspond to the melanoma phantoms 1-6 in (a). Melanoma images acquired by PA (b1-b6) and a standard optical microscope (c1-c6).
Fig. 7.
Depth (a) and volume (b) quantification of ex vivo melanomas. Blue dots: experimental measurements. Red lines: ideal line if the PA measurements are identical to the standard measurements.
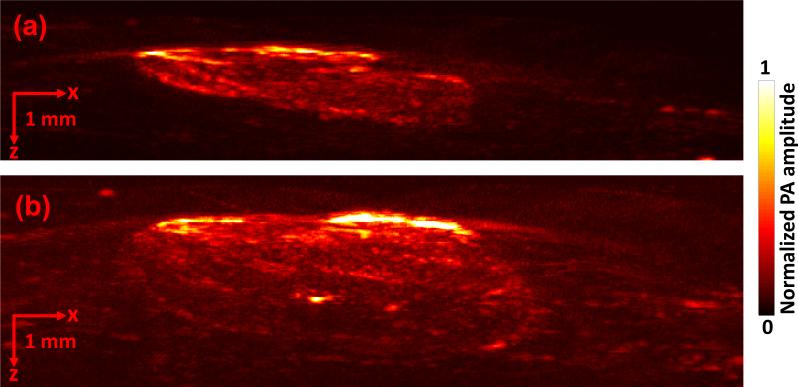
Finally, we imaged mice with melanoma in vivo to show the detection ability of the linear-array-based PA probe. We again employed the murine xenograft model using B16 melanoma cells in nude mice. For image acquisition, mice were anesthetized and kept motionless using a breathing anesthesia system (E-Z Anesthesia, Euthanex), while body temperature was maintained by an electric heating pad. Each measurement was repeated at day 3 and day 6 following the injection of cells (Fig. 8a, b), and the rate of growth (ROG) was calculated. Again the detected melanoma can be clearly distinguished from the surrounding soft tissue. The depth and volume of the melanoma at day 3 and day 6 were measured to be 1.32 mm and 22.365 mm3, and 2.77 mm and 71.931 mm3, respectively. The depth-based and volume-based ROG were calculated to be 0.48 mm/day and 16.555 mm3/day, respectively.
Fig. 8.
Linear-array-based PA images of melanoma acquired in vivo on day 3 (a) and day 6 (b).
In sum, compared to our single ultrasonic transducer based system [6], the linear-array-based system can detect melanoma with an order of magnitude increase in the imaging speed. In addition, because of the large acceptance angle of the linear ultrasonic transducer array, nearly the entire melanoma can be detected in 3D, as opposed to only the horizontal boundary. Employing this technology also enables the calculation of melanoma volume. We hypothesize that, similar to other solid tumors, determination of melanoma volume may represent a more accurate diagnostic and prognostic parameter than the currently used measurement of tumor thickness (Breslow's depth). Furthermore, the ability to determine melanoma volume also provides a more straightforward and accurate way to determine and quantify change in a pigmented lesion that may be indicative of malignancy. We recognize that this increased accuracy comes at a price, considering the cost differential between the array system and the single ultrasonic transducer system. Nevertheless, we are now well poised to apply this system in the clinic to determine whether we can reproduce our findings in patients with pigmented lesions and melanoma. We propose that the increased accuracy afforded by the array will translate into improved management of the melanoma patient. Although we focused on only pigmented lesion detection in this work, it is worth mentioning that unpigmented lesions can also be detected with the assistance of exogenous contrast, such as gold nanocages [28].
Acknowledgments
The authors would like to thank Prof. James Ballard for manuscript editing. This work was sponsored in part by National Institutes of Health grants DP1 EB016986 (NIH Director's Pioneer Award), R01 CA186567 (NIH Director's Transformative Research Award), R01 EB016963, S10 RR026922, and R01 CA159959. L.W. has a financial interest in Microphotoacoustics, Inc. and Endra, Inc., which, however, did not support this work.
References
- 1.Jemal A, Devesa SS, Hartge P, Tucker MA. Recent trends in cutaneous melanoma incidence among whites in the United States. J. Natl. Cancer Inst. 2001;93(9):678–683. doi: 10.1093/jnci/93.9.678. [DOI] [PubMed] [Google Scholar]
- 2.American Cancer Society. http://www.cancer.org/ [Google Scholar]
- 3.Ng JC, Swain S, Dowling JP, Wolfe R, Simpson P, Kelly JW. The impact of partial biopsy on histopathologic diagnosis of cutaneous melanoma: experience of an Australian tertiary regerral service. Arch. Dermatol. 2010;146(3):234–239. doi: 10.1001/archdermatol.2010.14. [DOI] [PubMed] [Google Scholar]
- 4.Ng PC, Barzilai DA, Ismail SA, Averitte RL, Jr., Gilliam AC. Eveluating invasive cutaneous melanoma: is the initial biopsy representative of the final depth? J. Am. Acad. Dermatol. 2003;48(3):420–424. doi: 10.1067/mjd.2003.106. [DOI] [PubMed] [Google Scholar]
- 5.Sellheyer K, Nelson P, Bergfeld WF. Inadequate biopsy technique and specimen size: an alarming tread that compromises patient care and an appeal to our clinical colleagues. Arch. Dermatol. 2010;146(10):1180–1181. doi: 10.1001/archdermatol.2010.293. [DOI] [PubMed] [Google Scholar]
- 6.Zhou Y, Xing W, Maslov KI, Cornelius LA, Wang LV. Handheld photoacoustic microscopy to detect melanoma depth in vivo. Opt. Lett. 2014;39(16):4731–4734. doi: 10.1364/OL.39.004731. [DOI] [PMC free article] [PubMed] [Google Scholar]
- 7.Smith L, MacNeil S. State of the art in non-invasive imaging of cutaneous melanoma. Skin Res. Technol. 2011;17(3):257–269. doi: 10.1111/j.1600-0846.2011.00503.x. [DOI] [PubMed] [Google Scholar]
- 8.Dummer W, Blaheta HJ, Bastian BC, Schenk T, Brocher EB, Remy W. Preoperative Characterization of Pigmented Skin-Lesions by Epiluminescence Microscopy and High-Frequency Ultrasound. Arch. Dermatol. 1995;131(3):279–285. [PubMed] [Google Scholar]
- 9.Benvenuto-Andrade C, Dusza SW, Agero ALC, Scope A, Rajadhyaksha M, Halpern AC, Marghoob AA. Differences between polarized light dermoscopy and immersion contact dermoscopy for the evaluation of skin lesions. Arch. Dermatol. 2007;143(3):329–338. doi: 10.1001/archderm.143.3.329. [DOI] [PubMed] [Google Scholar]
- 10.Segura S, Puig S, Carrera C, Palou J, Malvehy J. Development of a two-step method for the diagnosis of melanoma by reflectance confocal microscopy. J. Am. Acad. Dermatol. 2009;61(2):216–229. doi: 10.1016/j.jaad.2009.02.014. [DOI] [PubMed] [Google Scholar]
- 11.Gambichler T, Regeniter P, Bechara FG, Orlikov A, Vasa R, Moussa G, Stucker M, Altmeyer P, Hoffmann K. Characterization of benign and malignant melanocytic skin lesions using optical coherence tomography in vivo. J. Am. Acad. Dermatol. 2007;57(4):629–637. doi: 10.1016/j.jaad.2007.05.029. [DOI] [PubMed] [Google Scholar]
- 12.Bittoun J, Querleux B, Darrasse L. Advances in MR imaging of the skin. Nmr. Biomed. 2006;19(7):723–730. doi: 10.1002/nbm.1101. [DOI] [PubMed] [Google Scholar]
- 13.Belhocine TZ, Scott AM, Even-Sapir E, Urbain JL, Essner R. Role of nuclear medicine in the management of cutaneous malignant melanoma. J. Nucl. Med. 2006;47(6):957–967. [PubMed] [Google Scholar]
- 14.Zhou Y, Yi X, Xing W, Hu S, Maslov KI, Wang LV. Microcirculatory changes identified by photoacoustic microscopy in patients with complex regional pain syndrome type I after stellate ganglion blocks. J. Biomed. Opt. 2014;19(8):086017. doi: 10.1117/1.JBO.19.8.086017. [DOI] [PMC free article] [PubMed] [Google Scholar]
- 15.Zhang HF, Maslov K, Stoica G, Wang LV. Functional photoacoustic microscopy for high- resolution and noninvasive in vivo imaging. Nat. Biotechnol. 2006;24(7):848. doi: 10.1038/nbt1220. [DOI] [PubMed] [Google Scholar]
- 16.Zhou Y, Liang J, Maslov KI, Wang LV. Calibration-free in vivo transverse blood flowmetry based on cross correlation of slow time profiles from photoacoustic microscopy. Opt. Lett. 2013;38(19):3882–3885. doi: 10.1364/OL.38.003882. [DOI] [PMC free article] [PubMed] [Google Scholar]
- 17.Wang LV, Hu S. Photoacoustic tomography: in vivo imaging from organelles to organs. Science. 2012;335(6075):1458–1462. doi: 10.1126/science.1216210. [DOI] [PMC free article] [PubMed] [Google Scholar]
- 18.Zhou Y, Zhang C, Yao D-K, Wang LV. Photoacoustic microscopy of bilirubin in tissue phantoms. J. Biomed. Opt. 2012;17(12):126019. doi: 10.1117/1.JBO.17.12.126019. [DOI] [PMC free article] [PubMed] [Google Scholar]
- 19.Wang LV. Multiscale photoacoustic microscopy and computed tomography. Nat. Photon. 2009;3(9):503–509. doi: 10.1038/nphoton.2009.157. [DOI] [PMC free article] [PubMed] [Google Scholar]
- 20.Zhou Y, Yao J, Maslov KI, Wang LV. Calibration-free absolute quantification of particle concentration by statistical analyses of photoacoustic signals in vivo. J. Biomed. Opt. 2014;19(3):37001. doi: 10.1117/1.JBO.19.3.037001. [DOI] [PMC free article] [PubMed] [Google Scholar]
- 21.Wang LV, Gao L. Photoacoustic Microscopy and Computed Tomography: From Bench to Bedside. Annu. Rev. Biomed. Eng. 2014;16:155–85. doi: 10.1146/annurev-bioeng-071813-104553. [DOI] [PMC free article] [PubMed] [Google Scholar]
- 22.Zhou Y, Yao J, Wang LV. Optical clearing-aided photoacoustic microscopy with enhanced resolution and imaging depth. Opt. lett. 2013;38(14):2592–2595. doi: 10.1364/OL.38.002592. [DOI] [PMC free article] [PubMed] [Google Scholar]
- 23.Liu W, Dowling JP, Murray WK, McArthur GA, Thompson JF, Wolfe R, Kelly JW. Rate of growth in melanomas. Arch. Dermatol. 2006;142(12):1551–1558. doi: 10.1001/archderm.142.12.1551. [DOI] [PubMed] [Google Scholar]
- 24.Needles A, Heinmiller A, Sun J, Theodoropoulos C, Bates D, Hirson D, Yin M, Foster FS. Development and initial application of a fully integrated photoacoustic micro-ultrasound system. IEEE Trans. Ultrason. Ferroelectr. Freq. Control. 2013;60(5):888–97. doi: 10.1109/TUFFC.2013.2646. [DOI] [PubMed] [Google Scholar]
- 25.Treeby BE, Jaros J, Rendell AP, Cox BT. Modeling nonlinear ultrasound propagation in heterogeneous media with power law absorption using a k-space pseudospectral method. J. Acoust. Soc. Am. 2012;131(6):4324–4336. doi: 10.1121/1.4712021. [DOI] [PubMed] [Google Scholar]
- 26.Treeby BE, Cox BT. k-Wave: MATLAB toolbox for the simulation and reconstruction of photoacoustic wave-fields. J. Biomed. Opt. 2010;15(2):021314. doi: 10.1117/1.3360308. [DOI] [PubMed] [Google Scholar]
- 27.Zhang C, Zhou Y, Li C, Wang LV. Slow-sound photoacoustic microscopy. Appl. Phys. Lett. 2013;102(16):3702. doi: 10.1063/1.4803444. [DOI] [PMC free article] [PubMed] [Google Scholar]
- 28.Kim C, Cho EC, Chen J, Song KH, Au L, Favazza C, Zhang Q, Cobley CM, Gao F, Xia Y, Wang LV. In Vivo Molecular Photoacoustic Tomography of Melanomas Targeted by Bioconjugated Gold Nanocages. ACS Nano. 2010;4(8):4559–4564. doi: 10.1021/nn100736c. [DOI] [PMC free article] [PubMed] [Google Scholar]


