Abstract
Type 1 diabetes (T1D) is an autoimmune disease in which insulin-producing beta cells are destroyed in the islets of Langerhans. One of its main pathological manifestations is the hyper-expression of Major Histocompatibility Complex I (MHC-I) by beta cells, which was first described over 3 decades ago yet its cause remains unknown. It might not only be a sign of beta cell dysfunction but could also render the cells susceptible to autoimmune destruction; for example, by islet-infiltrating CD8 T cells. In this report, we studied pancreas tissue from a 22-year-old non-diabetic male cadaveric organ donor who had been at high risk of developing T1D, in which autoantibodies against GAD and IA-2 were detected. Pancreas sections were analyzed for signs of inflammation. Multiple insulin-containing islets were identified, which hyper-expressed MHC-I. However, islet density and MHC-I expression exhibited a highly lobular and heterogeneous pattern even within the same section. In addition, many islets with high expression of MHC-I presented higher levels of CD8 T cell infiltration than normal islets. These results demonstrate the heterogeneity of human pathology that occurs early during the pre-diabetic, autoantibody positive phase, and should contribute to the understanding of human T1D.
Keywords: autoantibody positive, CD8 T cells, immunofluorescence, islet pathology, MHC-I, pancreatic islets, type 1 diabetes
Introduction
Pathological changes take place before the complete destruction of insulin-producing beta cells in the pancreatic islets of pre-diabetic individuals and might offer us insight into the earlier events underlying diabetes development. These coincide with the appearance of autoantibodies, which constitute, nowadays, the most common tool to predict future diabetes development (Pihoker et al. 2005). Usually, antibodies against insulin (IA) appear first, followed by the presence of autoantibodies against glutamate decarboxylase (GAD), insulinoma-associated protein 2 (IA-2) and zinc transporter 8 (ZnT8) (Gorus et al. 2013). Around the time of diagnosis, beta cell function is relatively rapidly lost but, in most cases, a significant residual number of functional beta cells can still be present, and they can be retained over many years (Coppieters et al. 2012; Coppieters et al. 2011; Gianani et al. 2010; Keenan et al. 2010). It is known that during the early pre-diabetic state, beta cells can show an abnormal phenotype with one pathognomonic sign being the increase in Major Histocompatibility Complex I (MHC-I) expression in both insulin-deficient and insulin-containing islets (Coppieters et al. 2012; Foulis et al. 1987a; Quah et al. 2014). This phenomenon was described 30 years ago by Bottazo at el. (1985) and by Foulis and colleagues (Foulis et al. 1987a). The trigger or cause of this elevated expression is still not understood.
As the disease progresses, a lymphocytic infiltration can be observed in some islets. This phenomenon, described more than 100 years ago by Schmidt (1902), was named insulitis by Von Meyenburg in 1940 and studied by LeCompte and Gepts in 1958 and in 1965, respectively. It is somewhat better characterized today and we know that the most frequent cell types are CD8 lymphocytes, followed by macrophages, B cells and CD4 T cells (Willcox et al. 2009). However, only a few studies have been carried out in non-diabetic, autoantibody positive (Ab+) donors, with the majority of the donors showing no leukocytic infiltration or beta cell damage (Gianani et al. 2006; In’t Veld et al. 2007; Wagner et al. 1994). The Network for Pancreatic Organ Donors with Diabetes (nPOD) has now opened up the unique possibility of investigating and characterizing the histopathological presentation of all the stages of the disease, from the pre-diabetic to the chronic state. In the present study, we investigated the pancreas of a double Ab+ cadaveric organ donor who had been at high risk of developing type 1 diabetes (T1D). We show that high MHC-I expression and CD8 T cell infiltration are remarkably heterogeneously distributed and differentially affect islets situated in different regions of the pancreas, creating a multifocal pattern. The cause(s) for this lobularity remain unclear, among them the potential for viral infections, the inflammatory milieu in the pancreas, as well as the intrinsic etiology.
Materials & Methods
Subject
Human pancreata were collected from a cadaveric organ donor through the Network for Pancreatic Organ donors with Diabetes (nPOD). Six-μm sections from frozen pancreas samples from three different blocks from the head (#02, #04 and #06), body (#02, #06 and #08) and tail (#02, #04 and #06) regions were obtained from case number 6197 (male, 22 years old, African American). All experimental procedures were approved by the La Jolla Institute for Allergy and Immunology Institutional Review Board-approved protocol number DI3-054-1112.
Immunofluorescence for Insulin, HLA-ABC and CD8
Sections were subject to a standard immunofluorescence staining protocol. Briefly, sections were fixed with 0.4% paraformaldehyde and blocked with goat serum. Staining for insulin and human leukocyte antigens (HLA)-ABC (MHC-I) was performed at room temperature for 1 hr using the following antibodies: polyclonal guinea pig anti-insulin (1/140; Dako, Carpinteria, CA) and mouse monoclonal (clone W6/32) IgG2a against a monomorphic epitope on the 45-kD polypeptide products of the HLA-A, B and C loci (1/100; Dako, Carpinteria, CA). Detection was done at room temperature for 45 min using polyclonal goat anti-guinea pig IgG, highly cross-adsorbed, Alexa Fluor 488 (1/1000; Invitrogen, Grand Island, NY) and polyclonal goat anti-mouse IgG2a, isotype-specific Alexa Fluor 594 (1/1000; Invitrogen, Grand Island, NY). Finally, sections were incubated for 1 hr at room temperature with mouse monoclonal anti-CD8 (clone RFT8, IgG1) conjugated to Alexa Fluor 647 (1:50; Southern Biotech, Birmingham, AL). After washing, sections were mounted with ProLong Gold antifade reagent (Molecular Probes, Grand Island, NY). Control pancreatic tissue sections with only secondary antibodies were used to determine non-specific staining.
Image Acquisition and Analysis
Images were acquired using a Zeiss Axio Scan Z.1 slide scanner (10× objective) and Zen software, Blue edition (Zeiss, Oberkochen, Germany). Whole tissue section images were divided into multiple smaller areas using a grid in order to facilitate analysis. Islets were then counted manually based on insulin staining, and islet density calculated per section based on the number of islets and the total area of the tissue using a custom macro developed for ImageJ (National Institutes of Health, Bethesda, MD). MHC-I expression was qualitatively evaluated and every islet classified based on the intensity and distribution of MHC-I staining as normal (no detectable expression by endocrine cells), elevated (high expression by endocrine cells not affecting the whole islet area) or hyper-expressing (high expression by endocrine cells affecting all the islet area). Infiltrating CD8 T cells were manually counted in each islet and matched to the MHC-I pattern. The percentages of elevated and hyper-expressing islets combined (MHC-I immunoreactive islets) were calculated and is represented as a heat map by using the Excel conditional format tool (Microsoft, Redmond, WA). The lowest values were assigned green tones and the highest, red tones. The same process was applied to CD8 T cell values per MHC-I immunoreactive islet section.
Statistical Analysis
Group differences were analyzed by using Kruskal–Wallis non-parametric test followed by Dunn test for multiple comparisons. Correlation analysis was done by using Spearman correlation with two-tailed significance test. All analyses were performed using GraphPad Prism version 6 (GraphPad Software, San Diego, CA). Data in bar graphs are presented as mean ± SD. Findings were assumed statistically significant at p≤0.05.
Results
Demographic Characteristics of Case #6197
The donor described in this manuscript was male, 22 years old, with a body mass index of 28.2, of African American descent, and positive for IA-2 and GAD autoantibodies. High HLA resolution analysis showed the following genotype: A*02:02, 24:02; DRB1*03:02, 07:01; DQA1*02:01, 04:01; DQB1*02:02, 04:02. The nPOD pathology core indicated the presence of multiple insulin- and glucagon-positive islets at first screening. Some insulitis was also reported (rare) as well as islet hyperemia. Finally, a mild, multifocal chronic pancreatitis was described. The donor was found to be positive for cytomegalovirus (CMV) and Epstein-Barr virus (EBV) IgG in the serum.
Systematic Histological Analysis of Pancreatic Sections
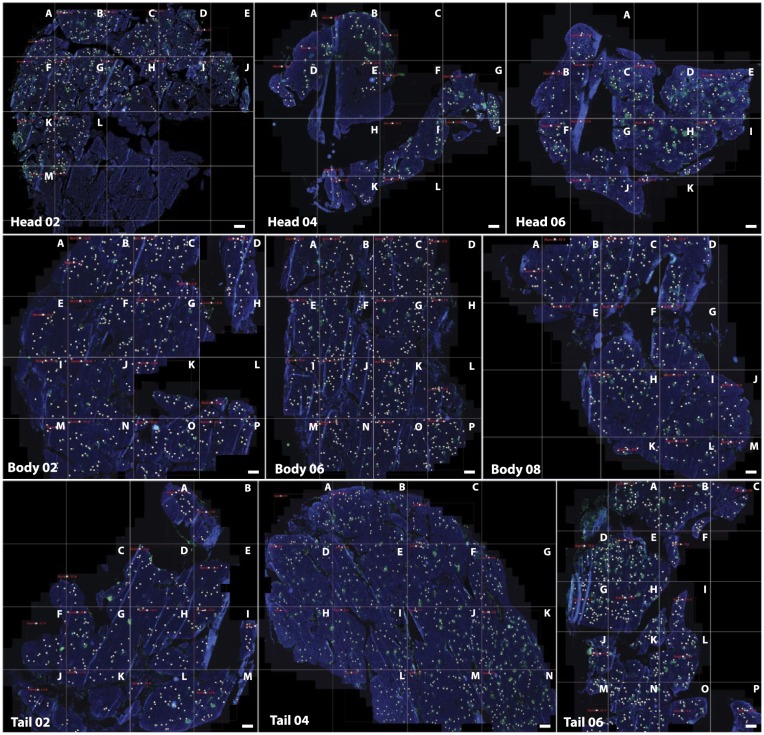
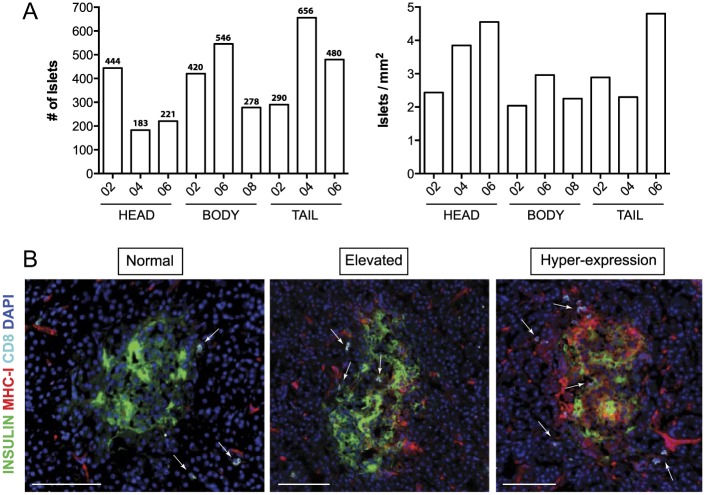
Frozen pancreatic sections from three different blocks prepared from the head, body and tail of the pancreas were analyzed (head blocks #02, #04 and #06; body blocks #02, #06 and #08 and tail blocks #02, #04 and #06). Each section was divided into several quadrants using a grid. In each of these areas, islets were manually counted (Fig. 1). The number of total islets varied depending on the section and region. A minimum of 183 islets were counted in the head block #04, whereas 656 islets were detected in the tail block #04 (Fig. 2A). Islet density was then calculated based on the total tissue area and ranged from 2.04 islets/mm2 to 4.80 islets/mm2 and was found to be higher in the pancreatic head and tail (3.61 vs 3.33 islets/mm2) than in the body (2.41 islets/mm2) (Fig. 2A). Islets were then classified based on the level of MHC-I expression as normal (no detectable expression in endocrine cells), elevated (high expression of MHC-I by endocrine cells not affecting the whole islet area) and hyper-expressing (high expression of MHC-I by endocrine cells affecting all the islet area) (Fig. 2B).
Figure 1.
Frozen pancreatic tissue sections were stained for insulin (green), MHC-I (red), CD8 (white) and DAPI (blue) following a standard immunofluorescence protocol. Sections were scanned and divided into smaller areas using a grid in order to facilitate analysis. A letter was assigned to each quadrant (A–P). Whole-tissue images are shown for each of the sections. Only insulin and DAPI staining are depicted for clarity purposes. White dots indicate islets. Scale, 1000 µm.
Figure 2.
Islet number and classification. (A) The absolute numbers of islets for each section and block are shown in the bar graphs. The specific number of islets is indicated at the top of each bar (left panel). Islet density (islets/mm2) was calculated based on the number of islets and total tissue area, also shown as bar graphs (right panel). (B) Islets were classified based on the level of MHC-I expression as normal (left panel, no detectable expression in endocrine cells), elevated (center panel, high expression of MHC-I by endocrine cells not affecting the whole islet area) and hyper-expressing (right panel, high expression of MHC-I by endocrine cells affecting all the islet area). Arrows indicate the presence of CD8 T cells. Insulin is shown in green, MHC-I in red, CD8 in white and DAPI in blue. Scale, 100 µm.
MHC-I Hyper-expression Is Heterogeneously Distributed across Multiple Islets and Regions in the Pancreas
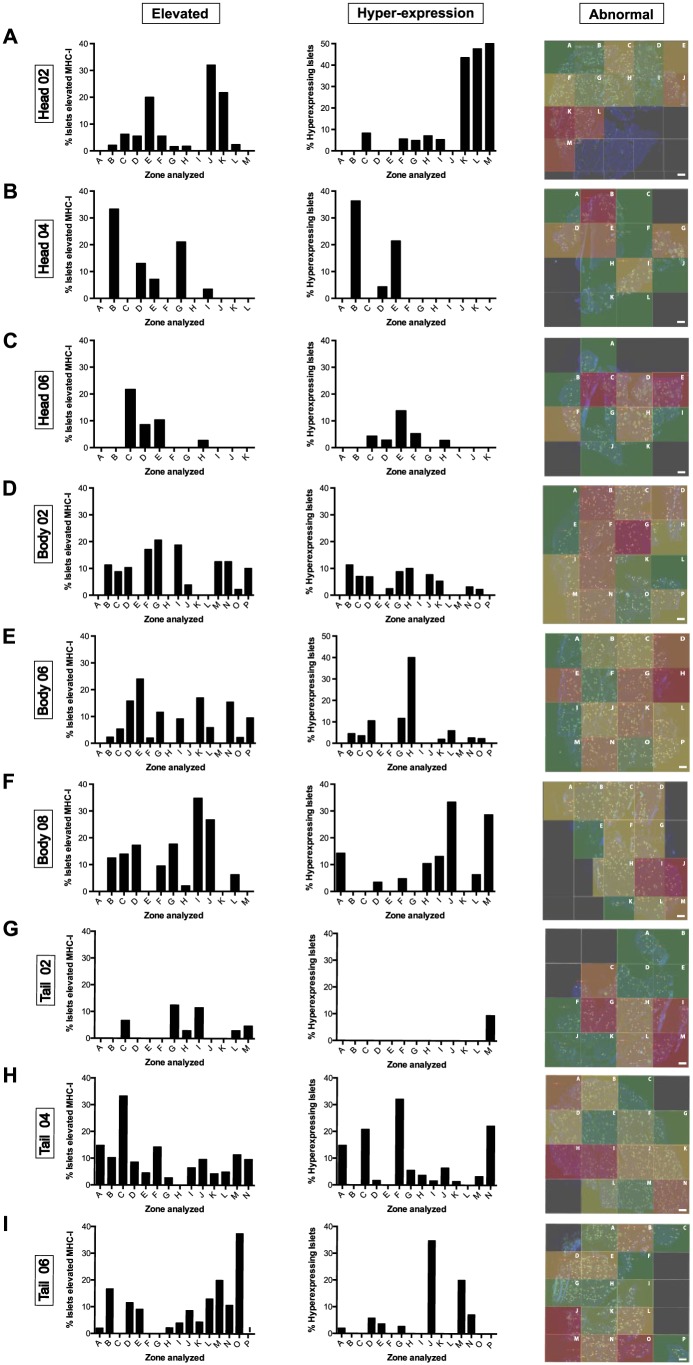
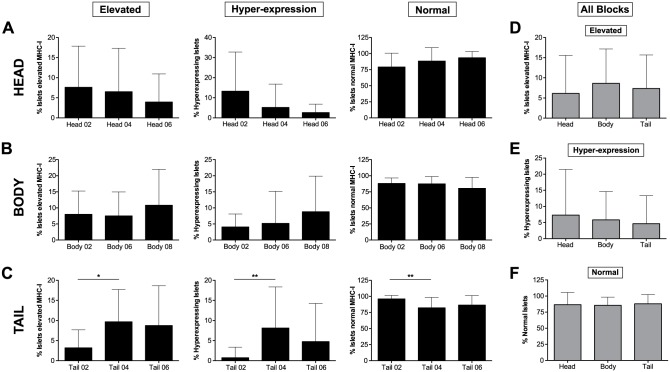
To study islet MHC-I expression and localization in the pancreas, staining for insulin and MHC-I was performed across multiple sections and blocks from the head, body and tail of the pancreas. The number of islets and the expression of MHC-I was analyzed manually for each section and the data are represented as bar graphs and heat maps (see Materials & Methods). In head block #02, 444 islets were counted. Of these, 7.61% (range, 0% to 32%; A to M) and 13.24% (range, 0% to 50%, A to M) of the islets showed elevated MHC-I expression and hyper-expression, respectively (Figs. 3A, 4A). In head blocks #04 and #06, 183 and 221 islets were counted. Whereas elevated islets constituted 6.50% (range, 0% to 33.3%; A to L) and 3.94% (0% to 21.7%; A to K), respectively, hyper-expression was detected in 5.18% (0% to 36.3%; A to L) and 2.63% (0% to 47.6%, A to K) in these two blocks (Figs. 3B, 3C, 4A). Overall, combined elevated and hyper-expressing islets (MHC-I immunoreactive phenotype) constituted 13.43% of the islets in the head region.
Figure 3.
The percentages of elevated (left panel) and hyper-expressing (center panel) islets from each quadrant of the pancreatic sections depicted in Figure 1 were calculated, and the data are shown as bar graphs. Heat maps (right panel) show the areas with higher (red) or lower (green) percentages of MHC-I immunoreactive islets within the sections. (A) Head block # 02; (B) head block #04; (C) head block #06; (D) body block #02; (E) body block #06; (F) body block #08; (G) tail block #02; (H) tail block #04; (I) tail block #06. Scale, 1000 µm.
Figure 4.
The mean percentages of elevated (left panel), hyper-expressing (center panel) and normal (right panel) islets are shown as bar graphs for each block in (A) head; (B) body and (C) tail portions of the pancreas. In (D), (E) and (F), overall head, body and tail values from all the blocks are shown for elevated, hyper-expressing and normal islets. * p≤0.05; **p≤0.01.
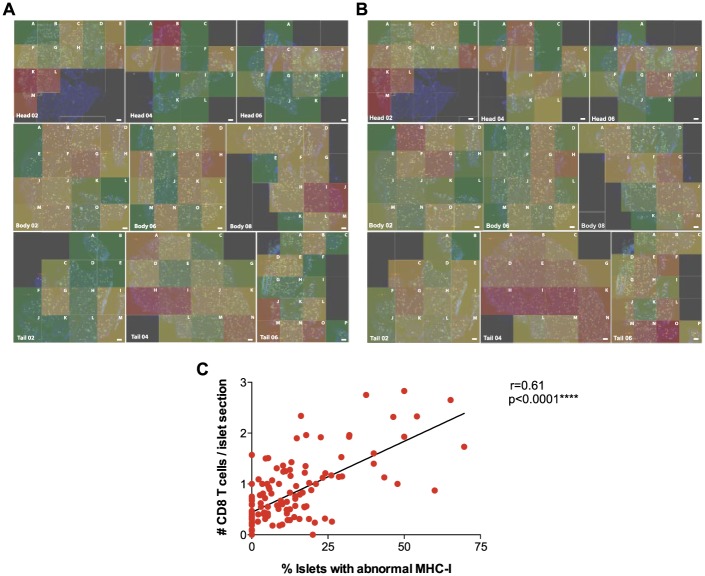
Next, we performed the same analysis for body and tail regions. A total of 420, 546 and 278 islets were counted in body blocks #02, #06 and #08, respectively. Of this, 7.99% (range, 0% to 20.6%; A to P), 7.50% (range, 0% to 17%; A to P), and 10.82% (range, 0% to 34.8%; A to M) of the islets presented elevated MHC-I expression, whereas a lower number of islets was found to hyper-express it in each of the body blocks (4.05% (range, 0% to 11.3%; A to P), 5.17 (range, 0% to 40%; A to P), and 8.78% (range, 0% to 33.3%, A to M) respectively; Figs. 3D–3F, 4B). In the tail, 290, 656 and 480 islets were counted in blocks #02, #04 and #06, respectively, with 3.19% (range, 0% to 12.5%; A to M), 9.67% (0% to 33.3%; A to N) and 8.74% (range, 0% to 37.5%; A to P) presenting increased MHC-I expression. Hyper-expressing islets were found to be lower in this region, with 0.73% (range, 0% to 9.5%; A to M), 8.13% (range, 0% to 32.1%; A to N) and 4.75% (range, 0% to 34.8%; A to P) measured in the islets for tail blocks #02, #04 and #06, respectively (Figs. 3G–3I, 4C). No significant differences were found between different blocks except for tail block #02 which presented a lower percentage of MHC-I immunoreactive islets than the other blocks (Fig. 4A–4C). Finally, values from all regions were combined in a heat map in which the areas with higher percentages of MHC-I immunoreactive islets are shown in red tones whereas those areas containing mainly normal islets are depicted in green. We found that higher percentages of MHC-I immunoreactive islets were present in head blocks #02 and #04, body block #08 and tail block #04. Conversely, normal islets were scattered across all of the blocks (see overall data, presented later in Fig. 7A).
Figure 7.
Summary Data. (A) Overall percentages of MHC-I immunoreactive islets (elevated and hyper-expressing islets) are represented as a heat map. Areas with higher (red) or lower (green) presence of affected islets are shown for all of the sections. (B) Overall mean numbers of CD8 T cells per islet section (elevated, hyper-expressing and normal) are represented as a heat map. Areas that contained islets with higher (red) or lower (green) numbers of infiltrating CD8 T cells are shown for all sections together. (C) Correlation analysis of the percentages of MHC-I immunoreactive islets and the number of CD8 T cells per islet section (r = 0.61). ****p≤0.0001. Scale, 1000 µm.
The affected islets (elevated and hyper-expressing islets combined) constituted 13.4% of the islets in the body section of the pancreas, which was almost the same percentage as that found in the head (14.4%) and the tail (11.9%) sections. In addition, no significant differences were detected between head, body and tail regions regarding the percentages of elevated, hyper-expressing or normal islets (Fig. 4D–4F).
CD8 T Cells Preferentially Infiltrate Islets with High Levels of MHC-I Expression
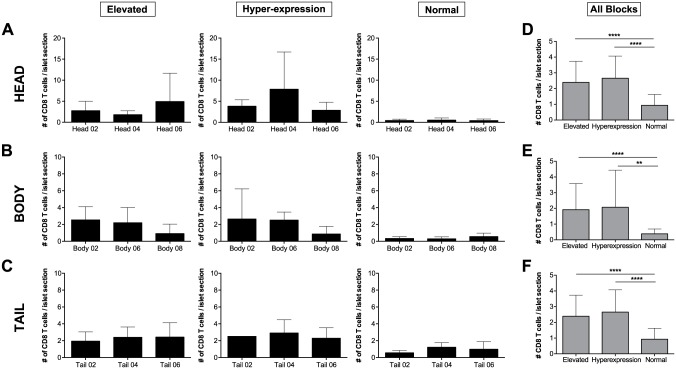
To evaluate the possible link between high MHC-I expression and infiltration, CD8 T cells were quantified on a per islet basis and correlated with their MHC-I pattern. High infiltration was only noticed in some islets. Similar values of CD8 T cells per elevated or hyper-expressing islet were found in head block #02 (mean values of 2.73 and 3.81 CD8 T cells per islet, respectively). In head block #04, mean values of 1.79 and 7.86 CD8 T cells were found to infiltrate elevated and hyper-expressing islets, whereas 4.91 and 2.85 CD8 T cells were found in head block #06 for MHC-I immunoreactive islets (Figs. 5A–5C, 6A). Accordingly, similar values were found for elevated islets in body block #02 and #06 (2.53 vs 2.19) whereas body block #08 had a lower level of infiltration (0.91 CD8 T cells/elevated islet section). Similarly, hyper-expressing islets were infiltrated by a mean of 2.64, 2.51 and 0.86 CD8 T cells/islet section in blocks #02, #04 and #06, respectively (Figs. 5D–5F, 6B). Finally, no major differences were found in the tail between regions. Infiltration ranged from 1.93 to 2.42 CD8 T cells per elevated islet and from 2.28 to 2.9 CD8 T cells per hyper-expressing islet in the tail blocks analyzed (Figs. 5G–5I, 6C).
Figure 5.
The mean number of CD8 T cells per elevated (left panel) and hyper-expressing (center panel) islet from each quadrant of the sections depicted in Figure 1 was determined and the data are shown as bar graphs. Heat maps (right panel) show the areas with higher (red) or lower (green) numbers of CD8 T cells per MHC-I immunoreactive islet (elevated and hyper-expressing) within the sections. (A) Head block #02; (B) head block #04; (C) head block #06; D) body block #02; E) body block #06; F) body block #08; (G) tail block #02; (H) tail block #04; (I) tail block #06. Scale, 1000 µm.
Figure 6.
The mean number of CD8 T cells per elevated (left panel), hyper-expressing (center panel), and normal (right panel) islets shown as bar graphs for each block in (A) head; (B) body and (C) tail blocks. The overall mean number of CD8 T cells per elevated, hyper-expressing and normal islet is shown for all the blocks combined in the (D) head, (E) body and (F) tail portions of the pancreas. *p≤0.05; **p≤0.01; ***p≤0.001; ****p≤0.0001.
Across the three blocks examined in each of the three regions, normal islets presented similar numbers of infiltrating CD8 T cells. In the head region, mean values of 0.43, 0.50 and 0.40 CD8 T cells per islet section were found for blocks #02, #04 and #06. The three blocks from the body presented with mean values of 0.33, 0.29 and 0.55 CD8 T cells per islet section, whereas the tail showed 0.56, 1.22 and 0.98 CD8 T cells, respectively (Fig. 6A–6C).
Overall, islets with high MHC-I expression presented a higher number of infiltrating CD8 T cells than normal islets in all blocks. In addition, these differences were significant in head, body and tail regions. No differences were found between elevated and hyper-expressing islet infiltration in any of the analyzed areas (Fig. 6). Lastly, values from all regions were placed together in a heat map in which the areas with higher number of infiltrating CD8 T cells per islet section are shown in red tones whereas quadrants containing less CD8 T cells are depicted in green. We found the highest number of infiltrating CD8 T cells per islet in head block #02 and tail blocks #04 and #06, and reduced numbers scattered across all of the blocks, particularly in tail block #02 (Fig. 7B).
Correlation analysis between the percentages of MHC-I immunoreactive islets and the number of CD8 T cells per islet section in each quadrant showed strong correlation (r = 0.6) with a moderate linear fit (Fig. 7C).
Discussion
In the present study, we have performed a systematic analysis of two pathognomonic signs of early diabetes, MHC-I expression and CD8 T cell infiltration into islets. Pancreatic samples from a double Ab+ individual with no clinical signs of diabetes showed high MHC-I expression affecting approximately 14% of the islets in head and body and 12% in the tail of the pancreas. Differences in islet density and affected islets could be due to the samples analyzed and cannot be linked to disease progression by themselves. Areas of islets with normal MHC-I expression were frequently contiguous with areas of hyper-expressing islets. In some of these areas, almost 50% of the islets showed hyper-expression of MHC-I. In addition, we observed an intermediate level of expression that was apparent in some islets. In these so-called “elevated islets” not all of the endocrine cells within the islet expressed MHC-I. Their distribution was also scattered across the pancreatic sections. Hence, islets with a MHC-I immunoreactive phenotype (elevated and hyper-expressing MHC-I) presented a patchy and sometimes lobular distribution. CD8 T cell infiltration, although mild, was also detected in the affected islets and was, on average, higher in islets with high MHC-I (elevated and hyper-expression) as compared with islets with a normal MHC-I expression. In 1985, a case report by Botazzo and colleagues described the pathological findings in the pancreas of a 12-year-old girl with newly-diagnosed T1D, who died within 24 hours of diagnosis (Bottazzo et al. 1985). In this important study, “a marked increase” in MHC-I (HLA-A, B and C) expression was observed in some islets. In addition, analysis of islet infiltration showed the presence of a predominant cytotoxic T cell population (Bottazzo et al. 1985). In 1987, Foulis and colleagues confirmed the presence of a high expression of MHC-I molecules on endocrine cells from type 1 diabetic donors, while elevated levels were uncommon in the islets of non-diabetic donors (Foulis et al. 1987a). It was also mentioned that the frequency of hyper-expression of MHC-I by insulin-containing islets could be accurately estimated from a single section. At that time, the possible underestimation of pathological alterations like insulitis based on the sole analysis of one tissue section from one particular block was a concern (Foulis et al. 1987a). In the present study, we have performed a comprehensive and systematic analysis in multiple blocks from the pancreatic head, body and tail to overcome this possible limitation. As shown here, the lobularity and heterogeneity of the human disease increases the complexity of possible pathological interpretations and therefore conclusions obtained from the study of one tissue section should, in general and depending on the targeted molecule or cell, be interpreted with caution.
Insulitis is present in both mice and humans but major differences have been reported. In mouse models, infiltration starts in the peri-islet area and it is comparatively massive, whereas, in humans, as described here, it is usually mild. Additionally, we and others have shown that only a small percentage of islets are inflamed during the pre-diabetic phase (Coppieters et al. 2012; In’t Veld et al. 2007). Conversely, almost all of the islets from 18-week-old Non-Obese Diabetic (NOD) mice show heavily infiltration (Carrero et al. 2013; Eisenbarth 1986). Furthermore, in both NOD mice and humans, islet beta cells up-regulate MHC-I during the inflammatory response, and this process is important for disease progression. As reported by Hamilton-Williams et al. (2003), MHC-I influences beta cell destruction by infiltrating cytotoxic T cells. NOD mice lacking MHC-I expression on beta cells presented with the same level of insulitis as those with normal MHC-I expression levels but hyperglycemia was delayed or abolished. Our results additionally show that there is a strong correlation between islet MHC-I expression and infiltrating CD8 T cells in humans. Areas containing mostly normal islets presented a lower but still evident number of CD8 T cells per islet section as compared with those with a higher percentage of MHC-I immunoreactive islets. This could indicate that CD8 T cells infiltrate the islets even before the up-regulation of MHC-I. However, the opposite might also be true, as similar numbers of CD8 T cells have been previously found in the islets of non-diabetic individuals (Rodriguez-Calvo et al. 2014). The differences between mice and human pathology are therefore intriguing, and may reflect the etiology or primary cause of the disease; these differences, however, may also just reflect an overall slower disease course in humans (years versus months in mice).
The link between MHC-I hyper-expression and virus infection has often been debated over the past 30 years. Our results here cannot confirm the presence of a viral infection but the lobular pattern is indicative of the usual patchy appearance of viral antigen found during infection in a solid organ (Capua et al. 2013; Honeyman et al. 2014; Schneider and von Herrath 2014). Infection of some islets might trigger an antiviral response and therefore an increase in MHC-I (Foulis et al. 1987b). For example, growing evidence suggests that enteroviruses (EV) or neutralizing antibodies against them can be detected in pancreata and in the serum from T1D donors (Laitinen et al. 2014; Oikarinen et al. 2014; Richardson et al. 2013; Richardson et al. 2009; Schneider and von Herrath 2014; Willcox et al. 2011). EV can effectively infect beta cells, which express the coxsackievirus and adenovirus receptor (CAR) (Oikarinen et al. 2008; Ylipaasto et al. 2004). Infection of beta cells could trigger the release of interferons and islet antigens (Hober and Sauter 2010), which might be recognized by auto-reactive T cells and result in autoimmune destruction. However, no EV proteins or genome were detected in the pancreas of this particular autoantibody positive donor by immunohistochemistry and PCR (Richardson S. and Oikarinen M., personal communication). We cannot completely rule out the presence of a viral infection, as not all of the regions of the pancreas were analyzed. In addition, a previous infection could have taken place, as it has been shown that EVs can persist due to deletions in their genome that make the virus an extremely slow replicator and displace the wild type forms during a chronic infection (Tracy et al. 2014). Additional and new techniques will be needed to detect these terminally deleted viruses in pancreata from pre- or diabetic individuals to ascertain their possible role(s) in the pathogenesis of T1D. Slow-replicating, endogenous and/or latent viruses like herpesviruses may also be good candidates, as they are commonly found in humans and can persist in the pancreas without exhibiting cytopathic effects (Marguerat et al. 2004; Mason et al. 2014; Ramondetti et al. 2012). The MHC-I pattern shown here could match a possible lobular spreading of these viruses.
In conclusion, in this systematic study, MHC-I expression and CD8 T cell infiltration have been analyzed on a per-islet basis in whole tissue sections from multiple regions of the pancreas. Our data indicate that, during the pre-diabetic state, islets might undergo important pathophysiological changes that occur in a patchy, almost ‘vitiligo-like’ fashion (Eisenbarth 2010), and highlight the importance of understanding the precise cause of these changes. More insight into autoantibody-positive cases could reveal early pathological events of T1D and thus could also pinpoint future preventive strategies.
Acknowledgments
The authors thank Grzegorz Chodaczek, Zbigniew Mikulski and Bill Kiosses of La Jolla Institute for Allergy and Immunology for help with image acquisition and analysis and Priscilla Colby of La Jolla Institute for Allergy and Immunology for administrative assistance.
Footnotes
Authors’ Note: Published research data and unique materials created in the process of this research will be shared on request by other researchers within the scientific community in accordance with policies adopted by NIH.
Declaration of Conflicting Interests: The authors declared the following potential conflicts of interest with respect to the research, authorship, and/or publication of this article: MGVH is an employee of Novo Nordisk. No other potential conflicts of interest relevant to this article were reported.
Funding: The authors disclosed receipt of the following financial support for the research, authorship, and/or publication of this article: This research was performed with the support of nPOD, a collaborative T1D research project sponsored by the Juvenile Diabetes Research Foundation International (JDRF). Organ Procurement Organizations, partnering with nPOD to provide research resources, are listed at www.jdrfnpod.org/our-partners.php. This study was supported by National Institutes of Health/National Institute of Allergy and Infectious Diseases Grant R01 AI092453-03.
References
- Bottazzo GF, Dean BM, McNally JM, MacKay EH, Swift PG, Gamble DR. (1985). In situ characterization of autoimmune phenomena and expression of HLA molecules in the pancreas in diabetic insulitis. N Engl J Med 313:353-360. [DOI] [PubMed] [Google Scholar]
- Capua I, Mercalli A, Pizzuto MS, Romero-Tejeda A, Kasloff S, De Battisti C, Bonfante F, Patrono LV, Vicenzi E, Zappulli V, Lampasona V, Stefani A, Doglioni C, Terregino C, Cattoli G, Piemonti L. (2013). Influenza A viruses grow in human pancreatic cells and cause pancreatitis and diabetes in an animal model. J Virol 87:597-610. [DOI] [PMC free article] [PubMed] [Google Scholar]
- Carrero JA, Calderon B, Towfic F, Artyomov MN, Unanue ER. (2013). Defining the transcriptional and cellular landscape of type 1 diabetes in the NOD mouse. PLoS One 8:e59701. [DOI] [PMC free article] [PubMed] [Google Scholar]
- Coppieters KT, Dotta F, Amirian N, Campbell PD, Kay TW, Atkinson MA, Roep BO, von Herrath MG. (2012). Demonstration of islet-autoreactive CD8 T cells in insulitic lesions from recent onset and long-term type 1 diabetes patients. J Exp Med 209:51-60. [DOI] [PMC free article] [PubMed] [Google Scholar]
- Coppieters KT, Wiberg A, Amirian N, Kay TW, von Herrath MG. (2011). Persistent glucose transporter expression on pancreatic beta cells from longstanding type 1 diabetic individuals. Diabetes Metab Res Rev 27:746-754. [DOI] [PMC free article] [PubMed] [Google Scholar]
- Eisenbarth GS. (2010). Banting Lecture 2009: An unfinished journey: molecular pathogenesis to prevention of type 1A diabetes. Diabetes 59:759-774. [DOI] [PMC free article] [PubMed] [Google Scholar]
- Eisenbarth GS. (1986). Type I diabetes mellitus. A chronic autoimmune disease. N Engl J Med 314:1360-1368. [DOI] [PubMed] [Google Scholar]
- Foulis AK, Farquharson MA, Hardman R. (1987a). Aberrant expression of class II major histocompatibility complex molecules by B cells and hyperexpression of class I major histocompatibility complex molecules by insulin containing islets in type 1 (insulin-dependent) diabetes mellitus. Diabetologia 30:333-343. [DOI] [PMC free article] [PubMed] [Google Scholar]
- Foulis AK, Farquharson MA, Meager A. (1987b). Immunoreactive alpha-interferon in insulin-secreting beta cells in type 1 diabetes mellitus. Lancet 2:1423-1427. [DOI] [PubMed] [Google Scholar]
- Gepts W. (1965). Pathologic anatomy of the pancreas in juvenile diabetes mellitus. Diabetes 14:619-633. [DOI] [PubMed] [Google Scholar]
- Gianani R, Campbell-Thompson M, Sarkar SA, Wasserfall C, Pugliese A, Solis JM, Kent SC, Hering BJ, West E, Steck A, Bonner-Weir S, Atkinson MA, Coppieters K, von Herrath M, Eisenbarth GS. (2010). Dimorphic histopathology of long-standing childhood-onset diabetes. Diabetologia 53:690-698. [DOI] [PubMed] [Google Scholar]
- Gianani R, Putnam A, Still T, Yu L, Miao D, Gill RG, Beilke J, Supon P, Valentine A, Iveson A, Dunn S, Eisenbarth GS, Hutton J, Gottlieb P, Wiseman A. (2006). Initial results of screening of nondiabetic organ donors for expression of islet autoantibodies. J Clin Endocrinol Metab 91:1855-1861. [DOI] [PubMed] [Google Scholar]
- Gorus FK, Keymeulen B, Veld PA, Pipeleers DG. (2013). Predictors of progression to Type 1 diabetes: preparing for immune interventions in the preclinical disease phase. Expert Rev Clin Immunol 9:1173-1183. [DOI] [PubMed] [Google Scholar]
- Hamilton-Williams EE, Palmer SE, Charlton B, Slattery RM. (2003). Beta cell MHC class I is a late requirement for diabetes. Proc Natl Acad Sci U S A 100:6688-6693. [DOI] [PMC free article] [PubMed] [Google Scholar]
- Hober D, Sauter P. (2010). Pathogenesis of type 1 diabetes mellitus: interplay between enterovirus and host. Nat Rev Endocrinol 6:279-289. [DOI] [PubMed] [Google Scholar]
- Honeyman MC, Laine D, Zhan Y, Londrigan S, Kirkwood C, Harrison LC. (2014). Rotavirus infection induces transient pancreatic involution and hyperglycemia in weanling mice. PLoS One 9:e106560. [DOI] [PMC free article] [PubMed] [Google Scholar]
- In’t Veld P, Lievens D, De Grijse J, Ling Z, Van der Auwera B, Pipeleers-Marichal M, Gorus F, Pipeleers D. (2007). Screening for insulitis in adult autoantibody-positive organ donors. Diabetes 56:2400-2404. [DOI] [PubMed] [Google Scholar]
- Keenan HA, Sun JK, Levine J, Doria A, Aiello LP, Eisenbarth G, Bonner-Weir S, King GL. (2010). Residual insulin production and pancreatic ss-cell turnover after 50 years of diabetes: Joslin Medalist Study. Diabetes 59:2846-2853. [DOI] [PMC free article] [PubMed] [Google Scholar]
- Laitinen OH, Honkanen H, Pakkanen O, Oikarinen S, Hankaniemi MM, Huhtala H, Ruokoranta T, Lecouturier V, Andre P, Harju R, Virtanen SM, Lehtonen J, Almond JW, Simell T, Simell O, Ilonen J, Veijola R, Knip M, Hyoty H. (2014). Coxsackievirus B1 is associated with induction of beta-cell autoimmunity that portends type 1 diabetes. Diabetes 63:446-455. [DOI] [PubMed] [Google Scholar]
- Lecompte PM. (1958). Insulitis in early juvenile diabetes. AMA Arch Pathol 66:450-457. [PubMed] [Google Scholar]
- Marguerat S, Wang WY, Todd JA, Conrad B. (2004). Association of human endogenous retrovirus K-18 polymorphisms with type 1 diabetes. Diabetes 53:852-854. [DOI] [PubMed] [Google Scholar]
- Mason MJ, Speake C, Gersuk VH, Nguyen QA, O’Brien KK, Odegard JM, Buckner JH, Greenbaum CJ, Chaussabel D, Nepom GT. (2014). Low HERV-K(C4) copy number is associated with type 1 diabetes. Diabetes 63:1789-1795. [DOI] [PubMed] [Google Scholar]
- Oikarinen M, Tauriainen S, Honkanen T, Vuori K, Karhunen P, Vasama-Nolvi C, Oikarinen S, Verbeke C, Blair GE, Rantala I, Ilonen J, Simell O, Knip M, Hyoty H. (2008). Analysis of pancreas tissue in a child positive for islet cell antibodies. Diabetologia 51:1796-1802. [DOI] [PubMed] [Google Scholar]
- Oikarinen S, Tauriainen S, Hober D, Lucas B, Vazeou A, Sioofy-Khojine A, Bozas E, Muir P, Honkanen H, Ilonen J, Knip M, Keskinen P, Saha MT, Huhtala H, Stanway G, Bartsocas C, Ludvigsson J, Taylor K, Hyoty H, VirDiab Study G. (2014). Virus antibody survey in different European populations indicates risk association between coxsackievirus B1 and type 1 diabetes. Diabetes 63:655-662. [DOI] [PubMed] [Google Scholar]
- Pihoker C, Gilliam LK, Hampe CS, Lernmark A. (2005). Autoantibodies in diabetes. Diabetes 54(Suppl 2):S52-S61. [DOI] [PubMed] [Google Scholar]
- Quah HS, Miranda-Hernandez S, Khoo A, Harding A, Fynch S, Elkerbout L, Brodnicki TC, Baxter AG, Kay TW, Thomas HE, Graham KL. (2014). Deficiency in type I interferon signaling prevents the early interferon-induced gene signature in pancreatic islets but not type 1 diabetes in NOD mice. Diabetes 63:1032-1040. [DOI] [PubMed] [Google Scholar]
- Ramondetti F, Sacco S, Comelli M, Bruno G, Falorni A, Iannilli A, d’Annunzio G, Iafusco D, Songini M, Toni S, Cherubini V, Carle F, Group RS. (2012). Type 1 diabetes and measles, mumps and rubella childhood infections within the Italian Insulin-dependent Diabetes Registry. Diabet Med 29:761-766. [DOI] [PubMed] [Google Scholar]
- Richardson SJ, Leete P, Bone AJ, Foulis AK, Morgan NG. (2013). Expression of the enteroviral capsid protein VP1 in the islet cells of patients with type 1 diabetes is associated with induction of protein kinase R and downregulation of Mcl-1. Diabetologia 56:185-193. [DOI] [PubMed] [Google Scholar]
- Richardson SJ, Willcox A, Bone AJ, Foulis AK, Morgan NG. (2009). The prevalence of enteroviral capsid protein vp1 immunostaining in pancreatic islets in human type 1 diabetes. Diabetologia 52:1143-1151. [DOI] [PubMed] [Google Scholar]
- Rodriguez-Calvo T, Ekwall O, Amirian N, Zapardiel-Gonzalo J, von Herrath MG. (2014). Increased Immune Cell Infiltration of the Exocrine Pancreas: A Possible Contribution to the Pathogenesis of Type 1 Diabetes. Diabetes 63:3880-3890. [DOI] [PMC free article] [PubMed] [Google Scholar]
- Schmidt M. (1902). Ueber die beziehung der langenhans’ schen inseln des pankreas zum diabetes mellitus. München Med Wochenschr 49:51-54. [Google Scholar]
- Schneider DA, von Herrath MG. (2014). Potential viral pathogenic mechanism in human type 1 diabetes. Diabetologia 57:2009-2018. [DOI] [PMC free article] [PubMed] [Google Scholar]
- Tracy S, Smithee S, Alhazmi A, Chapman N. (2014). Coxsackievirus can persist in murine pancreas by deletion of 5’ terminal genomic sequences. J Med Virol 87:240-247. [DOI] [PubMed] [Google Scholar]
- Von Meyenburg M. (1940). Ueber “Insulitis” bei Diabetes. Schweiz Med Wochenschr 21:554-557. [Google Scholar]
- Wagner R, McNally JM, Bonifacio E, Genovese S, Foulis A, McGill M, Christie MR, Betterle C, Bosi E, Bottazzo GF. (1994). Lack of immunohistological changes in the islets of nondiabetic, autoimmune, polyendocrine patients with beta-selective GAD-specific islet cell antibodies. Diabetes 43:851-856. [DOI] [PubMed] [Google Scholar]
- Willcox A, Richardson SJ, Bone AJ, Foulis AK, Morgan NG. (2011). Immunohistochemical analysis of the relationship between islet cell proliferation and the production of the enteroviral capsid protein, VP1, in the islets of patients with recent-onset type 1 diabetes. Diabetologia 54:2417-2420. [DOI] [PubMed] [Google Scholar]
- Willcox A, Richardson SJ, Bone AJ, Foulis AK, Morgan NG. (2009). Analysis of islet inflammation in human type 1 diabetes. Clin Exp Immunol 155:173-181. [DOI] [PMC free article] [PubMed] [Google Scholar]
- Ylipaasto P, Klingel K, Lindberg AM, Otonkoski T, Kandolf R, Hovi T, Roivainen M. (2004). Enterovirus infection in human pancreatic islet cells, islet tropism in vivo and receptor involvement in cultured islet beta cells. Diabetologia 47:225-239. [DOI] [PubMed] [Google Scholar]


